Introduction
Advancements in radiotherapy (RT) technology yield accurately delivered doses to the target while minimising radiation dose to surrounding normal tissue. Intensity-modulated radiotherapy (IMRT) provides a highly conformal dose distribution to the target and reduces the toxicity of the treatment.Reference Rehman, Zhara and Ahmad1,Reference Taylor and Powell2
Volumetric-modulated arc therapy (VMAT) is a novel approach to radiation therapy. This form of IMRT delivery achieves high-dose conformity by optimising gantry speed, multileaf collimator (MLC) leaf positions and dose rate, providing a high-dose distribution in a short treatment time.Reference Teoh, Clark, Wood, Whitaker and Nisbet3
Pelvic RT has a higher setup uncertainty in patient positioning and uncertainties caused by organ motion (e.g., respiratory, bladder filling or rectal filling). The geometric uncertainty in treatment delivery is very important.Reference Sehgal, Anand, Munjal and Bansal4 The International Commission on Radiation Units and Measurements (ICRU) 50 and 62 recommends creating a planning target volume (PTV) with a margin to the clinical target volume (CTV) to ensure that the CTV receives the tumouricidal radiation dose. The PTV margin depends on interfractional patient setup error, intrafractional tumour motion error, patient immobilisation, uncertainties in contouring the tumour volume, etc.Reference Kanakavelu and Jebaseelan5,Reference Kalita, Bora, Bhattacharyya, Singh, Medhi and Shashank6
Image-guided radiation therapy (IGRT) is the use of imaging during radiation therapy to ensure accurate positioning of treatment delivery.Reference Goyal and Kataria7 Cone beam computed tomography (CBCT) image-guided system in VMAT is commonly used for verification of setup error and correct patient positioning before each treatment fraction.Reference Yao, Zhu and Wang8 The use of daily IGRT allows for a reduction in the size of the PTV margin, but there is a limitation of time and resources. Some studies suggested that non-daily image-guided protocols were used for correcting patient position, but the relationship between the frequency of images and size of PTV margin remains unclear.Reference Gupta, Gamre, Kannan, Rokde, Krishnatry and Murthy9
Therefore, this study aimed to optimise imaging frequency and evaluation residual error of five non-daily imaging (DL) protocols based on the treatment delivery capacity of VMAT for pelvic cancer.
Materials and Methods
Patient characteristics
This study, 21 patients with pelvic cancer radiotherapy were randomly selected for sites such as the prostate, the cervical and the rectal. A total of 542 daily volumetric imaging data were collected from 21 patients with pelvic cancer treated with VMAT at our institution from June to October 2019. The number of fractions per patient ranged from 25 to 33. All patients were placed on the wing board in a supine position with both arms up above the head and immobilised using ankle fixation. A full bladder protocol was used for all patients. All patients underwent radiation therapy by the setup from three radiation therapists from which one radiation therapist was specific in each treatment room and two radiation therapists were rotated monthly. This study was approved by the Institutional Review Board of the Faculty of Medicine, Chiang Mai University (study code RAD-2562-06431/Research ID: RAD-2562-06431).
Data collection
Daily image-guided acquisition: before treatment, the patient was set up using the treatment isocentre. The CBCT was performed with the Elekta Synergy XVI system (Stockholm, Sweden) for position verification. The CBCT images were compared with reference CT planning images, the transition between CBCT and reference CT planning images identifies the setup error of the patients. The setup errors of patients were recorded in the lateral (X), longitudinal (Y), and vertical (Z) directions.
Treatment delivery capacity: the time spent on patient setup, CBCT image acquisition, image approval and treatment delivery were recorded. The procedure consisted of eight steps from patient’s entry to exiting the treatment room, Step 1 patient preparation; Step 2 patient setup; Step 3 CBCT image acquisition; Step 4 CBCT image registration; Step 5 waiting time for approval; Step 6 evaluating image registration; Step 7 beam on time and Step 8 complete the irradiation process and patients exit the treatment room.
Imaging protocols
The setup error was calculated by the transition of daily CBCT and reference CT planning images in the lateral (X), longitudinal (Y), and vertical (Z) directions were used to simulate five non-DL protocols as follows,
(1) DL protocol: CBCT images were acquired every fraction and setup errors were corrected before each treatment fraction. The residual error is assumed to be zero.
(2) Alternate day (AD) protocol: simulated from 13 CBCT images on fractions 1, 3, 5, 7, 9, 11, 13, 15, 17, 19, 21, 23 and 25. The residual errors of the remaining fractions (2,4,6,8,10,12,14,16,18,20,22 and 24) were calculated by subtracting the average setup error of the 13 CBCT images from the actual setup error detected for remaining fractions.
(3) First 5 + Weekly (FF+WL) protocol: simulated from 9 CBCT images on fractions 1, 2, 3, 4, 5, 6, 11, 16 and 21. The residual errors of the remaining fractions (7–10,12–15,17–20 and 22–25) were calculated by subtracting the average setup error of the 9 CBCT images from the actual setup error detected for the remaining fractions.
(4) Weekly (WL) protocol: simulated from 5 CBCT images on fractions 1, 6, 11, 16 and 21. The residual errors of the remaining fractions (2–5,7–10,12–15,17–20 and 22–25) were calculated by subtracting the average setup error of the 5 CBCT images from the actual setup error detected for the remaining fractions.
(5) First 5 fractions (FF) protocol: simulated from 5 CBCT images on fractions 1–5. The residual errors of the remaining fractions (6–25) were calculated by subtracting the average setup error of the 5 CBCT images from the actual setup error detected for the remaining fractions.
(6) Alternate week (AW) protocol: simulated from 3 CBCT images on fractions 1, 11 and 21. The residual errors of the remaining fractions (2–10,12–20 and 22–25) were calculated by subtracting the average setup error of the 3 CBCT images from the actual setup error detected for the remaining fractions.
Calculation of residual error and PTV margin of imaging protocols
The percentage of fraction incurring residual error was calculated for a threshold of ≤ 0·5 cm and > 0·5 cm in lateral (X), longitudinal (Y), and vertical (Z) directions.
The 3D vector shift of residual error was calculated using the formula (
 $\sqrt {{X^2} + {Y^2} + {Z^2}} $
) when X, Y and Z are lateral, longitudinal and vertical setup error.
Reference Bichay, Davis, Mayville and Bichay10
Also, the average 3D vector shift of residual error was compared between the daily and non-DL protocols.
The systematic and random errors were calculated according to the report by The Royal College of Radiologists. 11 The individual mean setup error (mindividual) was the mean setup error for an individual patient. The overall population mean setup error (Mpop) was defined as the overall mean for the analysed patient group. The population systematic error (∑) was defined as the standard deviation (SD) of the individual mean setup error about the overall mean (Mpop). The individual random error (σ individual) was defined as the SD of the setup error around the corresponding mean individual value (mindividual). The population random error (σ) was defined as the mean of all individual random errors (σindividual).
PTV margins were calculated using van Herk’s formula (2·5∑ + 0·7σ) Reference Nigam, Kuma and Balan12 according to population systematic and random error. The formula to ensure 95% minimum prescribed dose to the CTV for 90% of the patients.
The capacity of the treatment delivery for different imaging protocols
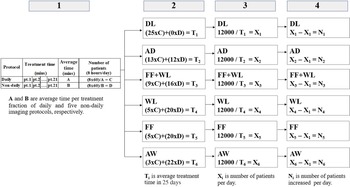
The average time of patient setup, imaging and treatment for daily and non-DL protocols of all patients per day (8 hours/day) was calculated to assess the capacity of the treatment delivery. Regarding the number of patients calculation, as shown in Figure 1, a four-calculation process was used with (1) the average time per treatment fraction for daily and non-DL protocols; (2) the average treatment time of individual patients in 25 days (8 hours/day) for each imaging protocols; (3) the total number of patients per day in 25 days (8 hours/day) when 12000 minutes are the total treatment time in 25 days (8 hours/day) and (4) the total number of patients increases per day for five non-DL protocol when compared with DL protocols.
Summary calculation diagram for the total number of patients per day of each protocol.

Results
The magnitude of residual error
For five non-DL protocols, the amount of residual error for the threshold of ≤ 0·5 cm and > 0·5 cm,in the lateral (X), longitudinal (Y), and vertical (Z) directions are shown in Table 1. The AD protocol produced the greatest proportion of residual error ≤ 0·5 cm, while the FF protocol produced the greatest proportion of residual error > 0·5 cm. Moreover, the 3D vector shift for the FF+WL and AD protocol produced the greatest proportion of residual error ≤ 0·5 cm, while the FF protocol produced the greatest proportion of residual error > 0·5 cm.
Residual error for threshold of ≤ 0·5 cm and > 0·5 in the lateral (X), longitudinal (Y), and vertical (Z) directions and 3D vector shift

Residual error of non-daily imaging protocols
A comparison of the average 3D vector shift of residual error for daily and five non-DL protocol are shown in Table 2. This study, the residual error of DL protocol is assumed to be zero. The residual error of all five non-DL protocols shown, significant differences when compared with DL protocol. The FF+WL protocol showed the smallest of residual error. Whereas, FF and AW protocol showed the largest residual error.
3D vector shift of residual error for five non-daily imaging (DL) protocols

Systematic and random error
Table 3 shows the population systematic and random error, which is calculated using the residual error in the lateral (X), longitudinal (Y), and vertical (Z) directions for five non-DL protocols. The magnitudes of systematic error were largest for the FF protocol, while the AD protocol showed the smallest systematic error in all three directions. Also, the smallest random error was found in the FF+WL protocol in all three directions.
Systematic error, random error and PTV margin in the lateral (X), longitudinal (Y)and vertical (Z) directions for five non-DL protocols

Population-based PTV margin
The PTV margins were calculated according to van Herk’s formula. The PTV margin in the vertical (Z) direction was greater than the margin in the lateral (X) and longitudinal (Y) directions for all protocols. The margin was smallest for AD protocol in all three directions compared with other protocols shown in Table 3.
The capacity of the treatment delivery for different imaging protocols
The time average of each process from start to stop treatment for daily and non-DL protocol was used to calculate the number of patients treated per day as shown in Table 4. The number of patients per day, residual error and PTV margin are used to balance the treatment delivery capacity and treatment accuracy. The AW protocol shows the highest number of patients treated per day. However, the AW protocol showed a large residual error and PTV margin. Whereas, the WL protocol showed an equal number of patients as the FF protocol, but revealed a lower residual error and PTV margin.
Total number of patients per day for different imaging protocols

Discussion
This study aimed at determining the feasibility of non-daily image-guided RT with VMAT for pelvic cancer. Daily CBCT images data of 21 patients (542 fractions) were used to simulate 5 non-DL protocols.
The magnitude of residual error, the amount of residual error for the threshold of ≤ 0·5 cm and > 0·5 cm in 3D vector shift were 65% and 35% for FF protocol, 68% and 32% for AW protocol, 71% and 29% for WL protocol, 74% and 26% for FF+WL protocol and 74% and 26% for AD protocol, respectively, as shown in Table 1. The results demonstrate that the FF+WL and AD protocol produced the greatest proportion of residual error ≤ 0·5 cm, and this study suggests the FF+WL protocol is the superior choice for correcting geometric setup error in 3D vector shift.
The 3D vector shift of residual error for FF, AW, WL, FF+WL and AD protocol were 0·45 (± 0·12), 0·45 (±0·13), 0·41 (±0·11), 0·39 (±0·11) and 0·40 (±0·11) cm, respectively, as shown in Table 2. The FF+WL protocol showed the smallest of residual error, but the difference was not significant for WL and AD protocol (p > 0·05). The results showed that the residual error associated with various imaging protocols is seen to decrease with increased frequency of imaging. These results are similar to those of Bichay et al.Reference Bichay, Davis, Mayville and Bichay10 who quantify the setup accuracy for various IGRT frequency protocols from tattoo-only setups with no imaging to imaging every fifth, fourth, third, second fraction, as well as DL before tomotherapy IMRT treatment. The mean setup error in the prostate population decreases from 10·4 mm (no imaging) to 4·9 mm (weekly). Imaging every fourth day results in a further drop to 4·6 mm, then to 4·1 mm when imaging every third day and if imaging every second day, the mean error drops to 3·0 mm. The 3D vector shift report is compared to the results published in the referenced studies as summarised in Table 5.
Summary of 3D vector shift comparison with published data

The systematic and random error of all five non-DL protocols show that the random error calculated was larger than a systematic error in all directions. The AD protocol resulted in the smallest systematic error in all three directions, with no significant differences when compared with other protocols in all three directions. For random error, FF+WL protocol showed the smallest random error in all three directions compared with other protocols, significant differences were observed in the AW (p = 0.011) and WL (p = 0.026) protocol in the lateral (X) direction, in the AW (p = 0.030) and AD (p = 0.022) protocol in the longitudinal (Y) direction and the AD (p < 0.001) protocol in the vertical (Z) direction. For non-DL protocols, this study demonstrated that the systematic error was reduced when the increased frequency of imaging, because associated with treatment preparation error that will cause a deviation that occurs in the same direction and similar magnitude for each fraction throughout treatment course while the random error was reduced when the CBCT image was corrected on early treatment fractions (i.e., fractions 1–5), because the use of FF+WL and FF protocol for correcting patient position on early treatment fractions, showed the smallest random error.
Although this study showed that only the AD protocol can get the PTV margin less than 0·5 cm in all three directions. However, to ensure accurate positioning of treatment delivery, this study suggested non-daily image-guided protocols for pelvic irradiation should be applied for margins more than 0·5 cm consistent with a study from Stromberg et al.Reference Stromberger, Gruen, Wlodarczyk, Budach, Koehler and Marnitz13 who analysed setup deviations using daily megavoltage computed tomography (MVCT) and to evaluate 3 MVCT frequency reducing protocols (first 5 fractions: FFF, first 10 fractions: FTF and AW: 505) for gynaecologic cancer patients. A total of 505 protocols resulted in smaller margins than the FFF and FTF protocol, and all 3 imaging protocols showed the PTV margins of more than 0·5 cm. Soaida et al.Reference Soaida, Mulla, Sayed, Soliman and Hebshi14 compared the daily cone beam CT (DCBCT) with weekly CBCT (WCBCT) as a verification method for delivery of the treatment by IMRT for patients with prostate cancer. Daily CBCT did not show superior accuracy as compared to weekly CBCT, in patients with prostate cancer treated with IMRT. As per the direction, the use of a 6–10 mm margin in the PTV was found to be adequate to cover shifts in all directions in both Daily and Weekly analysis. The PTV margin report is compared to the results published in the referenced studies as summarised in Table 6.
PTV margin comparison with published data

Regarding the non-DL protocol, the patient setup should use a surface guide to reduce the residual error. Daily IGRT is standardly used for verification of setup error and correct patient positioning, however, the treatment workload should be considered for the centre which has a large number of patients. The balance of treatment delivery capacity and treatment accuracy should be a concern for each institution. The AW protocol showed the maximum capacity of the treatment delivery, showed the highest number of patients treated per day. However, the AW protocol also affects the treatment accuracy, showed the large residual error and PTV margin.
This study suggested applying margins of more than 0·5 cm of non-daily image-guided protocols for pelvic irradiation and the FF+WL protocol is the superior choice for setup verification. Nevertheless, more frequency of non-DL protocols should be further studied to quantify the most appropriate image-guidance frequency in pelvic cancer treated with IMRT.
Regarding the study uncertainty, the difference of bladder and rectum filling during the course of treatment may affect the decision of radiation oncologist for the step of patient position approval. Further study should give more attention to manage the bladder and rectum preparation. Additionally, the patient setup error was depending on the radiation therapist’s efficacy. In our centre, at least one radiation therapist was specific in each treatment room and two radiation therapists were rotated monthly for maintaining patient setup efficacy.
Conclusion
The use of IGRT is effective in evaluating the setup accuracy in pelvic cancer patients. Reducing the frequency of image-guided RT results in a high residual error. The size of the PTV margin based on the frequency of imaging, reduction in the size of the PTV margin was required to increase the frequency of imaging to achieve adequate coverage of the residual error. Non-daily image-guided RT strategies for pelvic irradiation should be applied for margins more than 0·5 cm. The number of patients treated per day, residual error and PTV margin are information to determine non-daily protocol applications that balance treatment delivery efficacy and treatment accuracy.
Acknowledgements
The authors thank the staff of the Division of Therapeutic Radiology and Oncology, Faculty of Medicine, Chiang Mai University for supporting this study.
Conflict of Interest
No conflicts of interest.