


I. Crisis and social policy retrenchment in a multilevel system
This article asks to what extent, in the context of economic crisis, the fiscal consolidation paths pursued by governments of the right and the left are similar and inevitably lead to retrenchment for the most important social policies – or, on the contrary, whether governments have the capacity to avoid certain reforms and cuts according to their preferences. The analysis also examines the extent to which this capacity can be greater in countries with multilevel structures. These questions regarding the determinants of the scope of social policy reforms during times of crisis are relevant for several reasons. We seek to verify at the regional level the common view of many citizens and academics that, especially in the aftermath of the second phase of the economic crisis that began in 2007 and regardless of their political leaning, governments have cut social policies that were once safe from retrenchment, instead prioritizing the financial markets as part of a general movement in which economy trumps politics (Streeck and Schäfer, Reference Streeck and Schäfer2013).
Moreover, fields of study that have traditionally been interested in the economic and political determinants of Welfare State reforms are not conclusive in their findings. For example, the literature on fiscal consolidation indicates that when the economic situation is dire and (international) mainstream pressure supports adjustments, the ability of governments to choose their policies is severely constrained (Wagschal and Wenzelburger, Reference Wagschal and Wenzelburger2012; Dellepiane and Hardiman, Reference Dellepiane and Hardiman2012; Blyth, Reference Blyth2013; Heald and Hood, Reference Heald and Hood2014:14). This type of fiscal squeeze goes beyond government partisanship. The room for manoeuvre of such governments is limited to the use of blame avoidance strategies that seek to conceal cuts or convince citizens that retrenchment is necessary in an attempt to mitigate electoral retribution (Wenzelburger, Reference Wenzelburger2011; Bonoli, Reference Bonoli, Bonoli and Natali2012).
However, the literature on the politics of Welfare State reform holds that, even during times of crisis, government partisanship still seems to play a role in explanations of the resilience of social policies, although it should be noted that the most recent of these contributions were published prior to the crisis or refer only to its first phase and do not concentrate on the countries that have suffered the most severe consequences (Pierson, Reference Pierson2001; Vis et al., Reference Vis, Van Kersbergen and Hyndals2011; Jensen, Reference Jensen2014; Starke et al., Reference Starke, Kaasch and van Hooren2014; Heald and Hood, Reference Heald and Hood2014; Kickert et al., Reference Kickert, Randma-Liiv and Savi2015). The second phase of the economic crisis forced major adjustments in public finances. Because social policies represent up to 65 per cent of total public spending in European countries, they have been significantly affected by fiscal adjustments (OECD, 2012; Posner and Sommerfeld, Reference Posner and Sommerfeld2013). In Southern Europe, social cuts have been applied even more stringently due to the more drastic deterioration of public accounts and intense pressure from European institutions to reduce public deficits (Dellepiane and Hardiman, Reference Dellepiane and Hardiman2012; Guillén and Pavolini, Reference Guillén and Pavolini2015; Heins and de la Porte, Reference Heins and de la Porte2015).
Finally, also in this literature on the politics of welfare change, it has been suggested that a multilevel context could affect the ability of governments to manage social policy reform. As Vampa (Reference Vampa2017) and Greer (Reference Greer2010) have argued in this journal, in advanced democracies, the role of subnational governments in the elaboration or the implementation of most social policies is increasing. Subnational governments can make strategic use of the territorial system (Pierson, Reference Pierson1995; Greer, Reference Greer2010; Braun and Trein, Reference Braun and Trein2014): they can utilise the veto points available to avoid retrenchment decisions that other levels of government might wish to impose, and they can shift the blame for unpopular cuts to other governmental levels when they do opt for retrenchment. However, we do not have much evidence on whether subnational governments have been able to make use of this leeway in the recent severe crisis, among other reasons because most analyses of welfare state retrenchment have dealt with the Nation-State in an international multilevel context (for instance, Armingeon and Baccaro, Reference Armingeon, Baccaro, Bermeo and Pontusson2012).
This article seeks to contribute to the literature on the determinants of fiscal consolidation policies and Welfare State reforms in the wake of the recent crisis, as well as to the question of how multilevel systems have responded to the crisis. To this end, we consider the case of Spain, one of the European countries most dramatically affected by the crisis. Notably, the Spanish Welfare State endured drastic retrenchment for the first time following the restoration of democracy in the 1970s (Pavolini and Guillén, Reference Pavolini and Guillén2013). The Spanish National Health System (NHS) has gradually been universalised since 1986 to assist all Spanish citizens and registered foreigners. Responsibility for the regulation of the system is shared by the Central Government (CG) and the regional authorities (Comunidades Autónomas, ACs). The latter provide the services through a variety of organisational arrangements according to their priorities, resources and citizens’ preferences (Moreno-Fuentes, Reference Moreno-Fuentes and Moreno2009). The intergovernmental distribution of roles and resources creates a situation of strong interdependence between the CG and the ACs that affects the way in which decisions are made and implemented. To date, there has been no systematic analysis of the differences across regions in terms of healthcare reform measures related to the crisis and their drivers (as partial exceptions, see Bacigalupe et al., Reference Bacigalupe, Martín, Font, González-Rábago and Bergantiños2016; Gallego, Reference Gallego2016).
With regard to research design, we conducted a comparative analysis of the reforms implemented in five ACs between 2007 and 2014. The selected ACs, representing more than half of the population of Spain, have been affected by the crisis to differing degrees and are ruled by different parties. We have chosen cases featuring similar levels of political and financial autonomy. By selecting regions within the same country, we can better control for the effects of the institutional context. In all of the regions selected, citizens strongly oppose any cuts to healthcare (97 per cent of Spaniards were against cuts in healthcare; Calzada and Del Pino, Reference Calzada, Del Pino and Torres2015). With the aim of assessing the scope of reforms, our dependent variable, we have developed a composite index made up of several indicators, both qualitative and quantitative. In terms of explanatory factors, in addition to the ideology of each of the governments, the severity of the crisis in each AC has been measured using several economic and financial indicators. Finally, we have conducted fifteen interviews with policy-makers, the content of which will be presented below, in order to facilitate a better understanding of the mechanisms of the relationships between the analysed variables.
We predict that the scope of the reforms in each region will be shown to be conditioned by the severity of the crisis. However, we also expect to demonstrate through the analysis of the individual reform processes that politics plays a role even in hard times and that at least part of this capacity for the expression of ideological preferences is provided by the strategic opportunities offered by the multilevel government system.
The article is organised as follows. In the second section, we review previous research on the main determinants of social policy reform and on how variables interact in a context of severe crisis. We also explain our main hypotheses. In the third section, we discuss how we measure the scope of social policy reform and its determinants and clarify our methodology. In the fourth section, we analyse the socio-economic contexts in the selected regions and investigate the scope of healthcare reforms. In the fifth section, we discuss the determinants of these reforms. Finally, we present conclusions and its implications for further research.
II. The determinants of Welfare State reform: literature review and hypotheses
The interactions between several political and economic variables determine the content and direction of social policy reforms. Given that both the preferences of citizens and other social actors and general political and financial characteristics are largely similar in our five case studies, we focus on the roles played by partisan governments and the institutional context – in particular, the decentralised system. That being said, there is no definitive agreement as to how these variables interact in a context of severe crisis or how they may influence the direction of reforms (Molnar, Reference Molnar2012; Bonoli, Reference Bonoli, Bonoli and Natali2012; Starke et al., Reference Starke, Kaasch and van Hooren2014; Heald and Hood, Reference Heald and Hood2014; Kickert et al., Reference Kickert, Randma-Liiv and Savi2015).
The literature is unambiguous in recognising the importance of left-wing parties and trade unions in the phase of Welfare State expansion (Pierson, Reference Pierson2001; Iversen and Stephens, Reference Iversen and Stephens2008). Nevertheless, there is also general agreement that partisan politics has become less relevant to social policy since the 1970s and especially throughout the 1990s, with the left being constrained by permanent austerity and the right by the support among its constituencies for the Welfare State. As Pierson (Reference Pierson2001) shows, the functioning of welfare programmes has generated substantial clienteles. Together with citizens who benefit directly from these welfare programmes, public workers (e.g. doctors and teachers) oppose the dismantling of such programmes and may even use their influence to mobilise citizens (Swank, Reference Swank, Castles, Leibfried, Lewis, Obinger and Pierson2010; Kwon and Pontusson, Reference Kwon and Pontusson2010; Klitgaard et al., Reference Klitgaard, Schumacher and Soentken2015; Jordan, Reference Jordan2011 for healthcare). However, these findings have been questioned (Green-Pedersen, Reference Green-Pedersen2001; Korpi and Palme, Reference Korpi and Palme2003). For example, although certain left-wing governments have implemented welfare cuts, others have tried to enact expansive new initiatives (Klitgaard and Elmelund-Præstekær, Reference Klitgaard and Elmelund-Præstekær2014); moreover, a number of right-wing governments have been able to implement social cuts with no electoral retribution by using diverse strategies to conceal such cuts from the public (Bonoli, Reference Bonoli, Bonoli and Natali2012).
Since the onset of the crisis, contributions on the scope of reforms and the effects of government partisanship and political factors in general have been scarce and not entirely conclusive. Some scholars have argued that, in hard times, the ability to choose reforms is severely limited (Wagschal and Wenzelburger, Reference Wagschal and Wenzelburger2012). Despite these apparent constraints, during the first phase of the crisis, a few far-reaching reforms were undertaken (Van Kersbergen et al., Reference Van Kersbergen, Vis and Hemerijck2014) by governments with various ideological orientations (Vis et al., Reference Vis, Van Kersbergen and Hyndals2011). Jensen (Reference Jensen2014) concludes that because the crisis has had a negative impact on the majority of the population – right-wing voters included – right-wing parties have been induced to refrain from making cuts in public spending. Kickert et al. (Reference Kickert, Randma-Liiv and Savi2015) similarly find that right-wing parties did not adopt severe retrenchment initiatives during the first phase of the crisis. Notably, Starke et al. (Reference Starke, Kaasch and van Hooren2014) observe that the ideology of governments makes a difference to their policy decisions, especially in countries with less generous welfare states.
The available research on the second phase of the crisis, in particular analyses of Southern European countries, clearly shows that governmental leeway has been reduced (Guillén and Pavolini, Reference Guillén and Pavolini2015; Heins and de la Porte, Reference Heins and de la Porte2015). According to neofunctionalist approaches, endogenous and exogenous functional pressures (such as the crisis itself) limit the ability of actors to make decisions about social policies because, depending on the context, certain ideas such as expansion or austerity tend to prevail over others (Van Kersbergen and Vis, Reference Van Kersbergen and Vis2014). In this second phase of the crisis, the paradigm of austerity seemed to have imposed itself. However, there have not been enough systematic studies on the scope of this retrenchment or on the impact of political factors, especially in relation to governmental ideology.
Most of the mentioned contributions about the relation between political factors and the direction of reforms in social policies during the crisis have been made at the level of the Nation-State. However, in many countries like Spain, subnational governments have become the most important arenas of welfare policies. Braun and Trein (Reference Braun and Trein2014) suggest that, in a crisis context, subnational governments can behave in an opportunistic fashion regarding fiscal policies. Pierson (Reference Pierson1995) argued that a subnational government that wants to implement social cuts can blame the Central Government for imposing them; however, it can also profit from the opportunities offered by a decentralised system to block undesirable reforms designed by the Central Government when they do not match its policy preferences, which may occur when these governments are in the hands of different parties (Jordan, Reference Jordan2009). In this type of institutional context, we may find that left-wing or even sub-state nationalist parties, which consider social policies to be a key element in nation-building processes, will use the veto powers provided by the multilevel system to avoid cuts. In contrast, right-wing subnational governments may shift the blame for retrenchment onto the Central Government in order to pursue their cutback policies without paying an electoral price (Greer, Reference Greer2010).
Finally, this article examines the case of five regional governments in Spain during the second phase of the economic crisis that seriously affected the country's economy. In light of our specific questions, we propose several hypotheses. First, we expect that in times of severe crisis, the likelihood of governments avoiding retrenchment will be far lower; moreover, the more severe the crisis, the more severe the scope of retrenchment. However, we also anticipate, as a second hypothesis, that the ideology of governments will predict some variations in the content and scope of healthcare reforms even during the crisis, with left-wing parties and (to a certain extent) sub-state nationalist parties more reluctant to engage in retrenchment. Complementarily, other political factors, such as popular opposition and resistance on the part of health professionals in the NHS, can limit the scope of retrenchment. Thirdly, we predict that part of this leeway will be due to decentralisation, which can be instrumentalised by subnational governments in two ways, first by shifting blame for implemented unpopular cuts to the national government, and second by utilising the opportunity offered by the multilevel structures to escape pressure from the central government to impose austerity and to avoid cuts, for example by resorting to the constitutional court or other veto possibilities. This strategic use of the territorial system is expected to occur when the central and regional governments have different ideologies.
III. Measuring the scope and content of social policy reforms and assessing their determinants
In order to analyse the differences between the healthcare reforms recently implemented in certain Spanish regions, we have developed a composite index of health retrenchment consisting of seven qualitative and quantitative indicators. We seek to assess the scope of reforms in a way that will help us to overcome the limitations that the literature attributes to the use of social spending as the sole indicator of welfare reforms. Social spending data are relatively easy to find; moreover, they capture the extent of the major programmes and are essentially comparable. However, in recent years, researchers have criticised this indicator because a number of reforms are not reflected in social spending, instead involving the reduction of citizens’ rights. Our index reflects the extent to which regional governments implemented retrenchment measures of their own design or those designed by the CG. Because we are interested in observing the political determinants of reforms, including ideology and the role of public opinion, we focus especially on initiatives that are more visible to the public and/or reduce the system's capacity to provide services to citizens (Green-Pedersen, Reference Green-Pedersen, Clasen and Siegel2007). As we describe below in more detail, in addition to the evolution of public healthcare spending per capita, we include six indicators that measure healthcare coverage and the conditions for accessing the system, as well as its capacity and evaluation in public opinion.
With regard to the determinants of reforms, we measure the severity of the crisis in each AC via several indicators (GDP trends, unemployment rate and public deficit). The regions were selected according to the ideology of the ruling party. We analyse the determinants of reforms through a process-tracing study of decision processes and the contents of the policy documents that justified the reforms, as well as political speeches by policy-makers. In addition, fifteen in-depth interviews, three in each region, were conducted with the Directors General of healthcare and of public finance in regional administrations as well as with high representatives of the main union in each AC. DGs were selected as they bridge the political and technical level in the decision making process. Although the bulk of regional retrenchment legislation was enacted in 2012 and subsequent years, the period considered extends from 2007 to 2014 in order to allow a more comprehensively contextualized understanding of the situation. The interviews, which were conducted over a three-year period, involved questions about the determinants of retrenchment decisions, the political and technical processes involved and the obstacles encountered in the implementation phase. Unlike quantitative contributions, especially in the area of fiscal consolidation studies (Dellepiane and Hardiman, Reference Dellepiane and Hardiman2012), this approach facilitates a more complete view of the mechanisms that link the decisions of policy-makers with the economic and political context. Finally, the interviews were analysed using ATLAS. ti, first separately by each author and then following agreement on divergent interpretations.
IV. Healthcare adjustments in Spain (2009-2014)
The economic and political context
Within a few years, the Spanish economy went from a public surplus of around 2 per cent in 2007 to a deficit of 10.6 per cent in 2012, peaking at 11.4 per cent in 2009. In that year, the EU approved an excessive deficit procedure against Spain, triggering the adoption of severe fiscal consolidation policies. The CG, in the hands of the social-democratic PSOE until November 2011 and the conservative PP thereafter, pursued a series of retrenchment measures to correct the imbalances in public finances that affected most public policies at all three levels of government.
Although the economic situation was clearly adverse in all ACs discussed here, considerable differences between them can be appreciated. With regard to economic activity (Figure 1), the situation was particularly serious in Asturias, whereas Madrid experienced a significantly lower level of economic contraction. The situations in Andalusia, Catalonia and Castile-La Mancha fell between these two extremes.
Evolution of annual change rate in GDP (2003-2013)

There were also significant differences in unemployment levels (Figure 2). The unemployment rate in Andalusia exceeded 35 per cent in 2013, more than 15 percentage points above the rate in Madrid. Castile-La Mancha had the second-highest rate, significantly higher than those in Asturias and Catalonia. We also observe different degrees of imbalance in public finances (Figure 3), with Castile-La Mancha in the worst position and Madrid in the best, with Catalonia, Asturias and Andalusia in intermediate circumstances.
Evolution of regional unemployment rate (2003-2013)

Evolution of regional public deficits in percent of GDP (2003-2014)

With respect to the political leaning of regional governments, we were especially interested in the governments that formed in 2011 or 2012, as it was at this point that the ACs began to enact their most important adjustments (see Figure 3). The Andalusian regional election of 2008 resulted in a PSOE (social-democratic) government with an absolute majority; this government remained in power after the 2012 election due to an agreement with the post-communist IU. In Catalonia, the 2010 election resulted in a CiU (centre-right nationalist) government facilitated by the Catalan branch of the PP (conservatives); after the 2012 election, the CiU remained in office thanks to an agreement with the ERC (left-wing secessionist party). Meanwhile, in the Madrid region, the PP maintained its absolute majority. The election held in May 2011 resulted in the loss of the PSOE majority in Castile-La Mancha, which would also come to be governed by the PP. In Asturias, the minority government of a right-wing regional party did not finish its term; a new snap election held in 2012 resulted in a PSOE government supported by the left-wing IU. In both Castile-La Mancha and Asturias, the bulk of retrenchment was carried out after 2011 by governments both from the right and the left, respectively.
In short, with regard to the economic situation prior to the adjustments, Madrid was in the best position, with Castile-La Mancha at the opposite extreme. In between, the situation in Catalonia was similar to those in Asturias and Andalusia, although the latter was experiencing higher levels of unemployment. From a political standpoint, Madrid and Castile-La Mancha were governed by the PP (conservatives), Asturias and Andalusia had social-democratic governments and Catalonia was ruled by the nationalist right in a minority government that required the occasional support of other parties.
Healthcare adjustments by regional governments
Because healthcare accounts for some 40 per cent of regional budgets, it came as no surprise that fiscal consolidation would eventually require some difficult decisions regarding healthcare policies. The federal structure of the Autonomic State significantly shaped the way in which healthcare retrenchment was implemented at the regional level. Some of the measures undertaken by the CG were mandatory for the ACs; in other cases, the framework content established by the CG was later elaborated by the regions, both at the policy level and in terms of everyday management. In this sense, although the CG's decisions constrained the leeway of regional governments, the ACs demonstrated some ability to adapt or resist (openly or covertly) to CG initiatives. In addition, ACs also designed certain initiatives of their own.
Regional public healthcare spending in Spain amounted to 56,746 million Euros in 2013 (7,641 million less than in 2009) (Bandrés and González, Reference Bandrés and González2015). The pace of retrenchment was greater in the biennium 2012–2013 (5,847 million) than in previous years. Below, we briefly present some of the main measures developed by both the CG and the ACs.
Measures by the Central Government directly related to healthcare
The Decree-Law 16/2012 on urgent measures to guarantee the sustainability of the NHS contained the key retrenchment measures established by the CG and provided the overall framework for the cuts later made by the ACs. The implementation of the measures provided in this regulation was not peaceful, and some regions appealed to the Constitutional Court.
The most important initiative was the suppression of the universality of healthcare in Spain. Under the new decree, illegal immigrants would only have access to healthcare in emergency situations or for assistance during pregnancy, childbirth and the postpartum period. The position of the ACs regarding this point was not homogeneous (Moreno-Fuentes, Reference Moreno-Fuentes2015).
The decree also sought to reduce drug spending by establishing the prescription of drugs by active ingredient, the customisation of doses and the regulation of the price system. However, the most important measure was the increase in pharmaceutical co-payments for workers to between 40 and 60 per cent of the drug's price, depending on income, with a monthly cap. A co-payment for pensioners (between 8 and 60 Euros per month, depending on income) was also introduced. Subsidies for more than 400 medicines were abolished.
Other initiatives by the Central Government with effects on regional healthcare policies
Without focusing specifically on healthcare, the CG pursued several measures that have inevitably affected regional healthcare policies. The Organic Law 2/2012 established a spending rule according to which expenditures ‘cannot increase above the rate of growth with reference to GDP’. Because credit markets were virtually closed to regions, the CG also implemented several financing instruments, in exchange for which the ACs had to accept certain conditions, such as the development of complementary retrenchment plans evaluated by the Ministry of Finance.
Regarding human resources, in 2010 the PSOE government implemented measures to cut wage spending, specifically restrictions on the supply of public employment and a five per cent reduction in the wages of public employees. In 2012, the PP government approved a wage freeze and the suppression of Christmas bonus payments for that year, as well as freezing the supply of public employment.
Measures designed by the Autonomous Communities
The ACs also tried to rationalise healthcare in their territories. Measures such as the centralised management of surgical waiting lists, ambulatory care surgical procedures, online attendance and electronic medical histories and prescriptions were implemented. In the field of human resources, the PEFs (financial rebalancing plans required by the CG and designed by the ACs to redirect their deficit levels) included general provisions concerning hiring, the tightening of controls in the workplace and restrictions on senior managers’ salaries that also affected healthcare workers.
Some of the initiatives undertaken by the ACs to achieve spending targets led to conflicts with the CG. This was the case with the auction of medications proposed by the government of Andalusia, as well as with a new tax (the ‘Euro per prescription’) established by Catalonia and Madrid and declared unconstitutional in May 2014.
Healthcare retrenchment
Table 1 presents a selection of quantitative and qualitative indicators with respect to various initiatives that entailed a decrease in the rights, benefits or services granted to citizens before the crisis. The last column presents an additive composite index that summarizes the severity of cuts in healthcare in the ACs under consideration.
Indicators of healthcare adjustments and the Composite Index (2009-14)
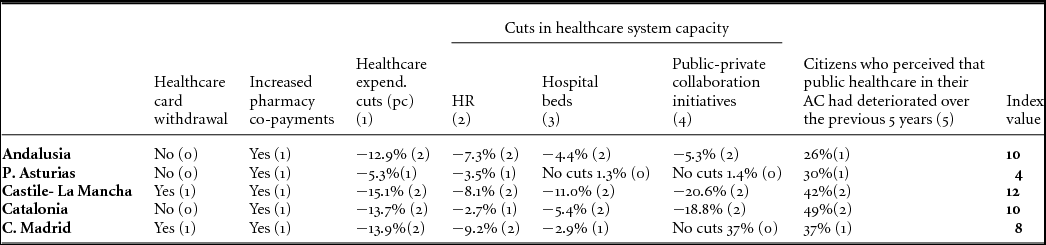
Source: Author's calculations. (1) Healthcare spending in 2013 minus spending in 2007 (percentage),Ministry of Finance (data available in 2016). (2) Boletín estadístico de personal al servicio de las Administraciones Públicas, Ministry of Finance.Andalusia, Asturias and Madrid: difference between 2009 and 2014; Catalonia and Castile-La Mancha: difference between 2012 and 2014 due to a change in methodology; Spanish average of worker reduction -4.2 (CCOO, 2015). (3) Hospital beds per 1000 inhabitants in operation in the NHS; difference between 2010 and 2012 (Ministry of Health) Spanish average -3.6 (CCOO, 2015). (4) Difference between spending in Public-Private Partnerships between 2009 and 2014; Spanish average -2.2., Ministry of Health Website (CCOO, 2015). (5) Data from Barómetro Sanitario (2014), CIS Estudio 8814, Question 30; includes primary care, specialty care, hospital care and emergency care; average of perceived deterioration 37%.
The first two columns on the left relate to retrenchment measures directly derived from CG measures. In these columns, each AC could receive 0 or 1 point (0 in the case of no implementation, 1 in the case of effective implementation of the initiative). Column one reflects the withdrawal of healthcare cards from certain groups of people who previously received free public healthcare (for instance, illegal immigrants). Three of the five ACs analysed decided not to apply this measure, whereas the other two (Madrid and Castile-La Mancha) did. Column two indicates whether new co-payments for medicines prescribed by doctors were adopted; this provision was implemented by all ACs.
In the following columns, each region is allocated 0, 1 or 2 points (0 if it did not cut resources, 1 if the cuts were below the average of all ACs, 2 if cuts were above the average). Column three presents an indicator frequently used to measure the extent of cuts: the variation in healthcare spending per capita. All ACs cut their healthcare spending per capita, although Asturias implemented this policy below the average of all regions.
Columns four to six display indicators that attempt to account for reductions in the capacity of the healthcare system. A reduction in the number of workers (column four) could make it difficult to maintain quality standards in the delivery of services. In this case, although the cut was below the regional average in Asturias and Catalonia, all regions cut the number of workers. Turning to the number of available beds in the NHS per 1000 inhabitants (column five), three ACs (Andalusia, Asturias and Madrid) made reductions below the Spanish average, but Catalonia and Castile-La Mancha were above average in this regard.
Column six shows the evolution of the budgets dedicated to partnership agreements between the NHS and private or third-sector organisations for the provision of certain services. This indicator contributes to a more accurate measurement of system capability; it is especially relevant in Catalonia, where the direct provision of healthcare is less important than in other regions. Asturias and especially Madrid increased the financial resources dedicated to public-private partnerships. Catalonia and Castile-La Mancha cut more resources than Andalusia, but all three of these regions made cuts above the average. Interestingly, Madrid combined reforms to retrench in zone areas of the public health system while also significantly increasing public-private partnerships.
As a proxy for the negative impact on citizens, an additional indicator takes into account public opinion on whether healthcare had worsened over the previous five years. About a third of Spaniards felt that their healthcare system had deteriorated. In Castile-La Mancha and Catalonia, this perception of decline was particularly intense, Madrilenian perceptions reflect the national average and in Asturias and Andalusia, the perception of deterioration was comparatively lower.
In sum, not all ACs pursued retrenchment with the same intensity. In Castile-La Mancha, the negative impact of adjustment measures on citizens was the greatest, and Asturias represents the opposite extreme. The remaining three regions are in intermediate positions, with Andalusia and Catalonia in slightly worse shape.
V. Determinants of healthcare retrenchment
We have shown above that the scope and content of healthcare policies differed in the five studied regions. But are these differences related to the degree of crisis severity faced by each region? Or did regional governments have some leeway to influence the path of reforms? Where did this room for manoeuvre come from? And, finally, are these paths consistent with the regional governments’ partisan colours?
The effects of the severity of the crisis on adjustments
The context of the crisis facilitated the implementation of reforms and encouraged their pace. In all the ACs, healthcare spending had progressively increased due to growth in needs and the electioneering use of the policy. Regional policy-makers cite as examples the increase in salaries of the healthcare workforce and the promise of new healthcare-centres disconnected from rational planning criteria (‘in every electoral campaign, new hospitals were promised’; ‘Now we program the location of healthcare-centres on the basis of accessibility and population parameters’). The crisis has precipitated certain decisions to rationalise expenditures that would have been necessary sooner or later due to the pressure of factors such as population ageing and the incorporation of new technologies.
In any case, the severity of the crisis only partially explains the extent of retrenchment. In Castile-La Mancha, policy-makers have tended to emphasise the dire financial situation, and indeed this AC is in the leading position with regard to the analysed reforms. However, despite the fact that Madrid was in the best economic situation when the crisis arrived, it has carried out reforms with harsher impacts on citizens than those enacted by more troubled regions such as Asturias. The reforms implemented by Andalusia are similar to those enacted by Catalonia, even though the crisis was more severe in the former region.
Leeway provided by the institutional context
The institutional features of the Autonomic State grant the CG an important role in the design of retrenchment in healthcare policy through mechanisms such as the obligation to submit financial rebalancing plans in the case of regional deficits and the conditioning of access to certain funding programmes; in principle, these reduce the leeway of the ACs. However, the CG has not applied sanctions to noncompliant ACs. In fact, some regions have repeatedly complained that noncompliant ACs are not penalised, going so far as to oppose easing the deficit targets for worse-off regions. In addition, because the regional level has genuine political and administrative power and is charged with implementing the healthcare initiatives designed by the CG, ACs can to a certain degree manage the process in terms that are relatively consistent with their priorities.
The Autonomic State has been used in an opportunistic way by the different regions. Three ACs have utilised strategies to circumvent the restrictions on access to healthcare for certain groups designed by the CG. Andalusia (left-wing) simply continued to include these groups without adopting any specific legislation in order to prevent a legal reaction on the part of the CG. This AC explained its decision by appealing to social justice, and its policy-makers claimed that the measure adopted by the CG was the first step in dismantling the universal healthcare system. Also in Catalonia (nationalist-right), all patients continued to receive medical care. This AC used the efficiency argument: policy-makers asserted that the lack of primary care treatment would oblige patients to resort to emergency care, which is more expensive. In Asturias (left), an alternative procedure to assist illegal immigrants was set out within the NHS. Finally, in Madrid and Castile-La Mancha (right), which were governed by the same party ruling the CG, the implementation of the measure was justified using two arguments: the obligation to comply with the law, and the need for efficient spending in times of crisis.
The territorial fragmentation of power thus contributed to the implementation of a reform that could be unpopular. The ACs recognised the necessary ‘push’ provided by the CG's legislation to facilitate retrenchment in pharmaceutical spending and wages in a context in which regional consolidation initiatives were insufficient. In this case, the ACs employed a strategy of shifting blame to the CG as the designer of the provisions. Regional policy-makers acknowledged that these measures helped them: ‘Without the CG legislation, it would have been very difficult in political terms for each AC to implement it’.
The room for manoeuvre in healthcare policies
The regional Ministers of Finance gained prominence in decisions to freeze or reduce expenditures to the detriment of sectoral ministers. Healthcare policy must comply with the so-called ‘expenditure ceiling’ (which cannot be exceeded). However, the healthcare sector could afford to be ‘rebellious’ because of the essential nature of its services. Moreover, there can be flexibility in terms of deciding where cuts should be implemented. In the five cases, public officials in the regional Ministries of Finance and Health were responsible for proposing a wide range of possible initiatives – albeit without much time for reflection, given the economic situation. Politicians then selected from among these initiatives.
In short, the institutional features of both the territorial system and the policy sector have allowed a degree of leeway for regional governments to implement healthcare reforms. Apart from the crisis, which does not seem to be decisive for the reforms implemented in each AC in order to achieve fiscal consolidation targets, what other factors have influenced these decisions?
The weight of public opinion and mobilisation by professionals
The popularity of public healthcare, the fact that it is an employment-intensive sector, the visibility of reforms and the capacity of professionals to mobilise citizens are all factors that could potentially hinder the implementation of cuts. In Madrid, where there has been an intense mobilisation of healthcare professionals and citizens, the electoral risk arising from the unpopularity of the reforms prevented some measures from going further. Similarly, in Castile-La Mancha, public officials acknowledged that citizens’ protests, promoted in part by the force of mobilisation initiatives in Madrid, helped to curb the privatisation of hospital management. In all regions, public pressure linked to the electoral cycle also worked to reduce austerity at the end of electoral terms.
However, social mobilisation has not prevented the implementation of retrenchment, even in areas with a significant impact on citizens, as clearly demonstrated by the cases of Castile-La Mancha and Madrid.
The ideology of retrenchment
In all the analysed ACs, policy-makers were worried about the quality of the healthcare system. However, there was no agreement on the best way to maintain quality standards in the midst of a severe crisis. In certain ACs, increased co-payments or public-private partnerships were preferred; at the same time, some ACs were more anxious than others (at least at the discursive level) about the potential effects of retrenchment on the equity and the public nature of the NHS.
Generally speaking, governmental actors recognised the weight of ideology in policy decisions. In Madrid (right), retrenchment decisions were made ‘out of responsibility’, but interviewees also noted that ‘the ideology that matters is that the government should not do things; they should be done by society, then the government has to do the bare minimum. Spending has to be cut’. In Asturias (left), we heard that ‘public healthcare is part of our DNA’. In Andalusia (left), it ‘is about ideology: we are not going to close healthcare centres, we are not going to privatize’. In the case of Catalonia (nationalist-right), the word ‘ideology’ was avoided; reforms were explained in terms of ‘viability, sustainability, efficiency’. In Castile-La Mancha (right), the ‘liberal orientation’ of the regional government was mentioned to justify retrenchment.
In Madrid, Catalonia and Castile-La Mancha, the opposition and the unions also referred to ideology as one of the main determinants of the scope and style of governmental reforms (pursuing cuts without bothering much either to negotiate or to explain them to the public). They also point to the crisis as an excuse to carry out retrenchment measures that would not have been acceptable to citizens in a context of prosperity. Where they do not govern, left-wing parties have clearly opposed retrenchment initiatives, even challenging them in the courts, which have proved a bulwark against privatisation in Madrid. To some extent, Catalonia is the exception. There, the sovereignty claims made by some left-wing parties have validated the Catalan government's strategy of blaming the CG for the retrenchment and the ‘financial asphyxiation’ to which this AC has allegedly been subjected.
From an ideological point of view, the left-wing government in Asturias implemented the softest reforms with regard to the impact on citizens. At the opposite extreme, a region governed by the right, Castile-La Mancha, carried out the harshest reforms. The remaining ACs are located in the middle of the scale: Madrid implemented reforms with a less intensive impact on citizens than Catalonia or Andalusia. Interestingly, when we look inside the ideological bloc, we see that in both the regions of the left (Asturias and Andalusia) and the right (Madrid and Castile-La Mancha) governments in the worst economic predicament pursued the strongest retrenchment measures. The Catalan case (nationalist-right) is slightly different. We expected that a nationalist party would use social policy as an element of nation-building. However, this AC, with a better economic situation than Andalusia (left) implemented similar levels of cutbacks.
VI. Conclusions
This article aims to contribute to the literature on the weight of political and economic determinants in fiscal consolidation policies and Welfare State reform. On the basis of healthcare reforms implemented between 2009 and 2014 in five Spanish regions, we analysed the extent to which a situation of crisis allowed governments certain room for manoeuvre to make decisions on the content of welfare reforms, as well as the factors that may explain the options they chose. The analysed regional governments share a common institutional framework (the Autonomic State) and a strong opposition on the part of citizens to healthcare retrenchment. They differ in terms of the ideology of their governments and the local severity of the economic crisis.
In accordance with the literature on the best way to measure the scope of welfare reforms, particularly in the healthcare sector, we designed a retrenchment composite index of qualitative and quantitative indicators. This index should be adaptable to other sectors of social policy. In addition, as a complement to the usual quantitative data in studies of fiscal consolidation, we also conducted case studies and interviews with various key actors involved in reform initiatives.
A first finding is that, as indicated by the literature on fiscal consolidation (Wagschal and Wenzelburger, Reference Wagschal and Wenzelburger2012), adverse economic and financial situations seriously constrain governments, to the extent that they are forced to implement cuts in policies such as healthcare, which are highly sensitive to citizens. Governments try to avoid unpopular reforms because they fear electoral retribution (Bonoli, Reference Bonoli, Bonoli and Natali2012) but, in all the analysed cases, retrenchment has been enacted by both left and right governments despite strong popular opposition. Public pressure seems to have affected the scope of the measures proposed and, at the end of the electoral cycle, policy-makers were less stringent in terms of budgetary targets. However, all regional governments employed strategies to shift the blame to the Central Government, to previous governments or, more generally, to the economic situation. Although it is not the subject of this analysis, it should be noted that these strategies to avoid electoral punishment worked better in some cases than in others, where the parties in office lost their parliamentary majority or subsequent elections.
A second finding is that, although the crisis has significantly reduced the government's leeway for choosing reforms, it has not eliminated it, such that a space for partisan government action still exists. Regional governments are subject to considerable financial constraints (which have translated into an increase in the power exerted by regional Ministers of Finance), but they have been able to ensure a certain influence over the design of their policies, consistent with what we would expect from the left-right axis. Right-wing regional governments in Madrid and Catalonia, despite their more comfortable economic situation compared to left-wing Asturias, implemented more severe cutbacks. In addition, Madrid combined its adjustment measures with a significant increase in the resources dedicated to public-private partnerships. Catalonia, in a better economic situation than (left-wing) Andalusia, undertook reforms with a similar degree of severity. Finally, the harshest reforms were implemented in Castile-La Mancha, which was suffering the worst economic situation and was ruled by a right-wing party.
The strategic utilisation of the institutional framework is an expression of the will of regional governments to pursue policies that correspond to their preferences. In this sense, the article also contributes to the classical controversy over whether decentralisation facilitates or obstructs welfare reforms. The case studies show that decentralisation can even make the implementation of unpopular reforms easier, as regional governments have a ready scapegoat to shoulder the blame. However, regional leaders can utilise the room for manoeuvre provided by the territorial system to block or at least prevent their strict application. This occurred mainly at times of party congruence at both levels.
Spain has not been the only country drastically affected by the crisis in the European context. Other Southern regions and countries have experienced the worst economic crisis in their recent history and have also made efforts to reduce their debts and consolidate their budgets. In so doing, they have carried out various initiatives affecting welfare policies, with an enormous impact on the daily lives of their citizens. Future research should examine other regions, countries, social policies or even indicators (such as the healthcare waiting list, not available in the Spanish case) that might provide new evidence on this topic.
Acknowledgments
The authors wish to acknowledge support from Project CRISAUT (Reform capacity and reform strategies in regional public sectors and welfare policies in the context of fiscal crisis: determinants and change trajectories), CSO 2012-33075, funded by the Spanish Ministry of Economy and Competitiveness. The authors thank the anonymous reviewers and the editors of this Journal for their helpful comments and José Manuel Díaz-Pulido for his assistance with some of the data.



