


Introduction
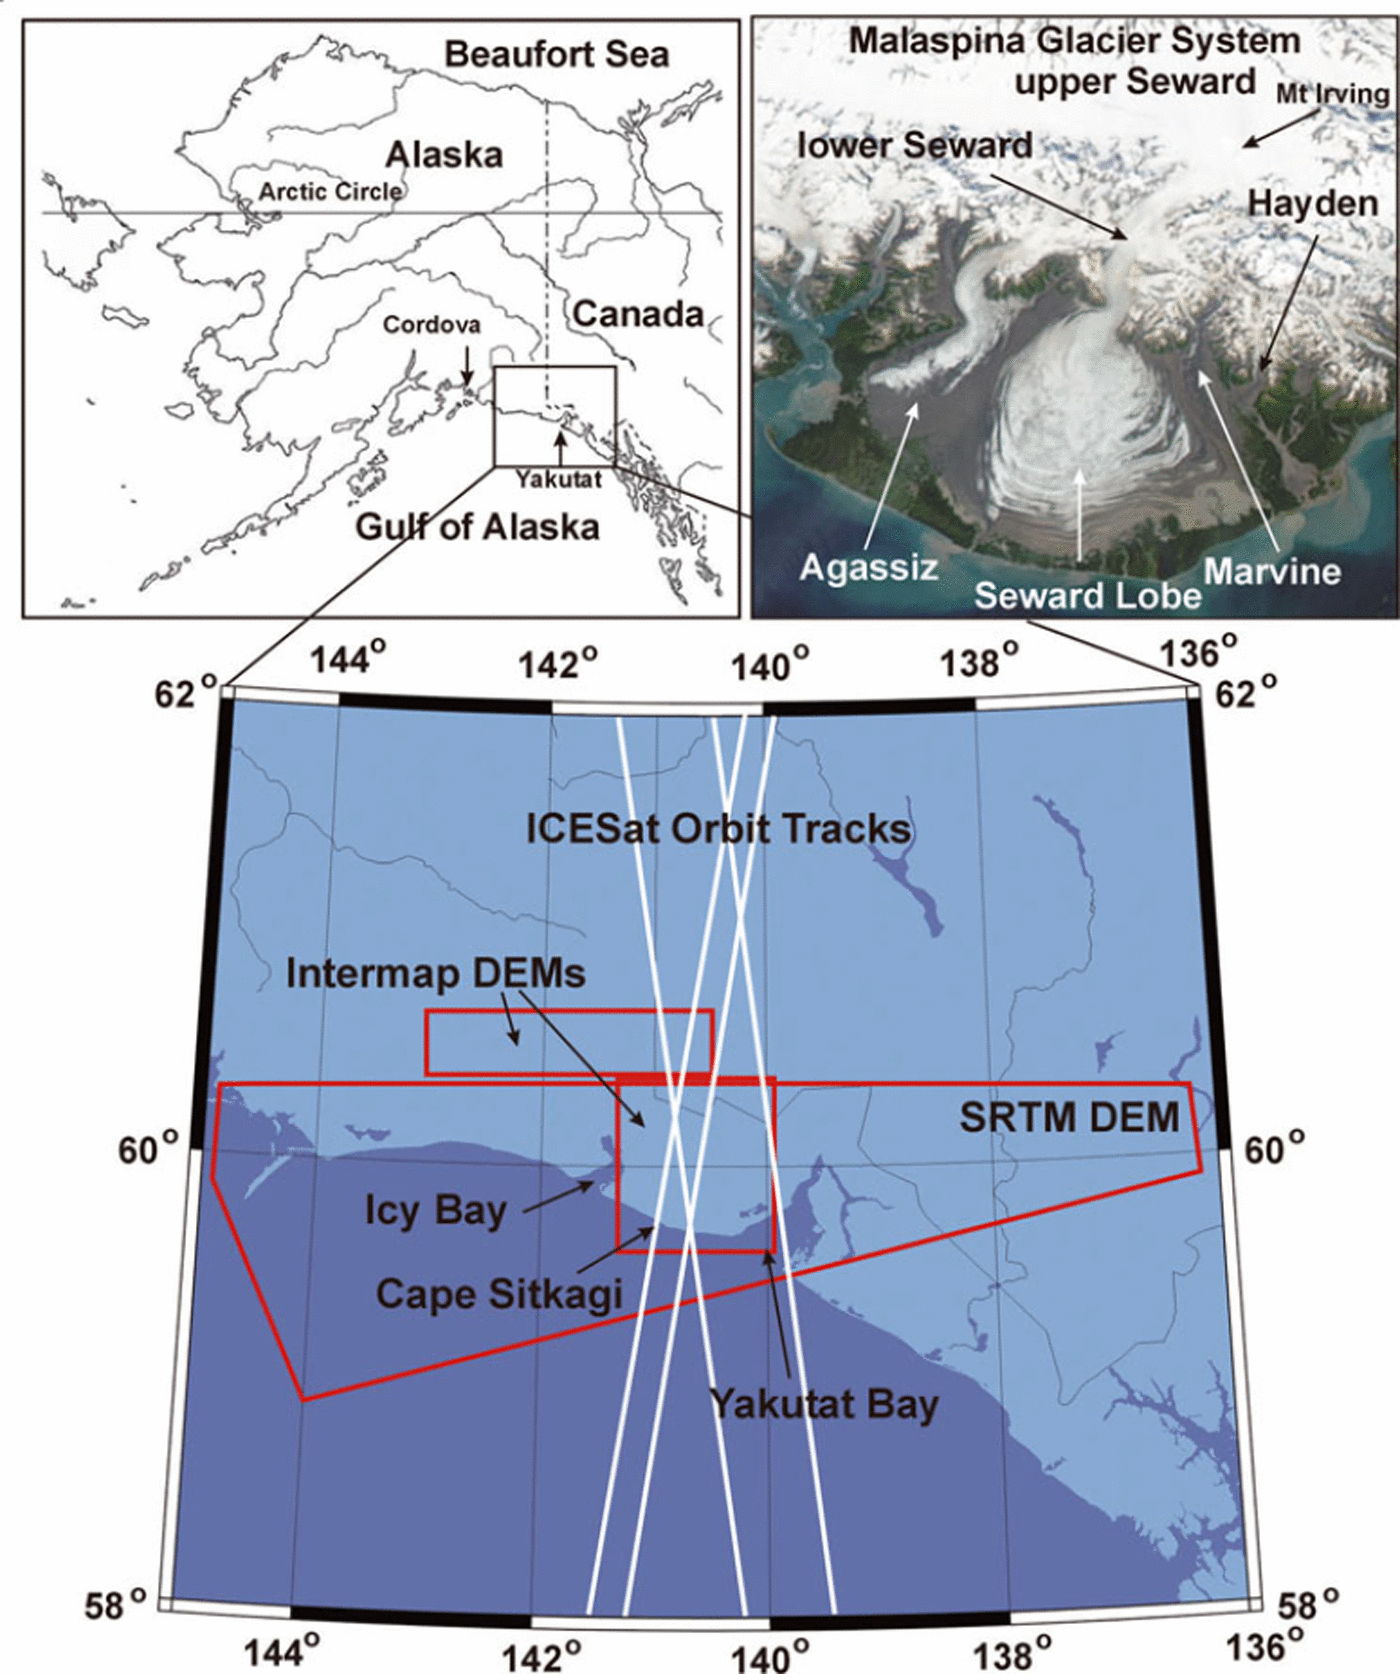
The piedmont of the Malaspina Glacier system, Alaska, USA, and Yukon, Canada (Fig. 1), with an area of 2400 km2 (Reference Post and LaChapellePost and LaChapelle, 2000), includes the ablation areas of Agassiz and Marvine Glaciers to the west and east, respectively, of the central Seward Lobe. The sinuous Lower Seward Glacier, mostly in Alaska, connects the large Upper Seward Glacier accumulation area in Yukon, to the Seward Lobe of Malaspina Glacier in Alaska. The Malaspina Glacier system, including all tributaries, has a total area of ∼5000 km2, making it the largest piedmont glacier on Earth (Reference MolniaMolnia, 2001).
The Malaspina Glacier system in Alaska, USA, and Canada. The upper left panel gives the general outline of Alaska and Canada, with the Cordova and Yakutat National Weather Service station locations. Lower panel illustrates the coverage of the Intermap and Shuttle Radar Topography Mission (SRTM) X-band DEMs and the Ice, Cloud and land Elevation Satellite (ICESat) orbit tracks. The top right panel shows the NASA Aqua MODIS (moderate-resolution imaging spectroradiometer) image of 11 August 2003. The glaciers comprising the Malaspina piedmont are Agassiz, Seward Lobe and Marvine. Lower Seward is the connecting glacier between upper Seward Glacier in Yukon and the Malaspina piedmont.
Below the southwest-directed mouth of Lower Seward Glacier, the Malaspina piedmont lies in a broad basin descending to at least 320 m below sea level (Reference Molnia and JonesMolnia and Jones, 1989). The glaciers of the tri-lobed piedmont surge at intervals, ranging from ∼5 to 30 years (Reference PostPost, 1969). Quiescent-phase flow velocities on parts of Seward Lobe can range from ∼0.5 to 1 m d−1 (Reference SharpSharp, 1958; Reference Krimmel and MeierKrimmel and Meier, 1975; Reference Lingle, Fatland, Voronina, Ahlnäs and TroshinaLingle and others, 1997). Surge-flow velocities can be in the order of 10–20 m d−1 (Reference Jones, Molnia and SchoonmakerJones and others, 1989). Extensive observations of daily, seasonal and yearly surface velocity and basal motion are lacking at this time. Speculative suggestions as to the origins of the large, impressive, folded medial moraines which characterize the surface of Malaspina Glacier have been advanced by, for example, Reference WashburnWashburn (1935) and Reference SharpSharp (1958). In 1964, using aerial photography dating from the 1930s, A.S. Post (unpublished information) proposed a hypothesis of the origin of these folded moraines.
In this paper we present evidence supporting the Post hypothesis. We present area-average surface-elevation changes from 1972 to 1999 and from 1999 to 2002 to derive the spatial pattern of change associated with the near-concurrent surges of three of the Malaspina piedmont glaciers. The occurrence of the near-concurrent surges supports a hypothesis of englacial water storage triggering surging when glacier thickness, i.e. geometry, has reached a pre-surge condition. In addition to surge dynamics, we present evidence of effects of climate change acting on the surface-elevation changes.
Airborne and space-borne digital elevation models (DEMs) and laser altimeter data are employed for detection of glacier elevation changes on multi-decadal and shorter timescales. Systematic errors and other uncertainties are assessed. We employ daily meteorological observations from the US National Oceanic and Atmospheric Administration (NOAA) National Weather Service stations at Cordova and Yakutat, Alaska, as measurements of precipitation and temperature in south-central Alaska. For estimation of seasonal snow accumulation used to adjust the DEMs and altimetry to a common September date for differencing, we employ the Reference TangbornTangborn (1999) precipitation–temperature–altitude-area glacier mass-balance model, and in situ surface snow densities as reported in the scientific literature.
Data
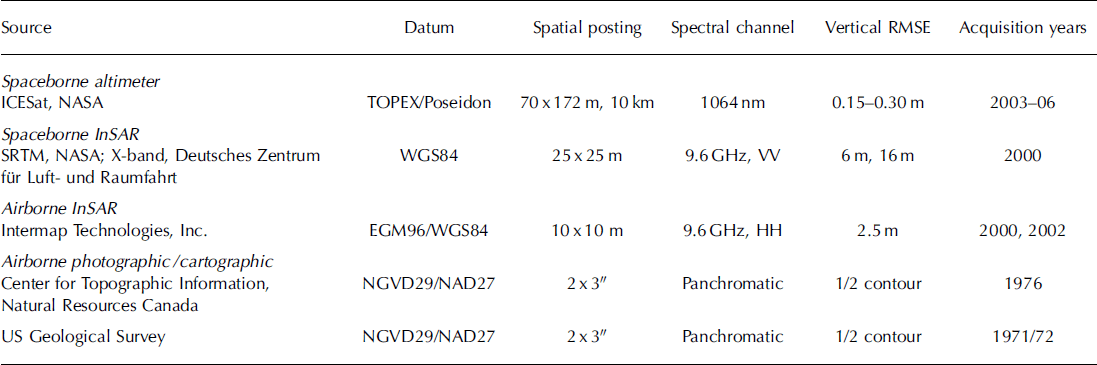
In the analysis of surface-elevation changes on the glaciers of the Malaspina Glacier system, we employ a variety of airborne and space-borne elevation datasets, summarized in Table 1. We briefly describe these below. Glacier areas were derived using radar backscatter images with slope models derived from the DEMs.
Elevation data sources
Digital elevation models (DEMs)
Intermap Technologies Inc., Denver, Colorado, USA, conducted two airborne surveys of the glaciers of south-central Alaska and south-western Yukon in support of this research. An airborne survey between 4 and 13 September 2000 covered ∼5000 km2 of Bagley Ice Valley, Upper Seward Glacier, and parts of East and West Jefferies, Quintino Sella and Yahtse glaciers (Table 1). An airborne survey between 2 and 4 August 2002 covered ∼5000 km2 of the Malaspina Glacier system, from Mount Irving nunatak in Upper Seward Glacier in Yukon, to the coast of south-central Alaska, and included Tyndall, Agassiz, Marvine and Hayden glaciers. Both on-board kinematic global positioning system (GPS) and corner reflectors with GPS receivers were used for precise location determination (Intermap Technologies Inc., 2006). These high-resolution (10m postings) models were derived by interferometric synthetic aperture radar (InSAR) processing of X-band data acquisitions. Their datum is the World Geodetic System 1984 (WGS84) ellipsoid with the Earth Geopotential Model 1996 (EGM96) projected in the Universal Transverse Mercator (UTM) system. Nominal rootmean-square error (RMSE) in the horizontal plane is ∼3 m; the vertical RMSE is ∼2.5 m. A second set of these models was provided with surface ellipsoid heights relative to WGS84 without the EGM96 geoid separation heights.
The Intermap Bagley DEMs were adjusted for estimated snow accumulation from 1 to 14 September 2000 using the Reference TangbornTangborn (1999) precipitation–temperature–area–altitude glacier mass-balance model with published in situ surface snow densities (Reference Muskett, Lingle, Tangborn and RabusMuskett and others, 2003; Reference MuskettMuskett, 2007; Reference Muskett, Lingle, Sauber, Rabus and Tang-bornMuskett and others, 2008). The accuracy along Bagley Ice Valley was validated by near-concurrent small-aircraft laser altimetry. The mean difference between the Intermap Bagley DEM and the altimeter-derived elevations was –1.3 ± 0.9 m (Intermap Bagley DEM elevations below the altimeter elevations) (Reference Muskett, Lingle, Tangborn and RabusMuskett and others, 2003; Reference MuskettMuskett, 2007). We interpret this difference as the X-band penetration depth.
The NASA Shuttle Radar Topography Mission (SRTM), which flew from 11 to 22 February 2000 and was jointly funded by the US National Geospatial-Intelligence Agency (NGA), had the first space-borne single-pass SAR interferometer (Reference Eineder, Breit, Adam, Holzner, Suchandt and RabusEineder and other, 2001; Reference RodriguezRodriguez and others, 2005; Reference Hoffmann and WalterHoffman and Walter, 2006; Reference SlaterSlater and others, 2006; Reference FarrFarr and others, 2007). Led by NASA’s Jet Propulsion Laboratory (C-band SAR) and the Deutsches Zentrum für Luft- und Raumfahrt (X-band SAR), SRTM was an international effort that included the Italian Space Agency (Reference Roth, Eineder, Rabus, Mikusch and SchattlerRoth and others, 2001; Reference Rabus, Einder, Roch and BamjerRabus and others, 2003). We employed the X-band, SRTM DEM (Table 1) which covers 51 000 km2 of southern Alaska and Yukon (Reference Geudtner, Zink, Gierull and ShafferGeudtner and others, 2002; Reference Helm, Braun, Eickschen and SchöneHelm and others, 2002; Reference Hoffmann and WalterHoffmann and Walter, 2006; Reference Kiel, Alsdorf and LeFavourKiel and others, 2006). The SRTM DEM was derived from seven orbit swaths and has a nominal pixel size of 25 × 25 m relative to the WGS84 ellipsoid, in the UTM projection system. The nominal RMSE vertical accuracy is 6 m relative, 16 m absolute, and the nominal RMSE horizontal accuracy is 15 m relative, 20 m absolute, at the 90% confidence level.
The SRTM DEM elevations were adjusted using the Reference TangbornTangborn (1999) glacier mass-balance model with published in situ surface snow densities (Reference Muskett, Lingle, Tangborn and RabusMuskett and others, 2003; Reference MuskettMuskett, 2007). The model allows us to estimate winter snow accumulation as a function of elevation (Reference Muskett, Lingle, Tangborn and RabusMuskett and others, 2003; Reference MuskettMuskett, 2007). This enabled adjustment of the elevations to the 1 September 1999 surface which we adopted as our reference surface. (Note, however, that the end of the balance year in south-central Alaska tends to be about mid-August (Reference SharpSharp, 1951). More recent observations suggest a lengthening of the ablation season (Reference Sauber, Molnia, Carabajal, Luthcke and MuskettSauber and others, 2005).) We assume, using an approximation of Sorge’s law, that the density vs depth profile of surface snow to glacier ice is roughly time-invariant within each elevation increment (Reference BaderBader, 1954).
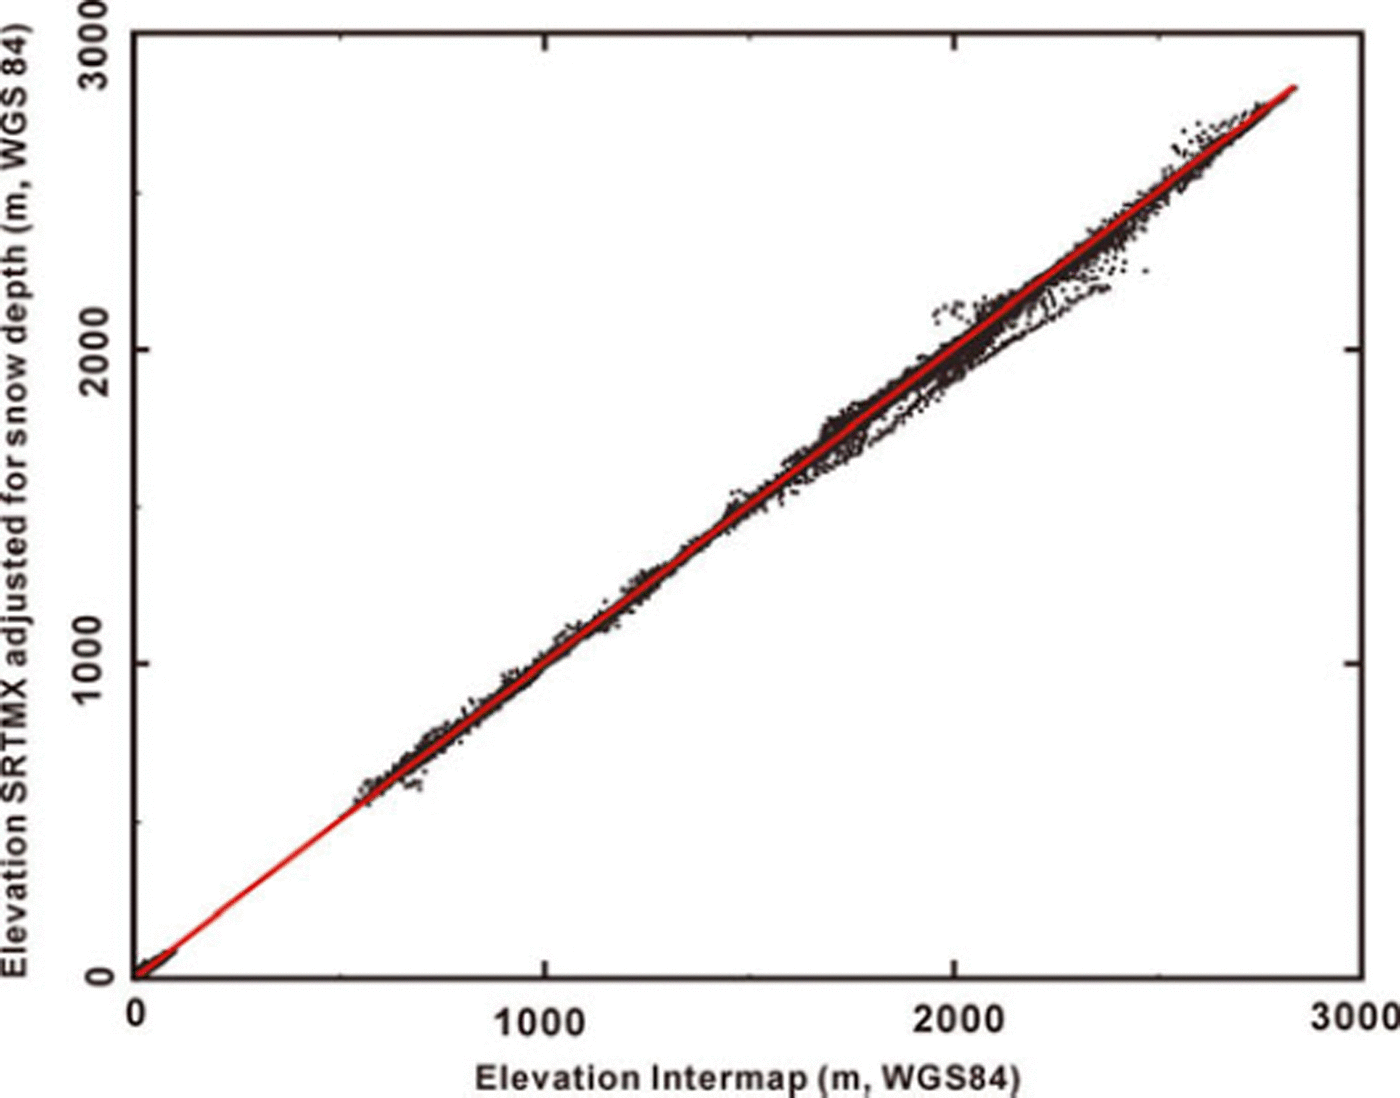
The relative accuracy of the SRTM DEM was validated using the Intermap Malaspina DEM by comparing same-location elevations on non-glacierized terrain of the Malaspina foreland and on south-facing slopes of the St Elias Mountains (Fig. 2). The comparison using elevations from sea level to ∼3000 m is that the SRTM DEM is 3.2 ± 2.9 m higher on average than the Intermap Malaspina DEM (±2.9 m is the standard deviation of the pixel differences). Compared with only the low-slope foreland elevations, the SRTM DEM is 3.5 ± 0.8 m higher on average than the Inter-map Malaspina DEM.
Co-position elevation comparison of the SRTM to the Inter-map Malaspina DEM.
US Geological Survey (USGS) DEMs covering the Malaspina Glacier system in Alaska were derived from relief plate contours corresponding to 1: 63 360 scale topographic maps (USGS, 1990) (Table 1). The compilation of the relief-plate contours date from aerial photography acquired in late summer in 1972 and 1973. The data have 2″ latitude by 3″ longitude elevation postings relative to the North American Datum 1927. The vertical reference for elevation is the National Geodetic Vertical Datum 1929 (NGVD29). Nominal vertical accuracy of the USGS DEMs is ∼15 m (1/2 map contour interval).
The USGS DEMs were mosaicked, re-projected onto the UTM system with WGS84 horizontal datum (vertical datum not affected) and resampled to 30 × 30 m pixel size for co-registration with the Intermap and SRTM DEMs for estimates of the multi-decadal area-average elevation changes (Reference Muskett, Lingle, Tangborn and RabusMuskett and others, 2003; Reference MuskettMuskett, 2007). The Intermap and SRTM DEMs were adjusted to a mean sea-level datum using the NOAA National Geodetic Survey GEOID99-Alaska geoid, for differencing with the USGS DEMs. GEOID99-Alaska is a derivative of the GEOID99 geoid model of the North American Vertical Datum 1988 (Reference Smith and RomanSmith and Roman, 2001).
Vector thematic files corresponding to topographic maps from Natural Resources Canada covering Upper Seward Glacier define a late-summer glacier surface (air photos acquired in July 1976) for differencing with the Intermap Bagley DEM (Geomatics Canada, 1996). The DEMs were derived from the contour and point-height files (Table 1). The Canada DEMs use WGS84 as the horizontal datum. The vertical datum is NGVD29. The mosaic of the Canada DEMs covering Upper Seward Glacier was adjusted for estimated systematic errors in comparison to the Intermap Bagley DEM.
The USGS and Canada DEMs are the dominant source of elevation errors. Systematic height errors probably have two sources: (1) inadequate photogrammetric vertical control, and (2) poor stereographic resolution in flat and low-contrast terrain, causing contour mislocation and shape exaggeration, i.e. ‘contour floating’ (Reference MuskettMuskett, 2007). Vertical control errors of the USGS DEMs were estimated relative to the Intermap Malaspina and SRTM DEMs on low-slope (0–2°) areas of the non-glacierized Malaspina foreland (Reference Muskett, Lingle, Tangborn and RabusMuskett and others, 2003). On the foreland near Cape Sitkagi (59°44′ N, 140°45′ W; ∼10 m a.s.l.), a sample area of 54 071 pixels or 49 km2, the USGS DEM was found to be within ±10 m (standard deviation) of the co-registered, seasonal snowdepth-adjusted and geoid-referenced SRTM DEM (see table 1 of Reference Muskett, Lingle, Sauber, Rabus and Tang-bornMuskett and others, 2008).
Height errors caused by ‘contour floating’ were estimated by comparing USGS and Canada DEM contour shapes to corresponding contour shapes of the Intermap and SRTM DEMs on the glaciers. We assume corresponding contours should have the same shapes (not absolute elevations) in 1972/73 and 2000 and 2002. This assumption was tested on Tyndall Glacier, where massive thinning has occurred (Reference Muskett, Lingle, Tangborn and RabusMuskett and others, 2003, Reference Muskett, Lingle, Sauber, Rabus and Tang-born2008). The USGS contours showed little exaggeration, although some up-glacier shift was evident due to thinning. The USGS DEM contour shapes relative to the Intermap and SRTM DEM contour shapes suggest the 1972/73 surface was systematically mapped ∼6 ± 3 m higher.
Ice, Cloud and land Elevation Satellite (ICESat) laser altimetry
The ICESat instrument transmits and receives coherent light pulses at 532 nm (green channel) and 1064 nm (near-infrared channel) from a 3 laser pod carousel system (Reference Schutz, Zwally, Shuman, Hancock and Di-MarzioSchutz and others, 2005). The pulse rate is 40 pulses s−1, illuminating a footprint ∼70 m in diameter and spaced 172 m along the orbit track. Orbital track coverage is global between 86° N and 86° S. Spacing between tracks is ∼14.5 km at 60° N over south-central Alaska. The horizontal and vertical reference datum of ICESat altimetry is the TOPEX/Poseidon ellipsoid. This datum was transformed to WGS84 ellipsoid datum for comparison to the Intermap DEMs.
ICESat waveforms of the Global Elevation Altimetry used in this study showed minimal cloud, to modest, variable cloud conditions. Same-day NASA TerraMODIS (moderate-resolution imaging spectroradiometer) imagery corroborates good weather conditions over the glaciers of interest at the times of ICESat data acquisitions, although farther into the interior of Alaska and into the central Gulf of Alaska cloudiness was evident. The altimetry data were acquired from laser campaigns 1, 2A, 2B, 3A, 3B and 3G, in 2003, 2005 and 2006. Most of the acquisitions occurred in October and November. The Laser 1 campaign was from March 2003, and a Laser 2B track was from February 2004. Adjustments were made for estimated snow accumulation for each laser campaign using the Reference TangbornTangborn (1999) glacier mass-balance model and published in situ surface snow densities (Reference Muskett, Lingle, Sauber, Rabus and Tang-bornMuskett and others, 2008). Vertical bias relative to the SRTM DEM was 0.05 ± 3.01 m (ICESat higher) and relative to the Intermap Malaspina DEM was 3.5 ± 2.9 m (ICESat higher). The later bias is used as a vertical adjustment to the ICESat altimetry.
Results
In referring to area-average elevation changes, we use the net mass-balance formalism of Reference MeierMeier (1962) in the fixed-date system (Anonymous, 1969). Glacier net mass balance  , i.e. the area-average surface-elevation change rate, in meters per year, is

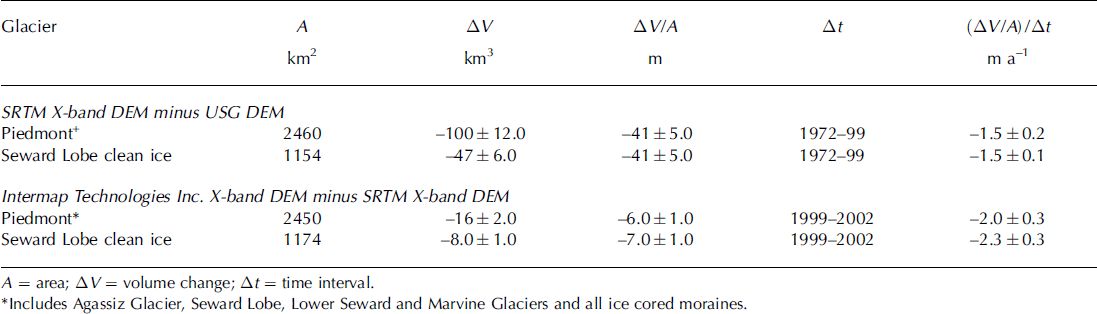
where ΔV is the integrated volume change over the whole glacier during Δt, Ā is the mean glacier area during Δt, and Δt is the time interval, preferably (or approximately) an integer number of years. This distinction is used on parts of the Malaspina Glacier system such as Seward Lobe, and its east and west halves individually, to compare the surface elevation changes on the receiving area of the 1999–2002 surge (western half) to those on the receiving area of the 1987/88 surge (eastern half). Applied in this way, Equation (1) represents the area-average surface elevation change rate over the area of interest (Tables 2 and 3). Area-average surface-elevation changes on the folded debris-covered ice-cored moraines were also examined by parts and in total. During the time periods 1972–99 and from 1999–2002, the distributions of area-average surface elevation change rates on the clean ice of Seward Lobe were examined.
Glacier area-average surface elevation changes
Glacier same-area comparison of area-average surface elevation changes
Spatial and temporal surface-elevation changes
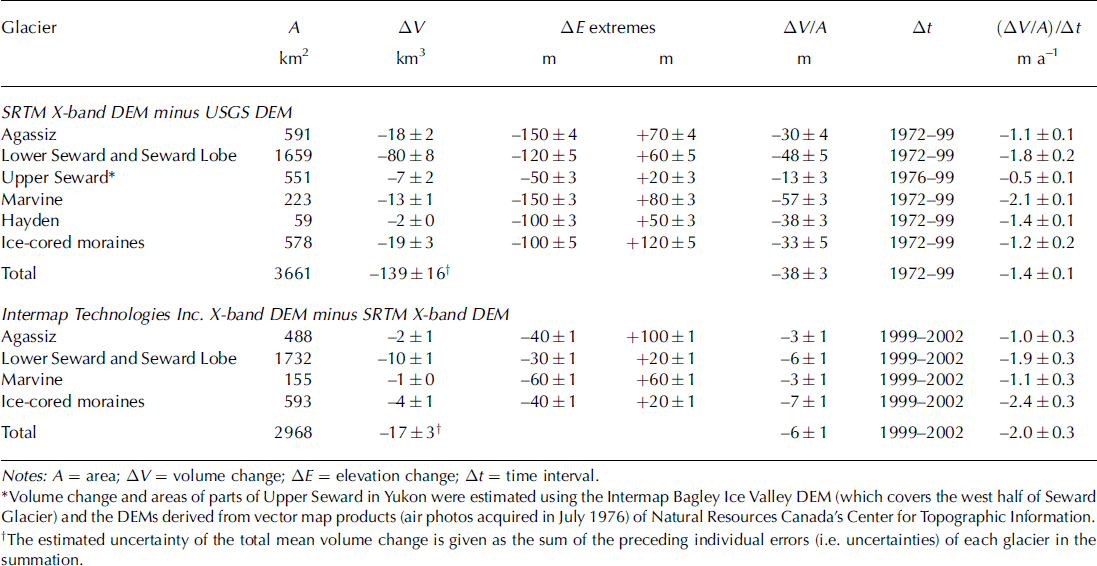
Figure 3 shows surface-elevation changes on the Malaspina Glacier system: (1) from 1972 to 1999, using the SRTM minus the USGS DEM; (2) from 1999 to 2002, using the Intermap Malaspina minus the SRTM DEM; and (3) from 1976 to 2000, using the Intermap Bagley minus the Canada DEM (3C). Table 2 summarizes the volume, area-average surface-elevation changes and the rates of change on the glaciers. From 1972 to 1999, there were increases in surface elevations on upper Agassiz, Lower Seward mouth and upper Marvine glaciers (Fig. 3a). In the same period, surface-elevation decreases occurred over Seward Lobe, largest on the eastern half, and on the lower reaches of Agassiz and Marvine Glaciers. The near-margin ice-cored moraines of Marvine Lobe and the eastern side of Seward Lobe had surface-elevation increases.
Difference DEMs of the Malaspina Glacier system in Alaska. (a) Surface-elevation changes during the 27 year interval from late summer 1972 to September 1999. An arrow shows the main-flow surge direction. (b) Surface-elevation changes during the 3 year interval from September 1999 to August 2002. An arrow shows the main-flow surge direction. (c) Surface-elevation changes on Upper Seward Glacier during the 24 year interval from late summer 1976 to late summer 2000. ID marks the location of the ice divide with Bagley Ice Valley.
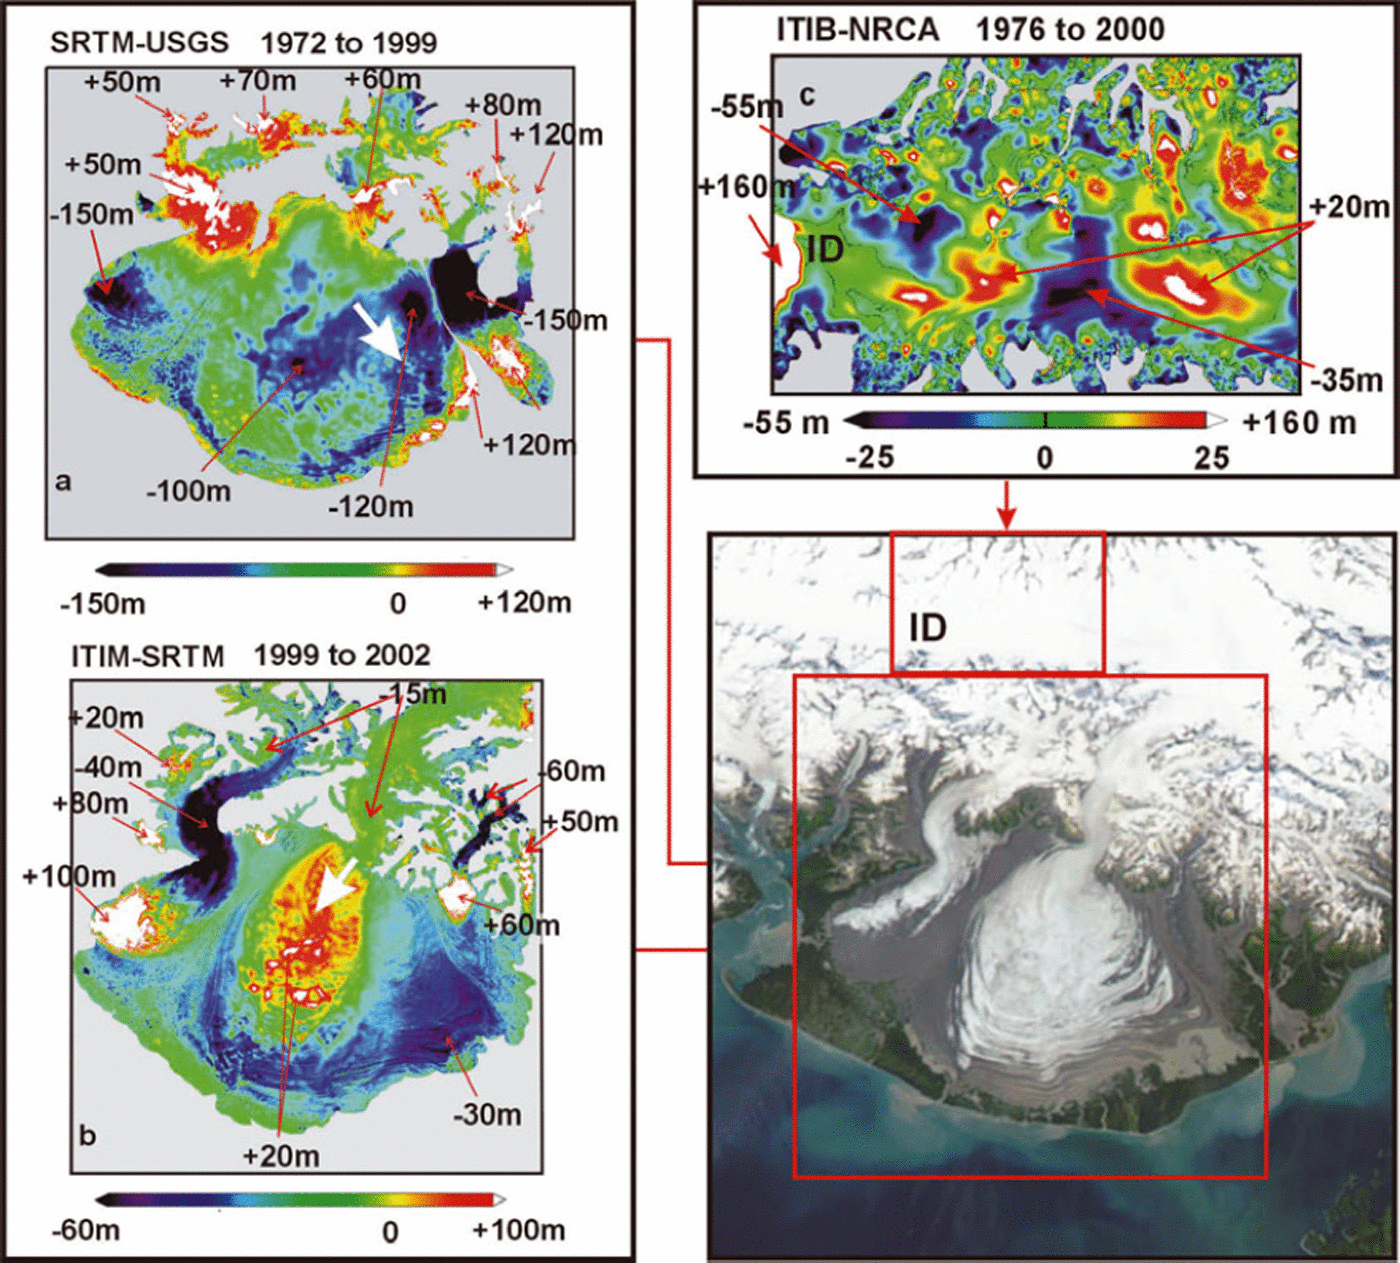
From 1999 to 2002, the upper reaches of Agassiz Glacier had surface-elevation decreases, while surface elevations on its piedmont had increases (Fig. 3b; Table 2). The Agassiz terminus advanced by up to 1.6 km. Surface elevations decreased most strongly in the mouth of Lower Seward Glacier, and on the upper reaches of Marvine Glacier, while surface elevations increased substantially on the western half of Seward Lobe, below the mouth of Lower Seward Glacier and on the upper ablation area of Marvine Glacier (Fig. 3b; Table 2). Surface elevation changes on the western half of Upper Seward Glacier in Yukon from July 1976 to September 2000 were also spatially variable (Fig. 3c; Table 2) and decreased on average. These surface elevation changes are clear signatures of three near-concurrent surges from 1999 to 2002.
The debris-covered, ice-cored folded medial moraines of the Malaspina piedmont experienced surface-elevation changes in response to the three surges of 1999–2002 (Fig. 3a and b; Table 2). A portion of the folded moraine between Agassiz Glacier and Seward Lobe has surface elevations increased by 20 ± 1 m. The horizontal displacements of the folded moraines between Agassiz Glacier, Seward Lobe and Marvine Glacier were up to 90 ± 1 m. Local surface-elevation decreases of 40 ± 1 m were observed on the folded moraines. Thermokarst sinkholes, with local relief of –10 to –20 m, are abundant on the debris-covered ice-cored moraines (Reference Sauber, Molnia, Carabajal, Luthcke and MuskettSauber and others, 2005). Expansion of sinkhole size by slumping and reactivation of buried crevasses by the three surges of 1999–2002 caused clean ice to be exposed to above-freezing winter and fall temperatures and increased precipitation associated with recent climate warming (Reference Muskett, Lingle, Tangborn and RabusMuskett and others, 2003).
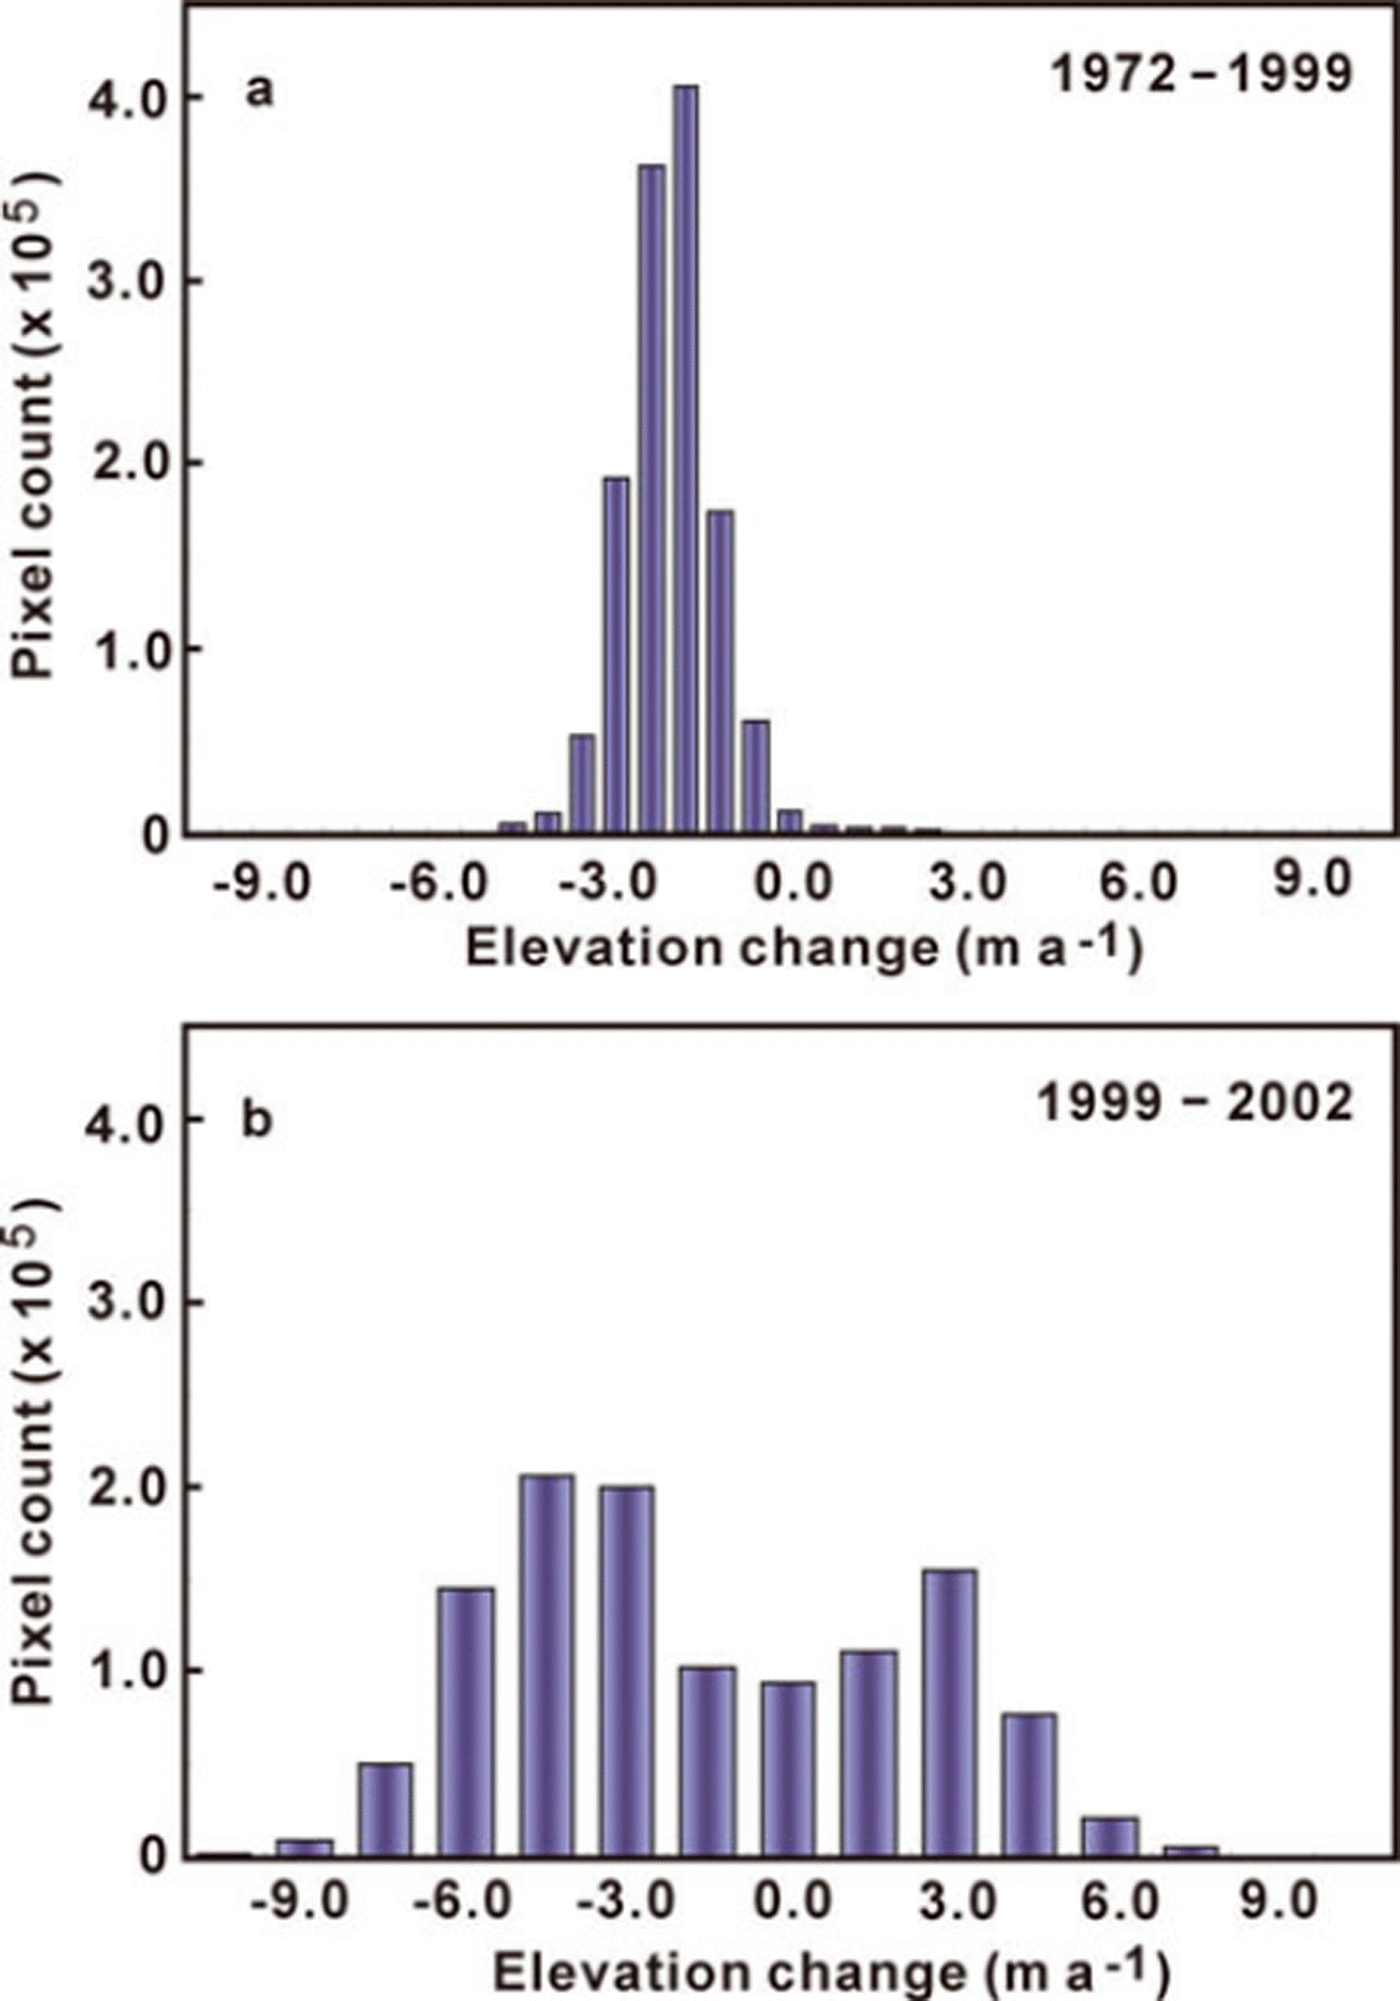
The spatial distribution of surface-elevation changes and their rates on the relatively clean ice of Seward Lobe and the piedmont glaciers, on a same-area basis, from 1972 to 1999 and 1999 to 2002 was also examined (Fig. 4; Table 3). From 1972 to 1999, Seward Lobe experienced an area-average surface lowering of 41 ± 5 m at 1.5 ± 0.2 m a−1 (a volume loss rate of 1.7 ± 0.2 km3 a−1),a single-mode distribution (Fig. 4a). From 1999 to 2002, the distribution of surface elevation rates was bimodal (Fig. 4b). In this period the clean ice of Seward Lobe had an area-average surface lowering of 7 ± 1 m at 2.3 ± 0.3 m a−1 (a volume loss rate of 2.7 ± 0.3 km3 a−1), an increase of ∼50–60%. The distribution became asymmetric with positive and negative modes. The western half of the lobe, which was the receiving area of the 1999–2002 surge, underwent area-average surface elevation increase at 3.4 ± 10.3 m a−1, which coincides with the smaller positive mode of the distribution (Fig. 4b). The eastern half of Seward Lobe, which was the receiving area of the 1987/88 surge (Fig. 6a–f), underwent area-average surface lowering at 4.1 ± 10.3 m a−1, which coincides with the dominant negative mode of the distribution (Fig. 4b).
Distributions of the surface-elevation change on Seward Lobe: (a) 1972–99, and (b) 1999–2002.
The surface-elevation change rates on the debris-covered ice-cored moraines were examined (Table 2). Typical stagnant debris-covered ice-cored moraines, like those of the temperate non-surge glaciers of the North Cascades Mountains, Washington, USA, typically have rates of surface lowering that are about 50–75% of those of nearby clean glacier ice (Reference PeltoPelto, 2000). During the 1999–2002 surges, the western moraines, those between Agassiz Glacier and Seward Lobe, had an area-average lowering rate of 1.7 ± 0.3 m a−1.The tightly folded moraines near the ocean margin of Seward Lobe had an area-average lowering rate of 1.8 ± 0.3 m a−1.The eastern moraines, those between Seward Lobe and Marvine Glacier, had an area-average surface lowering rate of 3.0 ± 0.3 m a−1 from 1999 to 2002. Thus, the area-average surface lowering rate of the debris-covered ice-cored moraines on the eastern side of Seward Lobe was about two-thirds that of the clean ice of the eastern half of Seward Lobe, consistent with the findings of Reference PeltoPelto (2000).
Combining the volume-change estimates and areas during the periods of DEM acquisitions shows that from 1972 to 1999 the Malaspina Glacier system lost 139 ± 9 km3, corresponding to area-average surface lowering at 1.4 ±0.1 m a−1. From 1999 to 2002 the volume lost was 17 ± 1 km3, with area-average surface lowering at 2.0 ± 0.3 m a−1.The difference suggests an increase of 0.6 ± 0.3m a−1 or a 20–60% increase in the rate of surface lowering. The integrated volume loss from 1972 to 2002 was 156 ± 9 km3 over an area of 3661 km2, 73% of the total glacier system area.
Mean surface-elevation changes from ICESat altimetry
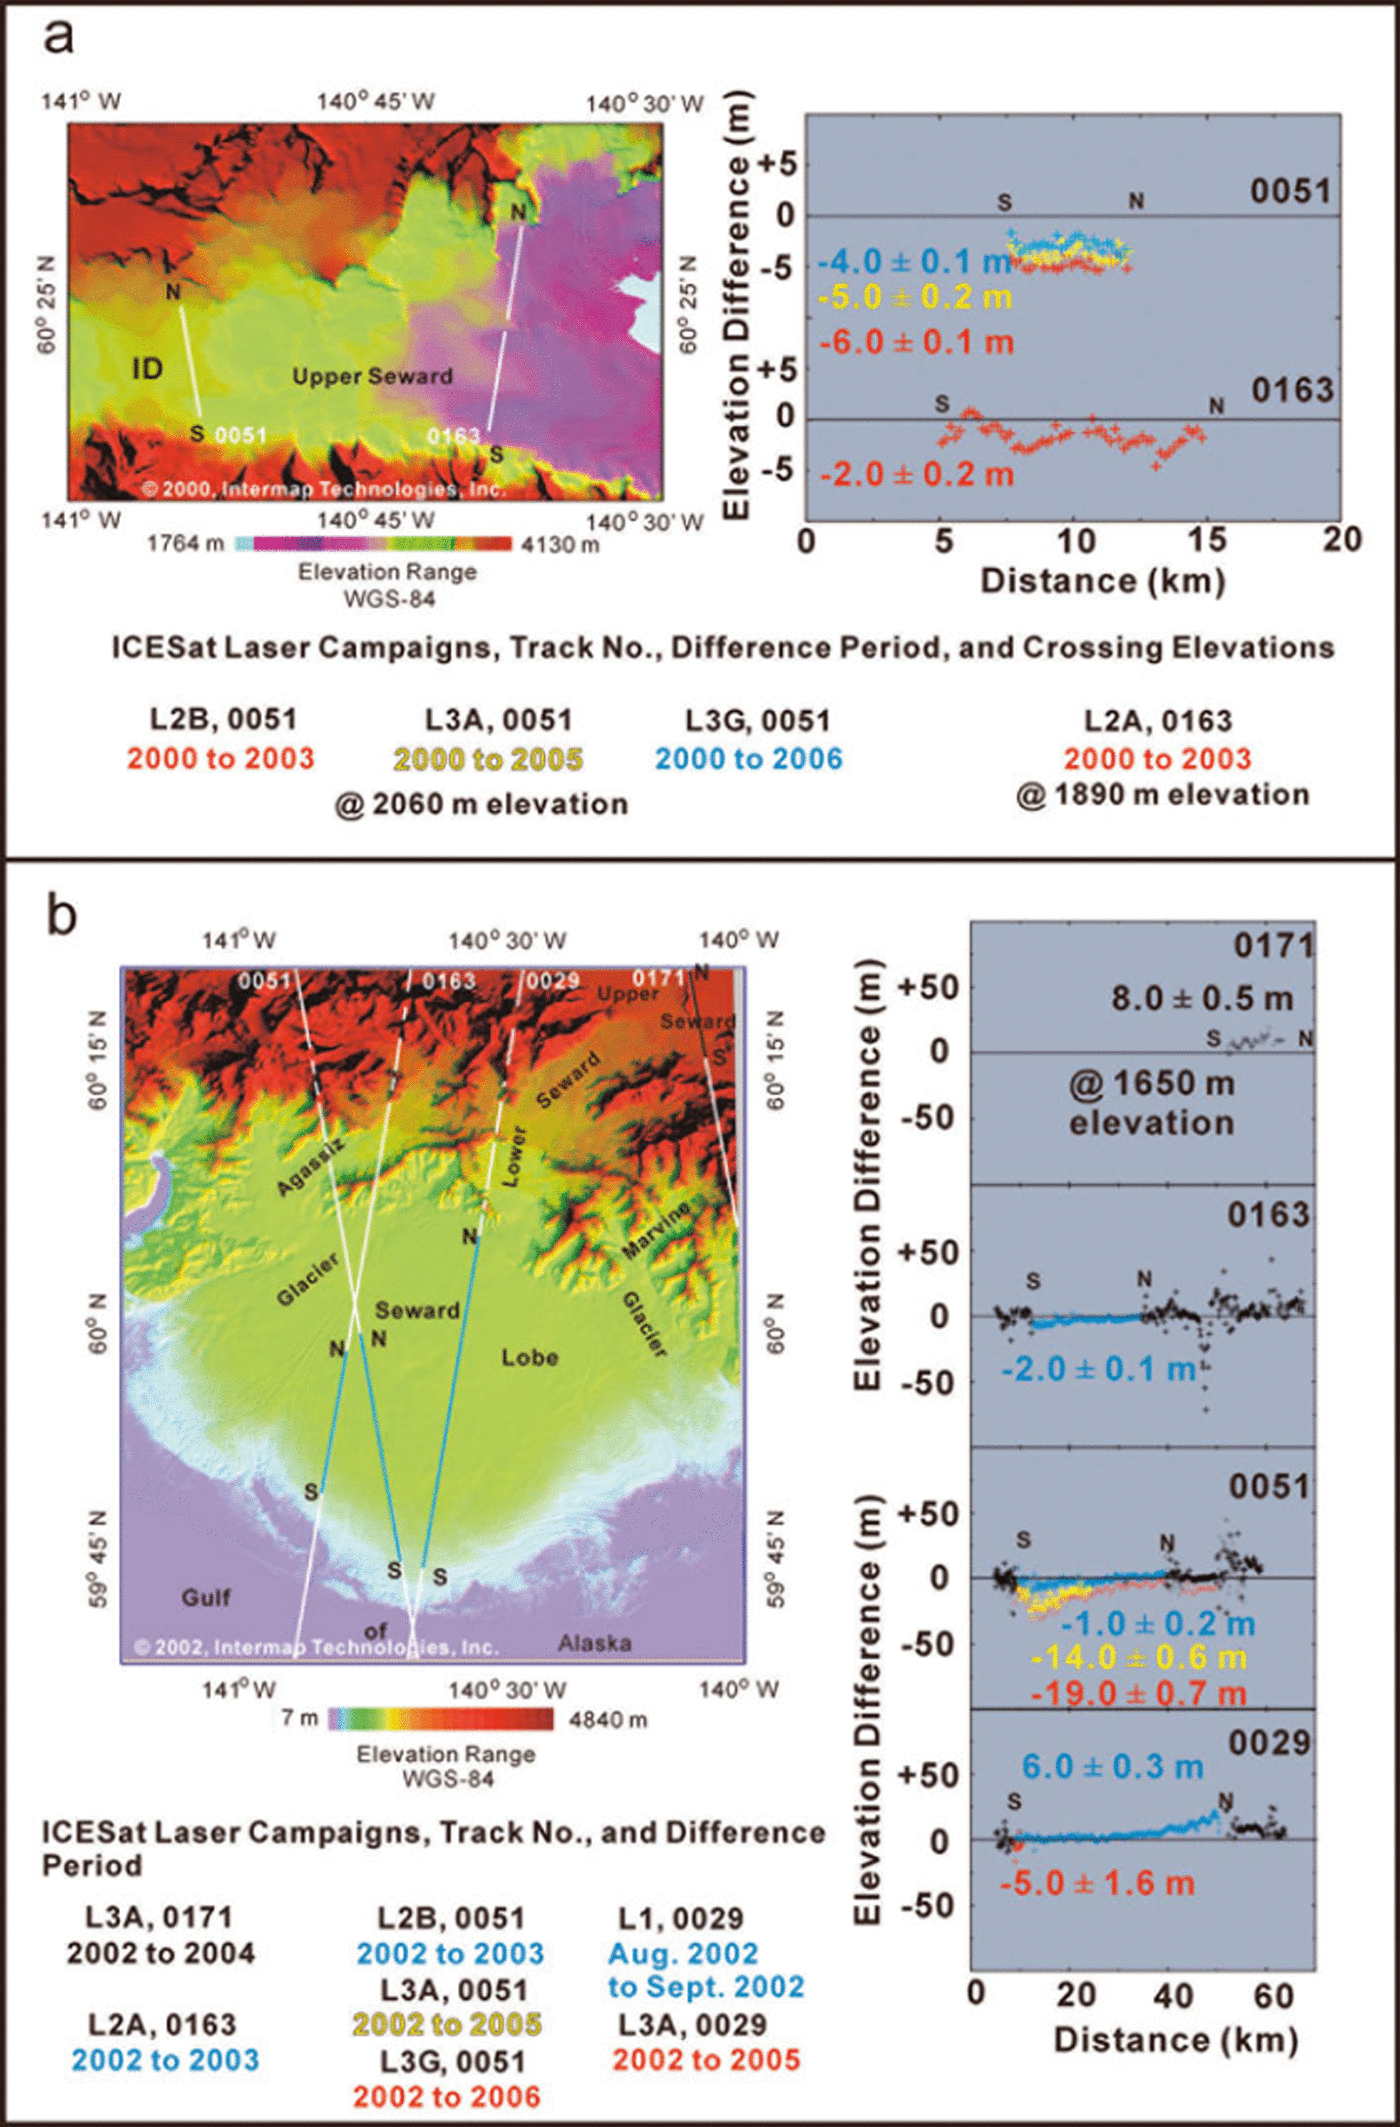
Differencing of ICESat laser altimetry with the Intermap DEMs allows for examination of along-track elevation changes from 2000 to 2006 (Fig. 5). Notable features of reference in the Intermap Bagley DEM are the ice divide with Bagley Ice Valley, given by the converging contours and color gradation on the left, and crevasses down-glacier to the east. Elevation-change profiles are arranged from south (S) to north (N). Mean elevation changes on the glaciers are given in Table 4.
ICESat along-track mean surface-elevation changes relative to Intermap DEMs on parts of the Malaspina Glacier system. Intermap Bagley DEM of Upper Seward Glacier with two ICESat tracks are plotted (a, left) and the surface elevation difference plots (a, right). ID locates the ice divide with Bagley Ice Valley. The Intermap Malaspina DEM with four ICESat tracks are plotted (b, left) and the along-track elevation changes (b, right). Mean elevation changes of the clean ice portions (colored sections of the tracks) are given.
ICESat-derived elevation changes relative to Intermap DEMs
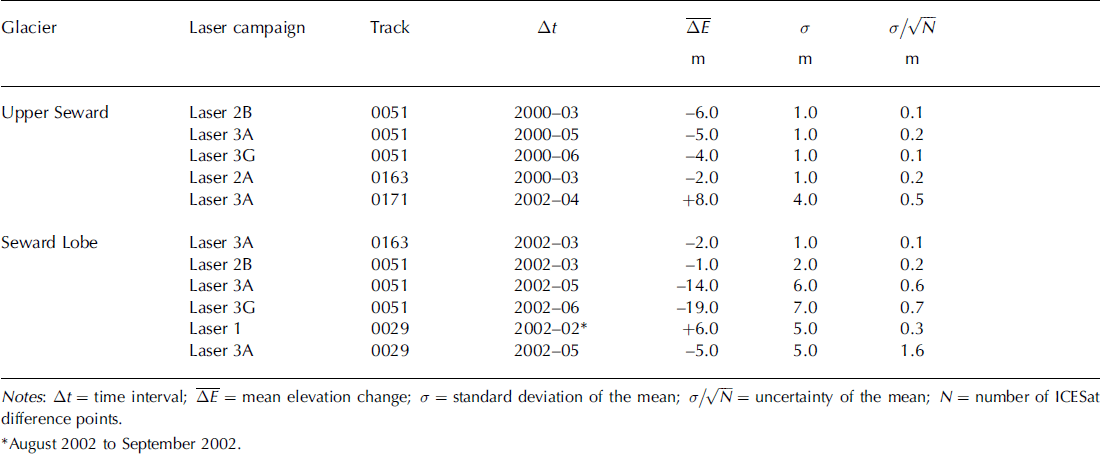
Mean near-repeat elevation lowering near the ice divide at 2060 m elevation from 2000 to 2003, 2005 and 2006 was 6 ± 0.1 m, 5 ± 0.2 m and 4 ± 0.1 m, respectively (Fig. 5, upper, track 0051). The ICESat-derived elevation changes were adjusted, at the time of acquisition, for seasonal snow accumulations and vertical offset relative to the nonglacierized Malaspina foreland as described previously. Interestingly, there was mean surface-elevation rise at 1650 m elevation on the eastern side of Mount Irving nunatak, at 8 ± 0.5 m from 2002 to 2004 (Fig. 5, upper, track 0171).
Figure 5 (lower) illustrates the along-track surface-elevation changes from 2002 to 2003, 2005 and 2006. A strong surface-elevation decrease, 72 m, near the 50 km mark on track 0163 is noticeable. This occurs at the location of Oily Lake, a glacier dammed between the Samovar Hills nunatak and the Agassiz–Seward Lobe folded moraine (see USGS 1:250 000 map series, Mount St Elias, for geographic named features). The difference result suggests that the surge of Lower Seward, which affected the clean ice and bounding moraines of the western half of Seward Lobe, disrupted the ice-cored moraine dam and allowed the water of Oily Lake to drain, presumably under the moraine. Oily Lake was observed drained of water in the summer of 2003 (personal communication from B. Reference MolniaMolnia, 2007).
Mean surface-elevation lowering along the ICESat near-repeat track 0051 crossing diagonal west-to-center of Seward Lobe was 1.0 ± 0.2 m, 14.0 ± 0.6 m and 19.0 ± 0.7 m from 2002 to 2003, 2005 and 2006, respectively. Mean surface-elevation rising along track 0029, adjusted by removal of the estimated winter snow accumulation near the center of Seward Lobe, has a mean change of 6.0 ± 0.3 m from August 2002 to September 2002 (Fig. 5, lower). Rising surface elevation is largest nearest the mouth of Lower Seward Glacier. This corresponds well with the surface-elevation differences derived though differencing of the Intermap DEMs.
Discussion and Interpretation
The surges of the Seward Lobe of the Malaspina piedmont, 1954–99
Prior to the 1999–2002 surge, Seward Lobe experienced observed surges in the early 1930s (B. Washburn photograph, 1954–56 and 1987/88; Reference SharpSharp, 1958; Reference Jones, Molnia and SchoonmakerJones and others, 1989). The 1954–56 surge was noted by a marked increase in the number and size of crevasses between August 1953 and August 1954, rendering traversing the ice impossible. Swales and swells appeared greater in 1954 than in 1953 (not corroborated by measurements). An aluminum pipe drill stem being used in an ice-deformation/velocity-at-depth experiment broke at ∼100 m depth in the borehole. By late summer 1956, the surge had reached the folded debris-covered ice-cored moraines on the south terminus.
On 25 November 1986, prior to the beginning of the 1987/88 surge, the USGS flew an X-band side-looking airborne radar over the Malaspina piedmont (Reference Jones, Molnia and SchoonmakerJones and others, 1989; Reference Molnia and JonesMolnia and Jones, 1989). The backscatter image (10 m pixel size) had a distinctive glacier bed morphology mirrored on the surface topography. In the image, the western half of the piedmont showed two crossing patterns of wide-channel morphology, while the eastern half of the piedmont showed a fine-scale dendritic morphology.
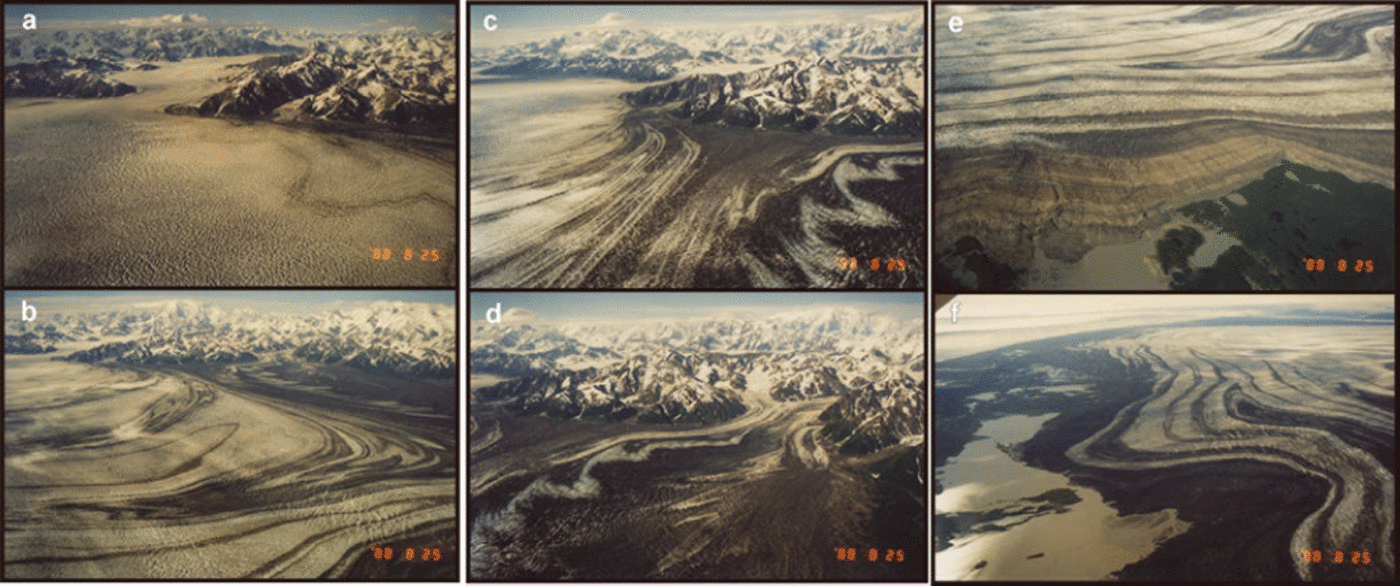
The 1987/88 surge (Fig. 6) was a major event affecting the eastern half of Seward Lobe. Prior to the surge, analysis of the folded medial moraines using aerial photography from 1933/34 with later photography from the 1960s suggested at that time that the next surge should have occurred around 1970; it did not. However, a noticeable change in flow direction to the southeast occurred. When the delayed surge did occur, its timing was 1.5 times that of the estimate of the surge cycle, as suggested from an analysis of the folded medial moraines. Oblique aerial photography (A.S. Post) shows the eastern half of Seward Lobe with heavy crevassing (Fig. 6a and b). A grayish smear on the Seward Lobe clean ice (Fig. 6b, left-center) marks an avalanche deposit first seen in a 1934 photo (B. Washburn) when it was first entering Seward Lobe. The total displacement, estimated from a shaded relief rendering of the Intermap Malaspina DEM, is ∼20 km. Heavy crevassing and the ‘1960’ fold (upper-left) are visible with two anomalous folds up-glacier. Marvine Glacier (Fig. 6c and d) had heavy crevassing indicating a major surge. The surge front overran parts of a low-stand forest and scattered lakes on the foreland (Fig. 6e). Malaspina Lake (Fig. 6f) was almost filled by the propagation of the surging ice and folded debris-covered ice-cored moraines. From this photograph the surge front moved ∼3–5 km into the lake at that time. The sediment-laden water in Malaspina Lake in late August 1988 indicated surge-ending floods from the basal water system had occurred.
The 1987/88 surge on the eastern half of Seward Lobe recorded in oblique aerial photographs (A.S. Post). Photographs (a) and (b) show primarily the heavy crevassing on the eastern half of Seward Lobe. Photographs (c) and (d) show heavy crevassing on Marvine Glacier. Photographs (e) and (f) show the terminus advance overriding the sparse forest and encroaching into a lake (e), and reduction of Malaspina Lake area by the encroaching surge (f).
Interpretation of the 1999–2006 surface-elevation changes
The elevation changes observed on the western half of Seward Lobe include localized increases up to 20.0 ± 1.0 m, with an area-averaged rising of 10.0 ± 1.0 m. The eastern half of Seward Lobe shows spot elevation decreases to 30.0 ± 1.0 m, with an area-averaged lowering of 12.0 ± 1.0 m. In this period the eastern half of Seward Lobe, the receiving area of the 1987/88 surge, lowered at an area-average rate of 4.0 ± 0.3 m a−1. From 1972 to 1999 the eastern half of Seward Lobe had been lowering at an area-average rate of 2.0 ± 0.1 m a−1. The factor-of-two increase in the area-average lowering rate of the clean ice of the Seward Lobe is also seen in the debris-covered ice-cored folded moraines of all three lobes. The folded moraines show an area-average lowering rate of 1.0 ± 0.1 m a−1 from 1972 to 1999, which accelerated to 2.0 ± 10.3 m a−1 from 1999 to 2002. Elevation changes from 1999 to 2002 imply the main direction of the 2002 surge was toward the south-southwest.
By May 2001, heavy crevassing was observed on Lower and Upper Seward Glaciers (Fig. 7a). Heavy crevassing was observed at the mouth of Lower Seward Glacier and the top of Seward Lobe, spreading to the south-southwest (Fig. 7b).
Surge effects on Lower–Upper Seward Glacier and Seward Lobe seen in NASA-Terra ASTER (Advanced Spacebourne Thermal Emission and Reflection Radiometer) images, May 2001 (a, b), and Landsat 7 image, July 2001 (from NASA Learning Technologies Landsat 7 Global Mosaic – NASA World Wind) (c). Dashed line in (b) marks the extent of new crevasses on the western half of Seward Lobe as the surge propagated from the mouth of Lower Seward Glacier. Circles in (c) locate openings of Röthlisberger channels discharging turbid water.
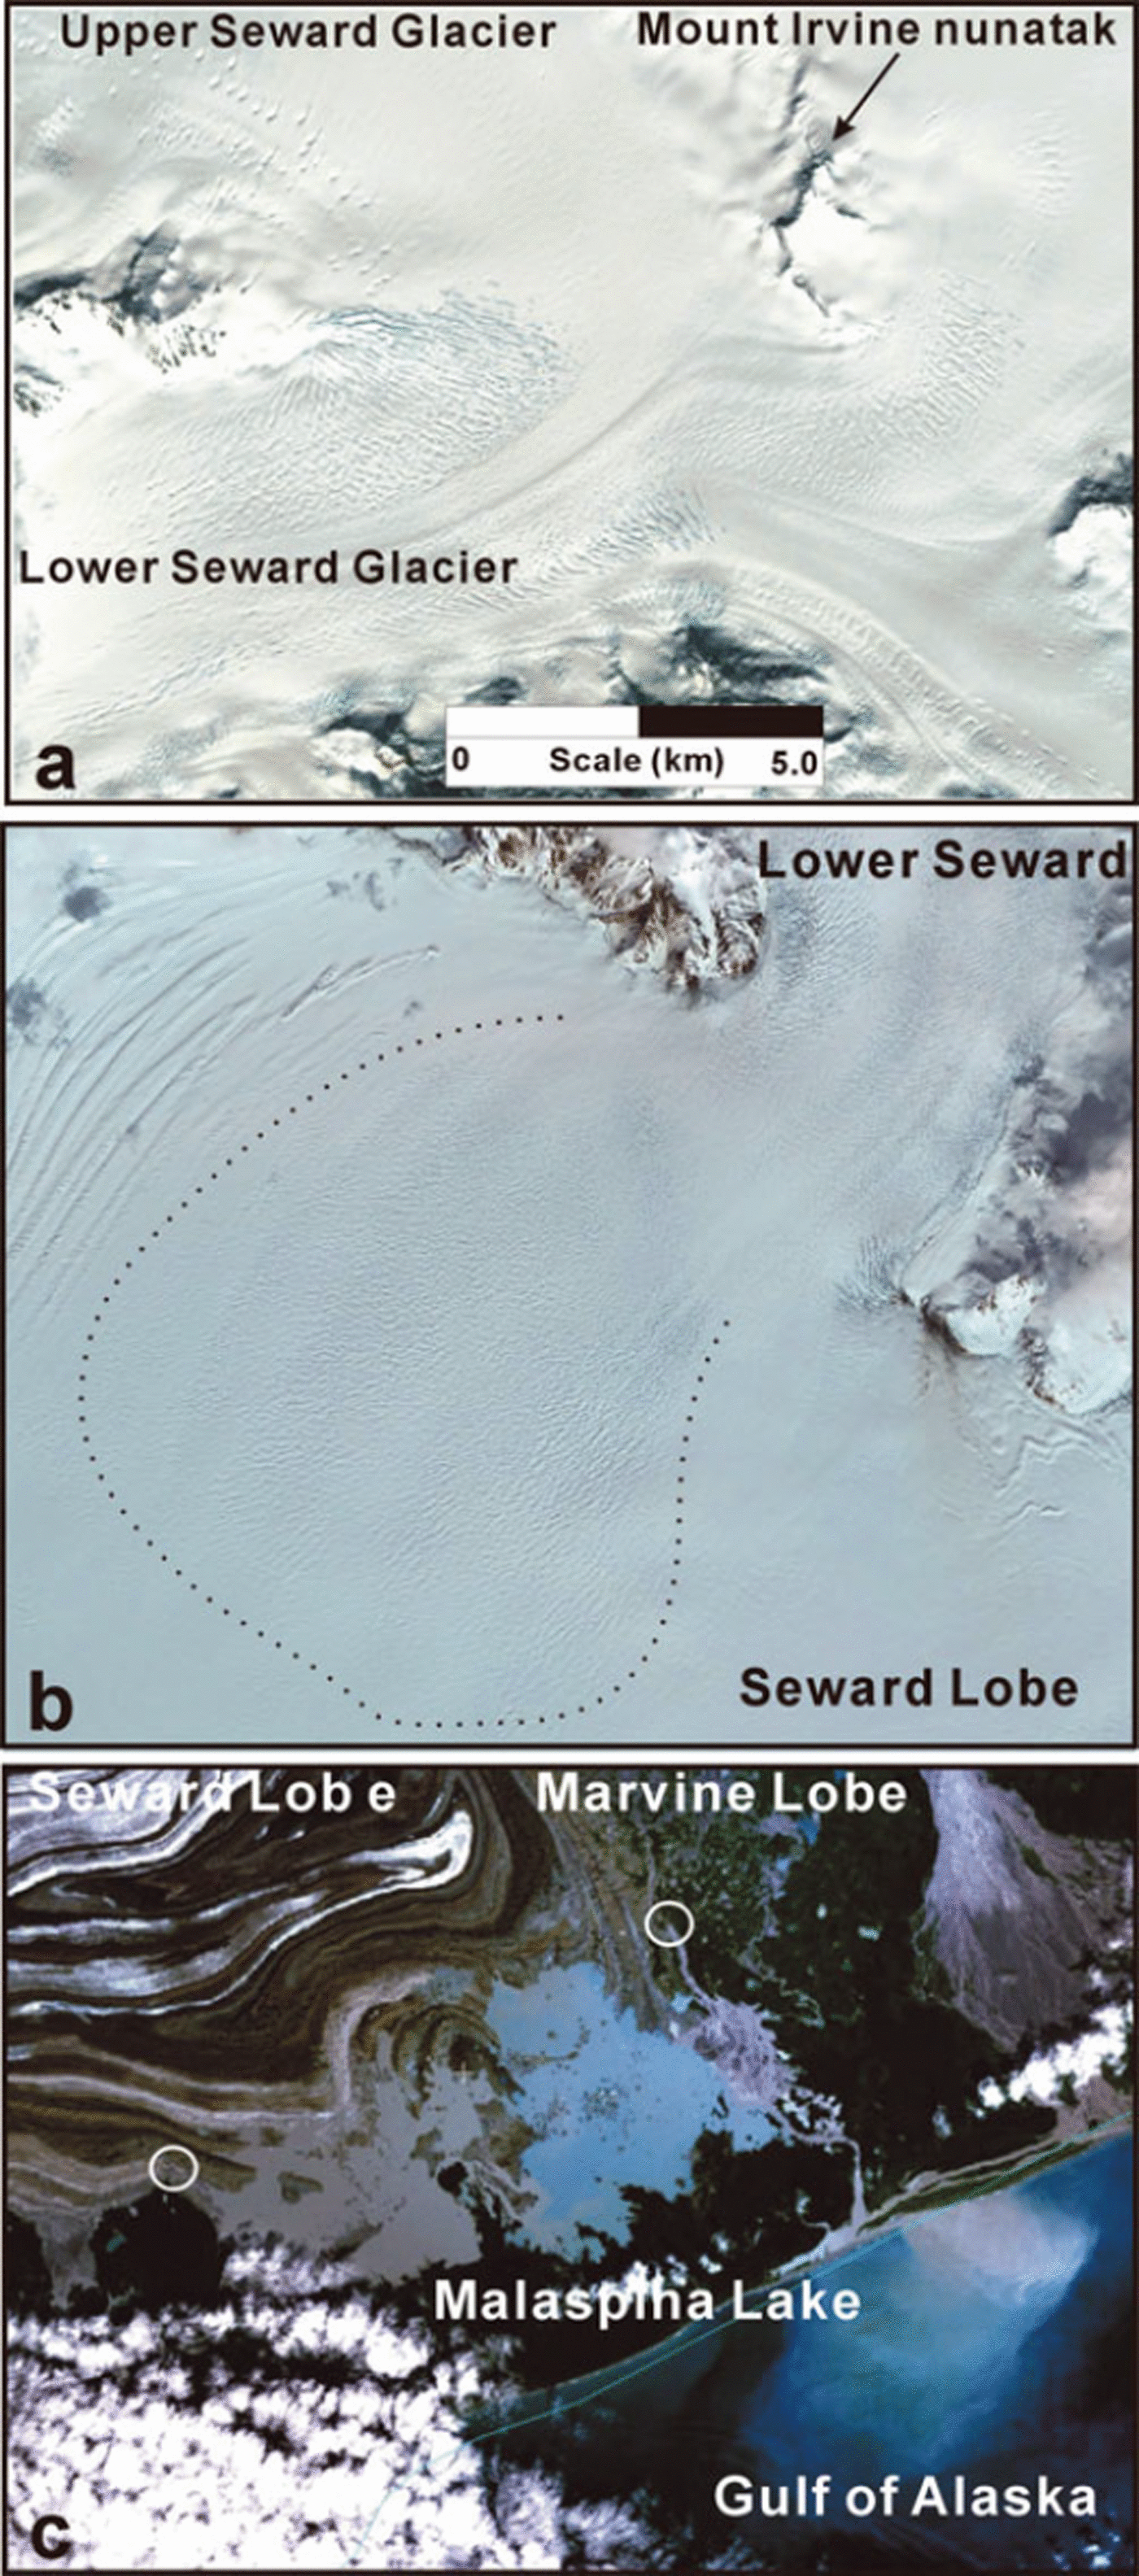
In summer 2000, Landsat 7 images showed Malaspina Lake to be relatively free of sediment-laden water. Turbid water discharges, indicative of outburst flooding through Röthlisberger channels, from the Seward Lobe terminus into the western half of Malaspina Lake and from the Marvine Glacier terminus into the Gulf of Alaska, were seen in a Landsat 7 image in July 2001 (Fig. 7c). By the late summers of 2003 and 2004, NASA MODIS images showed the entire lake having turbid water. The same images show turbid water discharging from the Agassiz Glacier terminus into Icy Bay, and from the southern terminus of Seward Lobe into the Gulf of Alaska.
Surface lowering from 2000 to 2003 on the western half of Upper Seward Glacier is due to drawdown, strongest near the ice divide with Bagley Ice Valley, by the surge of Lower Seward Glacier (Fig. 5, top, a). The reduction of lowering along near-repeat tracks from 2000 to 2005/06 indicates a post-surge 2003–06 recovery of mass to Upper Seward Glacier. The initial and strong surge-induced surface lowering occurred despite increase in annual snow accumulation, as estimated from the Mount Logan ice core from the King Col site (Reference Moore, Holdsworth and AlversonMoore and others, 2002). The strong surface rising along track east of the Mount Irving nunatak (Fig. 7a), on the eastern half of Upper Seward Glacier, indicates spatially non-uniform surface-elevation changes.
On Seward Lobe, ICESat-derived surface-elevation changes through 2006 show further evidence of the Lower Seward Glacier surge (Fig. 5). Surface rising near the mouth of Lower Seward Glacier is due to the 1999–2002 surge (Fig. 5, lower). An acceleration of surface lowering in the post-surge period from 2003 to 2006 is evident, probably from heavy crevassing and increased surface temperatures in summer (Fig. 5, lower).
Effects from climate change
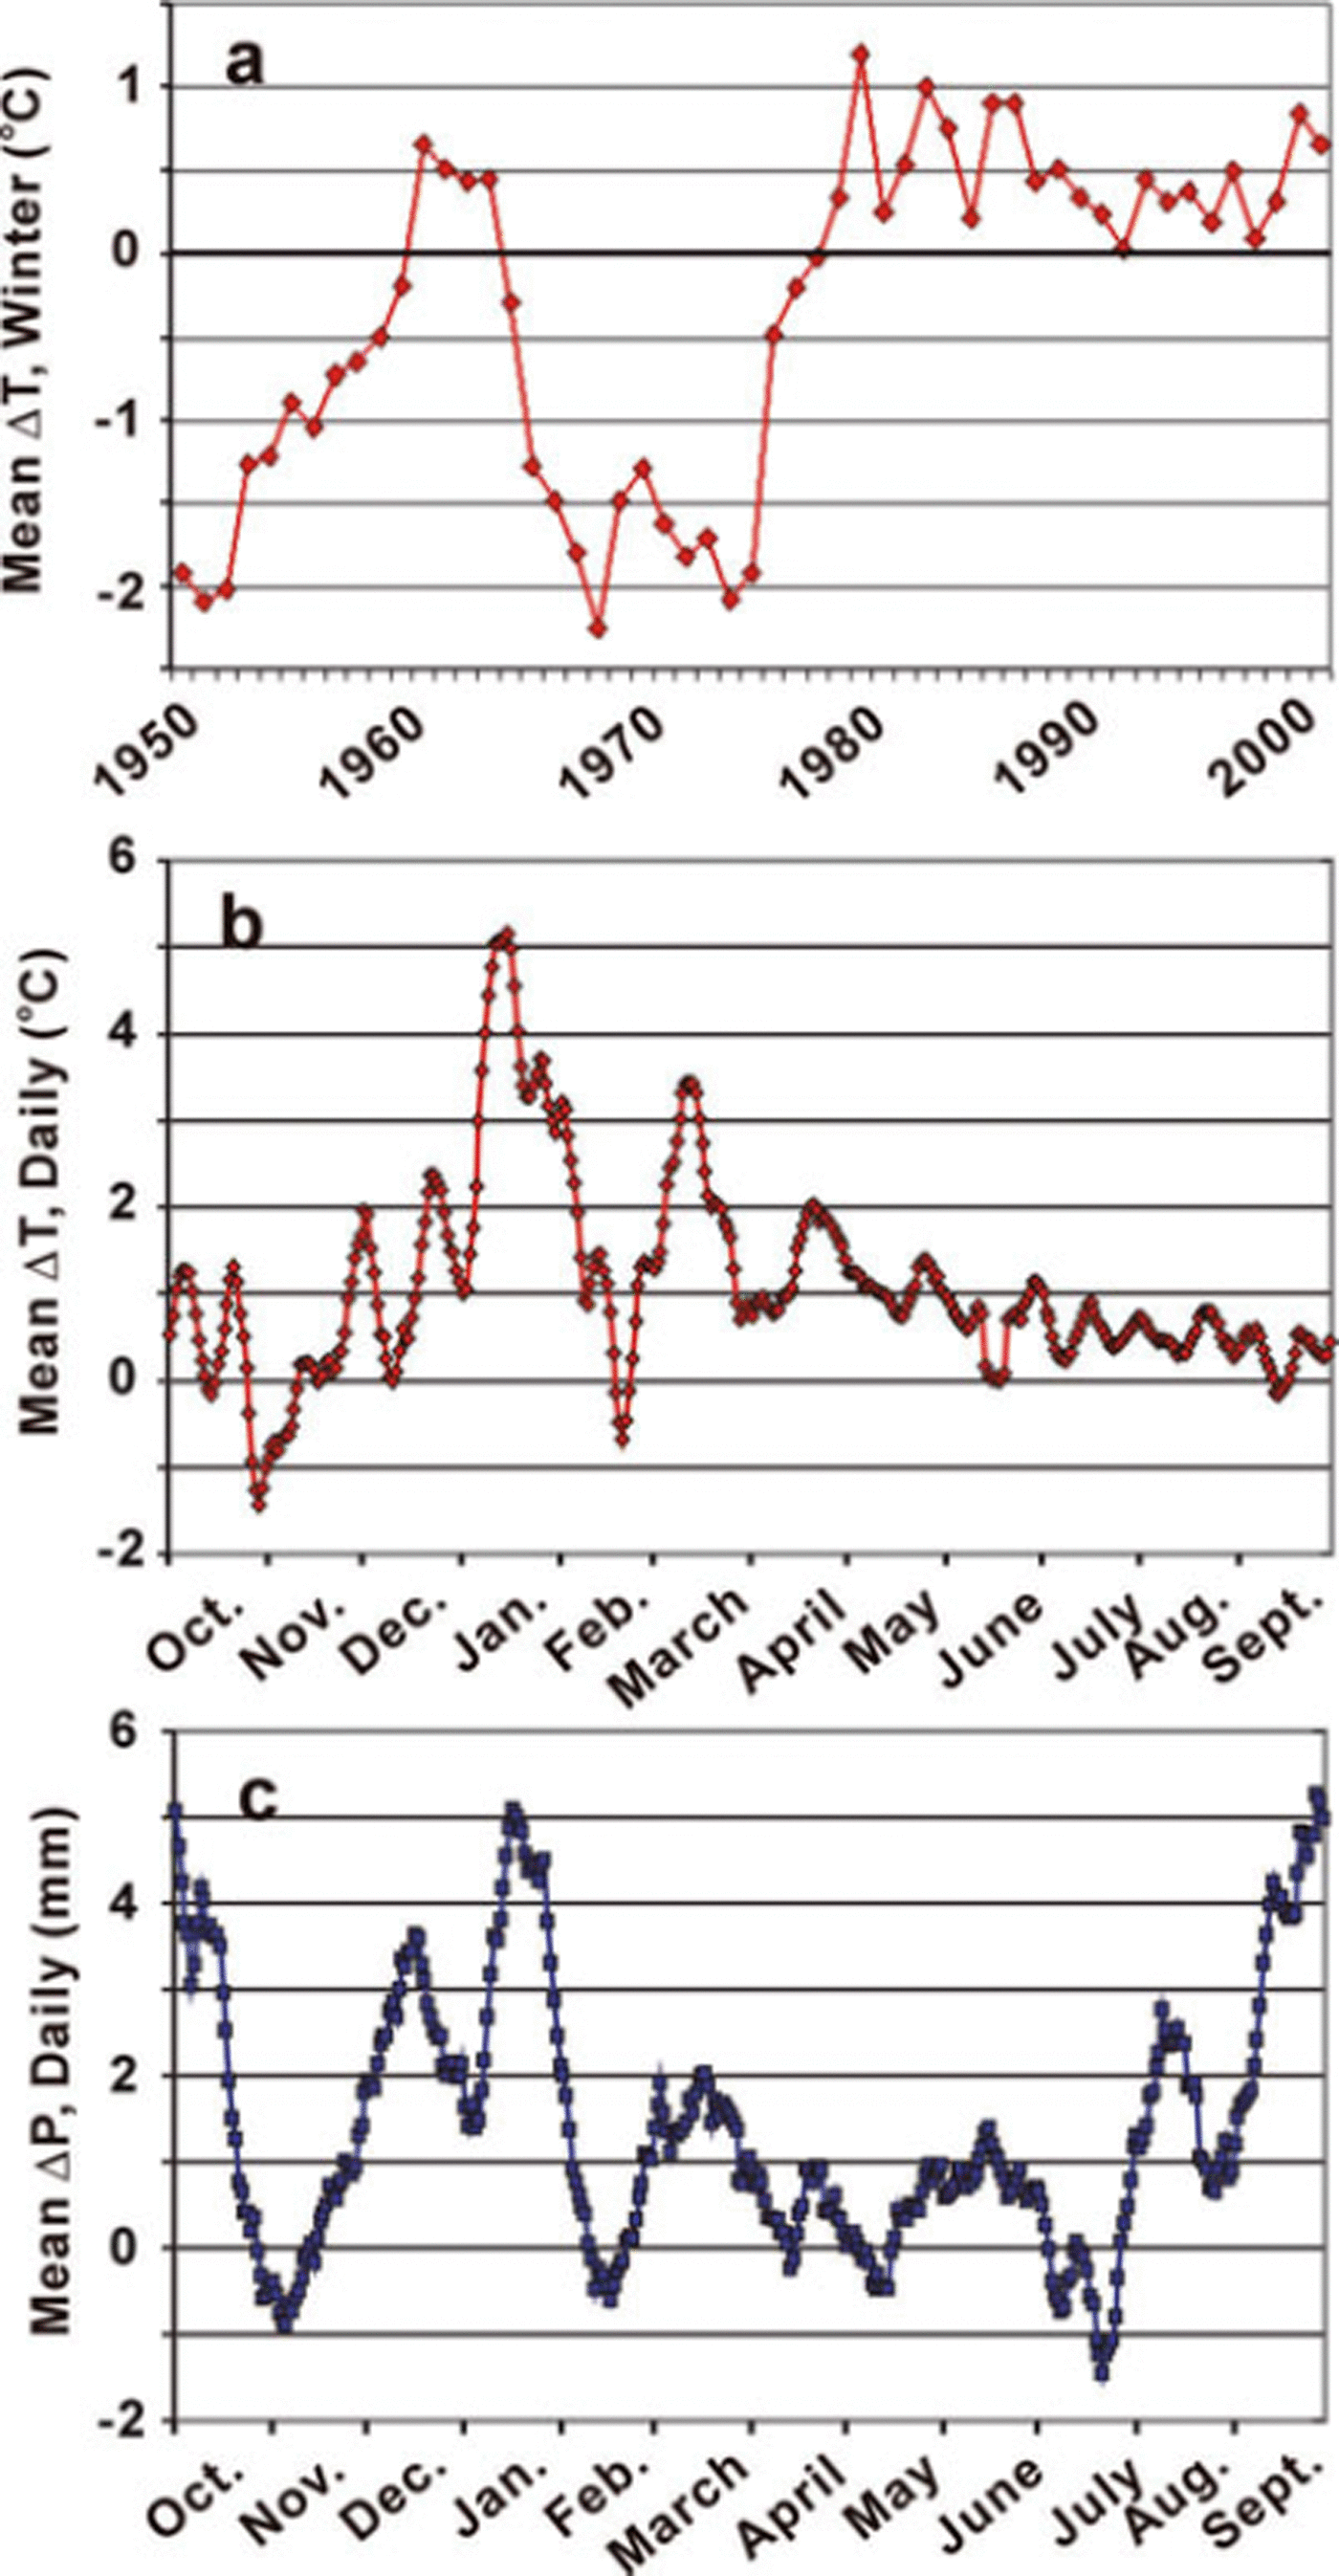
Daily readings from US National Weather Service stations Cordova and Yakutat show substantially increased coastal precipitation (rainfall) and temperatures since 1976/77 (Fig. 8). Winter mean temperatures have been above freezing since 1979 (Fig. 8a). The decadal trend since 1979 is nonlinear: lowering from 1979 to 1980 then rising after 1990. Overall, this indicates that the clean ice of the piedmont glaciers can continue melting through winter; a mechanism for increasing englacial water storage. The greatest increase in temperature has occurred in January (Fig. 8b), while maximum precipitation has occurred in January and in September to October (Fig. 8c) (Reference Muskett, Lingle, Tangborn and RabusMuskett and others, 2003). Since 2002, summer temperatures in Alaska continued making record-breaking highs (Reference Waple and LawrimoreWaple and Lawrimore, 2003; Reference Levinson and WapleLevinson and Waple, 2004; Reference LevinsonLevinson, 2005). The delayed surge of the eastern half of Seward Lobe, expected around 1970, did not occur until 1987/88. Agassiz Glacier, which was noted for pulsing, was observed surging in 2002 (Reference Lingle, Fatland, Voronina, Ahlnäs and TroshinaLingle and others, 1997). Increases in englacial water storage (a key in triggering surging) could be linked to the increases in precipitation since 1976/77 (Reference Hare and MantuaHare and Mantua, 2000; Reference Muskett, Lingle, Tangborn and RabusMuskett and others, 2003; Reference Hartmann and WendlerHartmann and Wendler, 2005; Reference MolniaMolnia, 2007). Extensive observations of the englacial–subglacial hydrologic system and surface velocity are needed.
Temperature and precipitation changes at US National Weather Service stations Cordova and Yakutat; daily readings from 1950 to 2001. (a) Winter (November to March) mean temperature changes. (b) Daily mean temperature changes (1976–2001 period minus 1950–75 period). (c) Daily mean precipitation changes (1976–2001 period minus 1950–75 period). Aversion of (a) and (c) appears in Reference Muskett, Lingle, Tangborn and RabusMuskett and others (2003).
The increased wastage of the Malaspina piedmont, the clean ice of the feeder glaciers and the folded debris-covered ice-cored moraines are very likely tied to increased late-summer and autumn temperatures (Reference Muskett, Lingle, Tangborn and RabusMuskett and others, 2003; Reference Levinson and WapleLevinson and Waple, 2004). The late-summer firn line, an indicator of the glacier equilibrium line, had an average elevation of 1000 m, as observed from 1948 to 1954 (Reference Plafker and MillerPlafker and Miller, 1958). In a NASA Terra MODIS image from September 2004, the firn line was visible near the Mount Irvine nunatak (∼1600 m a.s.l.) on Upper Seward Glacier, putting much of the glacier surface in a melting regime. Glacier basal motion is linked to inputs from diurnal–seasonal melt and englacial–subglacial water-storage increases (Reference Bartholomaus, Anderson and AndersonBartholomaus and others, 2008). We hypothesize that the increases in precipitation and temperature since 1976/77 may have set the stage for Agassiz, Lower Seward and Marvine glaciers, which share common local meteorological conditions, to surge near-concurrently (Reference Lingle and FatlandLingle and Fatland, 2003).
Interpretation of near-concurrent surges of the piedmont glaciers
The surges of the glaciers of the Malaspina piedmont, Agassiz, Lower Seward and Marvine glaciers, occurred in near-concurrence from 1999 to 2002. Observations show that the character of these surges is different for each glacier. The surge of Agassiz was much stronger than its usual pulsing. The surging of the western half of Seward Lobe appears less than the 1987/88 surge of the eastern half. The surge of Marvine Glacier appears similar to that of 1987/88.
The length of the surge cycle for each glacier is independent. To our knowledge, Agassiz Glacier in particular has not been observed surging prior to 1999; hence we cannot estimate the length of its surge cycle. The 1987/88 surge of the eastern half of Seward Lobe was delayed by about half of its prior estimated cycle of 30 years. Marvine Glacier is known for its frequent surges of up to a 10 year irregular cycle.
The observed near-concurrent surges of three independent glaciers suggest a common link. A study of Variegated Glacier, Alaska, suggests the length of the interval between surges is linked to a pre-surge balance level (Reference Eisen, Harrison and RaymondEisen and others, 2001). A study of Medvezhiy glacier, Tajikistan, also noted a critical mass-balance level at the initiation of surging (Reference RaymondRaymond, 1987). In another study of Variegated Glacier, W.V. Tangborn and R. Soemarmo (unpublished information) suggest that higher than normal water influx must also occur before initiation of surging. Reference Lingle and FatlandLingle and Fatland (2003) hypothesize that as the pre-surge thickness distribution determined by the mass balance increases, the water storage capacity also increases. In the winter season preceding surging, when the subglacial drainage system is constricted, the thickness distribution and mass balance must reach their pre-surge level. A necessary precondition to surging is for the englacial water storage to be high enough to overwhelm the subglacial drainage system, forcing pervasive failure of the subglacial till or alternatively widespread and rapid basal sliding. With these two conditions satisfied, a surge will probably occur (Reference Lingle and FatlandLingle and Fatland, 2003).
Moraine-folding hypothesis
A.S. Post (unpublished information) hypothesized that Malaspina Glacier’s folded medial moraines are formed by quasi-periodic surges alternating from southeast to south-southwest. The 3 year elevation changes are evidence of such a change in surge flow direction from 1999 to 2002, relative to the direction of the 1987/88 surge. A simplified cartoon illustrates the progression of moraine fold development by alternating surge direction on Seward Lobe (Fig. 9). Arrows indicate sequential surges: originating in the mouth of Lower Seward Glacier directed to the southwest (Fig. 9a), then on Seward Lobe directed to the southeast (Fig. 9b), and so on until the last surge of the sequence (Fig. 9e). The last panel (Fig. 9f) shows Seward Lobe from a NASA Terra MODIS image on 9 September 2004, with the digitized moraine fold-line (red) as in Figure 9e.
(a-e) Sequence of development of folded moraines on Seward Lobe by alternating surge directions (arrows). (f) A NASA Terra MODIS image acquired 9 September 2004 for reference. Malaspina Lakehas become completely turbid by this time.
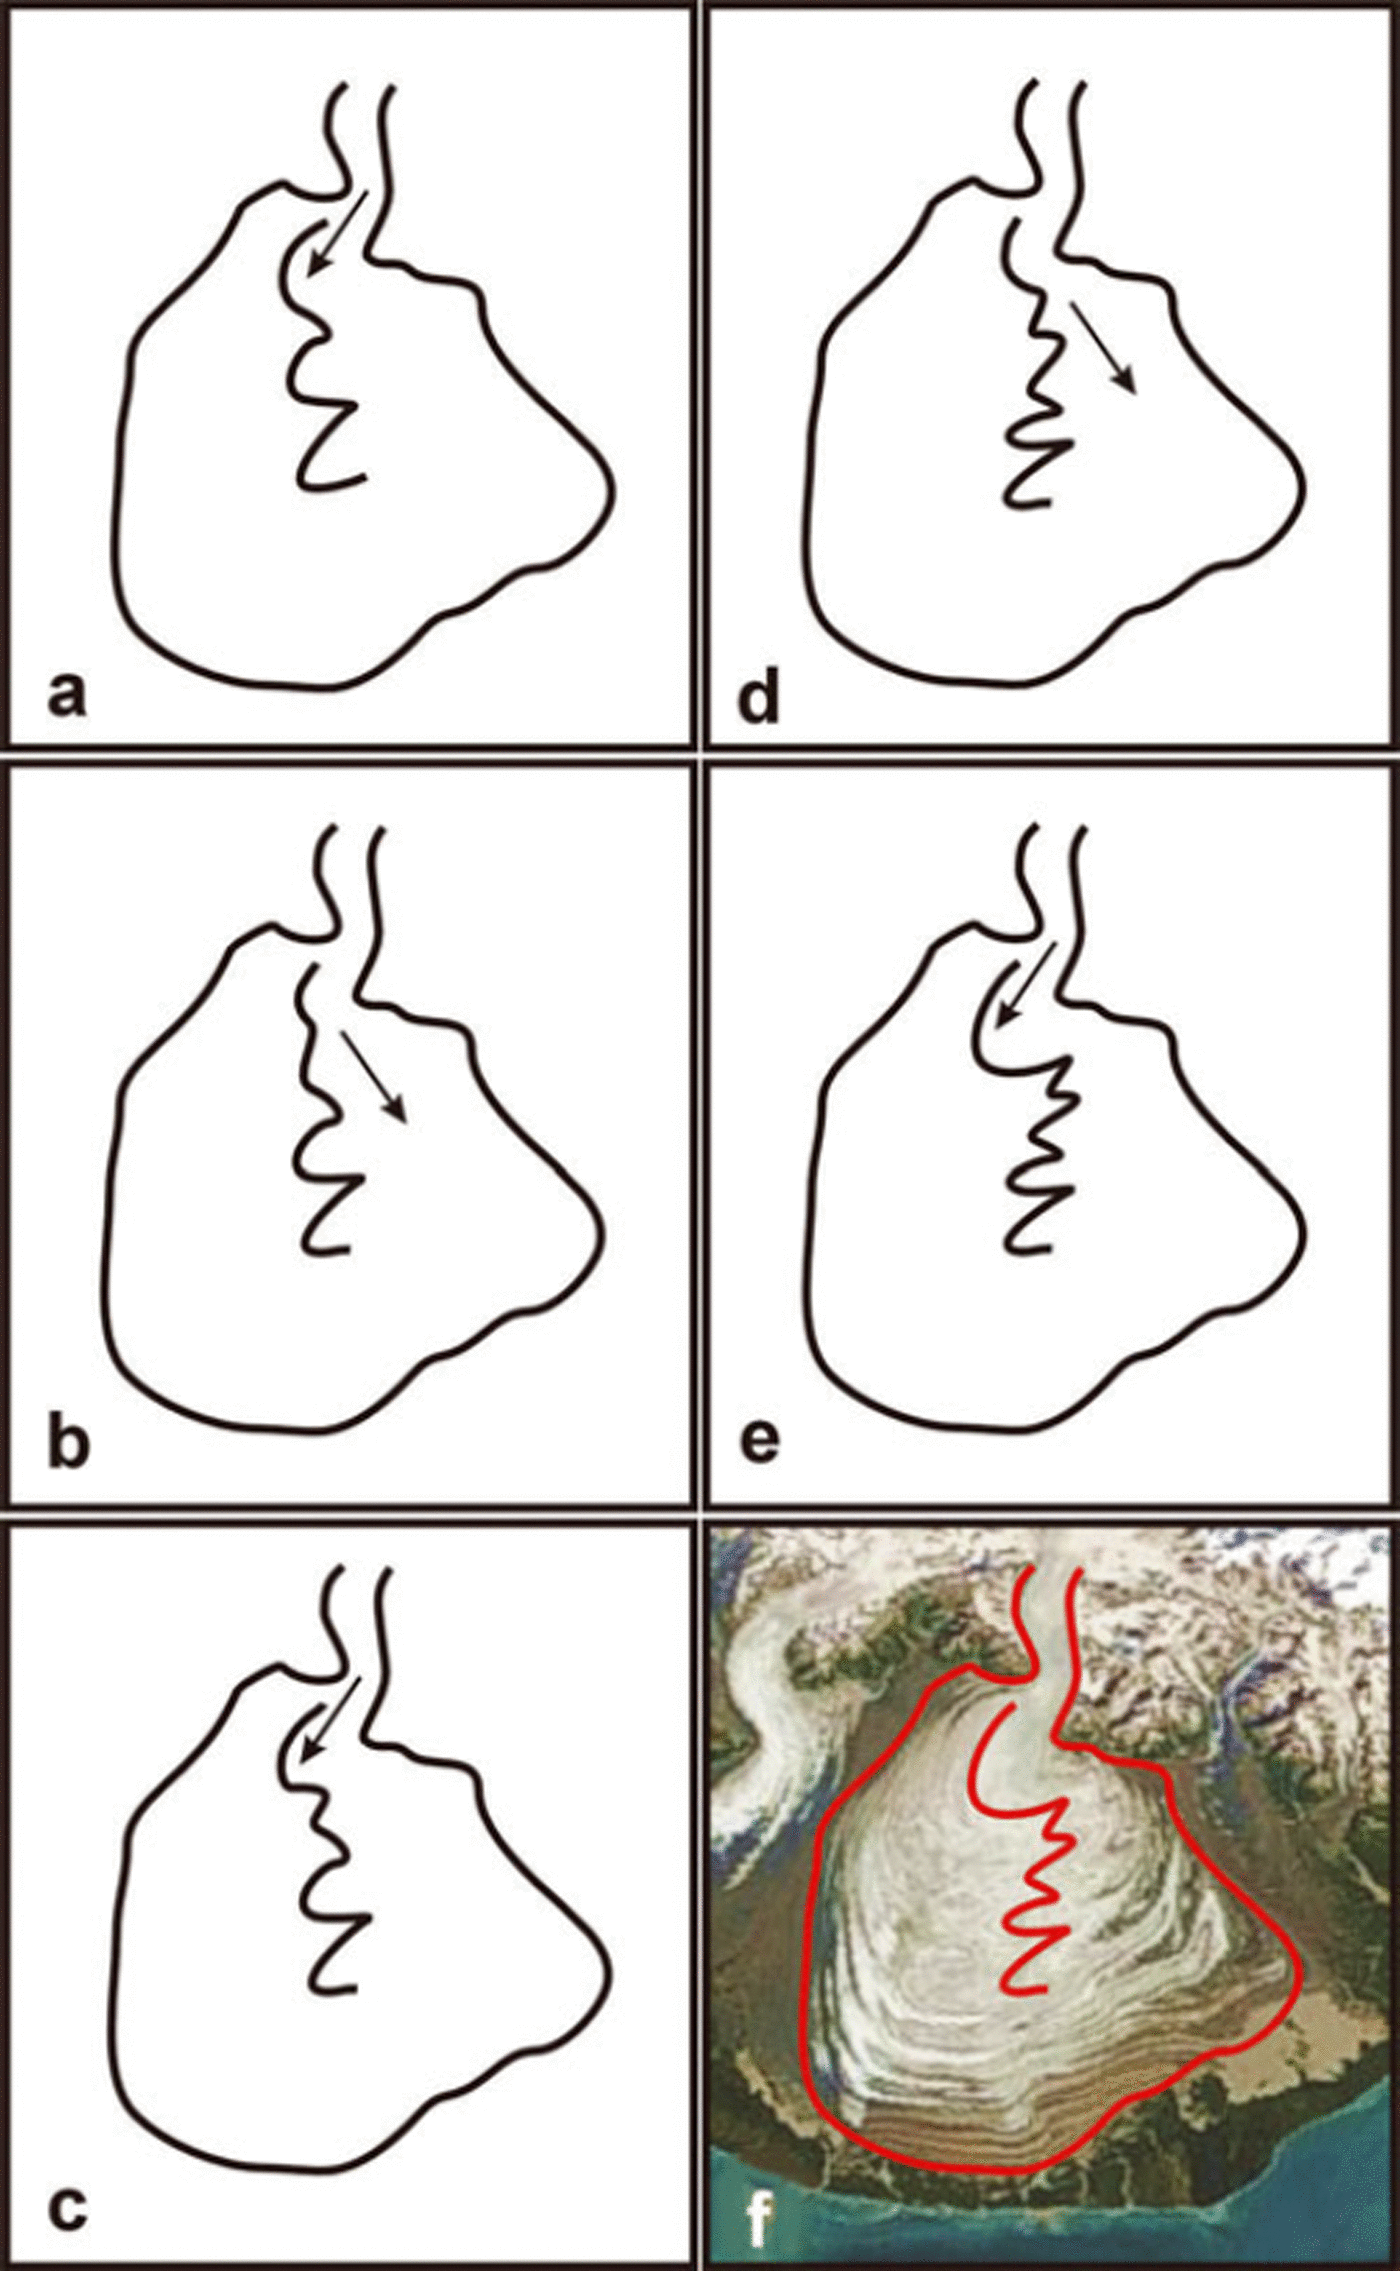
Our observations and supporting evidence do not permit unambiguous identification of the mechanism that causes surges to alternate in direction from southeast to south-southwest and back, but we suggest it is related to relative changes in surface slope. Suppose, for instance, a surge towards the southeast has occurred, as in 1987/88. The post-surge surface slope would have been reduced in that direction. The post-surge surface slope towards the south-southwest would also have been reduced, due to surge drawdown of Upper Malaspina Glacier, but less so due to absence of surge-induced thickening down-glacier in that direction. Given renewed elevation reduction in the mouth of Seward Glacier, where the surges originate, Malaspina Glacier would then have been primed for a new surge towards the south-southwest, before it was primed in the southeast direction. Given the mass balance appears to govern the length of the time interval between surges (Reference Eisen, Harrison and RaymondEisen and others, 2001), and increased englacial water storage appears to trigger surge onset (Reference Lingle and FatlandLingle and Fatland, 2003), the next surge would tend to have been towards the south-southwest, as from 1999 to 2002. By the same argument the next surge will tend to be towards the southeast. The result is formation of the spectacularly folded moraines that characterize both sides of the surface of Malaspina Glacier.
Conclusions
Near-concurrent surges, from 1999 to 2002, of Agassiz, Lower Seward and Marvine glaciers of the Malaspina Glacier system are indicated by the spatial distribution of surface-elevation changes in this period, which followed surface-elevation changes from 1972 to 1999. Upper Seward Glacier, which experienced a drawdown from the 1999–2002 surge of Lower Seward Glacier, has modestly recovered during 2003–06, but overall surface lowering has been retained (so far). On a same-area basis, the piedmont glaciers and moraines have accelerated in their area-average rate of surface lowering by 30% from 1999 to 2002, relative to rates of lowering from 1972 to 1999. The acceleration of surface lowering on Seward Lobe appears ongoing through 2006. Surface-elevation lowering on Agassiz Glacier has also increased during this period. Overall, from 1972 to 2002 the Malaspina Glacier system lost 156 ± 19 km3 over an area of 3661 km2, ∼73% of the area of this glacier system.
We suggest that the mechanism causing successive surges of Seward Lobe to alternate in direction is surge-induced changes in surface slope, which determine the direction of each subsequent surge because the flow of the broad Malaspina piedmont is not confined between valley walls. For instance, a surge towards the southeast, as in 1987/88, would leave a post-surge reduced surface slope in that direction, accompanied by a relatively higher surface slope towards the south-southwest. Seward Lobe would thus have been primed for its next surge towards the south-southwest, as observed here from 1999 to 2002, before being primed for another surge towards the southeast.
We hypothesize that the near-concurrent surges of these seemingly independent glaciers (Agassiz, Lower Seward and Marvine) share a common link. The increase in coastal rainfall after 1976/77 may have served to increase englacial water storage to a critical level, and with increase in snow accumulation after metamorphism to glacier ice to build glacier thickness, the two necessary preconditions for surging were satisfied. As pointed out in the hypothesis of Reference Lingle and FatlandLingle and Fatland (2003) (also Reference Fatland and LingleFatland and Lingle, 2002), increase in englacial water storage is the key element which triggers surge onset, when glacier thickness has reached a pre-surge level.
Acknowledgements
We thank the US National Science Foundation, Office of Polar Programs, Arctic Natural Sciences for supporting grant ARC-0612537; the NASA Cryospheric Sciences Program for supporting grants NAG5-9901 and NAG5-11336; the Interdisciplinary Science (IDS) in the NASA Earth Science Enterprise for support with grant NNG04GH64G; the NASA Scientific Data Purchase Program for funding the acquisition and processing by Intermap Technologies, Inc., of the Bagley Ice Valley and Malaspina Glacier system DEMs; the engineers and technicians of Intermap Technologies, Inc., for their excellent work; the Deutsches Zentrum für Luft- und Raumfahrt’s S. Dech, A. Roth and W. Knoepfle for processing that generated the SRTM X-band DEM of southern Alaska and Yukon; and NASA’s Ice, Cloud and Land Elevation Satellite (ICESat) Project and the US National Snow and Ice Data Center for providing ICESat data. K. Engle (Geophysical Institute) and T. Logan (Alaska Region Supercomputing Center (ARSC)) are thanked for technical assistance during an early phase of this work. ARSC and the Japan Aerospace Exploration Agency are thanked for computing facility support. Preliminary space-borne measurements of the velocity field on Malaspina Glacier (Reference Lingle, Fatland, Voronina, Ahlnäs and TroshinaLingle and others, 1997) was supported by a grant to C.S.L. from the US Department of Interior, National Park Service, National Natural Landmark Program, Cooperative Agreement CA 97005-9022, 1995 to 1997. Support for J. Sauber was provided by NASA’s Earth Surface Interior Program. We thank B.F. Molnia (US Geological Survey) for discussions on the Malaspina Glacier system.



