Nomenclature
- X
-
Input data set
- x
-
Input data
- M
-
Set of neurons
- m
-
Network neuron
- W
-
Set of weights
- w
-
Weight
- BMU
-
Best matching unit
- d
-
Unit distance
-
 $\alpha $
-
Learning factor
- h
-
Neighbourhood function
-
${r_b},{r_j}$
-
Node coordinates
-
$\delta $
-
Width – neighbourhood function


1.0 Introduction
Current trends in digital signal processing suggest a growing role in utilising and extracting information from unprecedented volumes of data. While the large-scale data sets can be perceived as a significant value source, big complications also arise with them. As with all commercial airliners, the operational data is monitored under various phases or regimes, making analytics often a challenging task. These phases or regimes can be difficult to identify and analyse as they may not conform to a normal distribution or follow a predictable pattern. However, cluster analysis is a useful tool for analysing such data in distinct groups, particularly for monitored data exhibiting different phases or regimes over time. Furthermore, unsupervised clustering does not require ground truth while classifying the data, so there is no need for an expert to attribute sample labels. Avoiding such a costly and time-consuming task has particular advantages in making algorithm automatisation easier. Notwithstanding the fact that the clustering has been addressed in many contexts with a broad appeal and efficacy in exploratory data analysis, it is a combinatorially challenging task, and disparity in contexts has made the adaptation of concepts slow to occur [Reference Goblet, Fala and Marais1]. In flight operations, the data monitoring tends to involve multiple signals measured by sensors present on the aircraft, and identifying phases of these data can help in understanding the safety events which may result in a potentially hazardous state [Reference Jain, Murty and Flynn2]. Considering the fact that many clustering methods are proposed in the literature, they can be used for the categorisation of the flight phases by assigning data together with common properties and separating the dissimilar ones in other phases. Thus, clustering can play an important role in tracking similar behaviours, discovering hidden structures, and detecting patterns during a flight [Reference Faure, Olteanu, Bardet and Lacaille3].
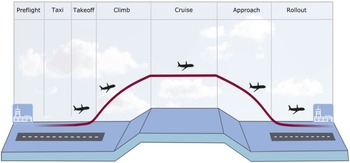
Even though commercial operations generally involve well-defined flight phases (see Fig. 1), there will always be missions with hard-to-identify phases which make it difficult to define a distinct stage and flight patterns [Reference Jain, Murty and Flynn2]. Moreover, there is a crucial need in the visual inspection of data in these phases to have an intuition of the underlying structures [Reference Wittek, Gao, Lim and Zhao4]. These data often lie in a high-dimensional space, and it is required to reduce the number of dimensions to a lower degree. In this context, this study addresses the need by offering an automated flight identification system and comprehensive map visualisation.
Flight phases.

The remainder of this paper is structured as follows: it first reviews the extant literature relevant to unsupervised clustering and flight phases. Then, the research procedures and data analysis are presented in the methodology section. This is followed by testing of the method and findings of the research inquiry. The paper concludes with a discussion of implications and further work.
2.0 Background and related work
Efforts to improve safety have drawn attention to flight data monitoring – the routine data collection and analysis implemented in commercial operations [Reference Gavrilovski, Jimenez, Mavris, Rao, Shin, Hwang and Marais5]. A large amount of flight data is generated each day and it is impossible for human experts to manually review all the recorded data [Reference Oehling and Barry6]. Instead, the literature has witnessed various research undertaken on the use of data mining and machine learning techniques to analyse flight data efficiently to provide information for corrective measures. Specifically, these flight data analyses can compare various flight parameters and identify new or unknown patterns, thus improving flight safety and operations while reducing fuel consumption, maintenance and insurance costs [Reference Jasra, Gauci, Muscat, Valentino, Zammit-Mangion and Camilleri7].
Flight phases and their identification can help in analysing flight data, which might hint at valuable information. Chati and Balakrishnan [Reference Chati and Balakrishnan8] dealt with this subject and studied the variation of engine performance parameters using flight data with the altitude profile in all flight phases. With an alternative goal, Li et al. [Reference Li, Gariel, Hansman and Palacios9] presented a method evaluating flight data and detecting anomalies without requiring the predefined thresholds of particular parameters. Their work used cluster analysis to classify flight data patterns and identify those that differ from the majority of the flight parameters.
The approach of cluster-based anomaly detection was extended by a further method that can help domain experts to find anomalies and associated risks [Reference Li, Das, John Hansman, Palacios and Srivastava10]. However, transient flight phases can reveal much more information than safety, and clustering can help to discover hidden structures as well as frequent or rare flight sequences. To that end, Faure et al. [Reference Faure, Olteanu, Bardet and Lacaille3] provided an unsupervised network method – self-organizing maps (SOM) – that can extract both transient and stabilised phases of flight signals. While SOMs have been in existence for a while, their usage in the particular scenario of visualising flight regimes is truly innovative. By employing SOMs in this context, significant advantages can be gained. These include the ability to pinpoint regions for enhancing flight plans and facilitating better analysis by categorising data into more similar flight phase states. A similar work using the same method applied an automatic cluster to aircraft engine transient data phases and validate the results with expert knowledge [Reference Bardet, Faure, Lacaille and Olteanu11].
A massively parallel tool for SOM training on large data sets (such as the flight parameters) was introduced by Wittek and Gao [Reference Wittek and Gao12]. The library, called Somoclu, provides an advanced visual inspection that can provide an intuition of the underlying structures. Therefore, this can contribute to clustering the flight data in accordance with the flight phases. Also, there is a promising line of research with massively parallel architectures and simplification of the workload distribution. These points are of central interest as this research focuses on representations of flight signal features and abstractions. Essentially, this paper responds to the call for a novel visualisation of the flight phases and aims to allow further signal processing methods to discern new behaviours on the flight clusters never observed so far.
3.0 Methodology
SOM signifies an automatic data-analysis method in the unsupervised-learning category of artificial neural networks (ANN) [Reference Kohonen13]. Its main objective is to transform complex, nonlinear statistical relationships between an incoming signal pattern of arbitrary dimension into simple geometric relationships on a low-dimensional mapping in a topologically ordered fashion [Reference Kohonen14]. This information compression while preserving the most significant primary data relationships on the display can also be considered to provide abstractions [Reference Kohonen, Oja, Simula, Visa and Kangas15].
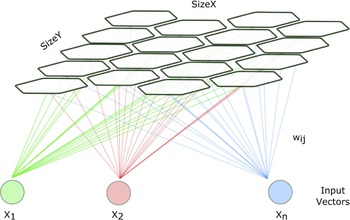
SOM configuration used in this paper consists of a finite two-dimensional regular nodes grid. Nodes are associated with a weight vector – a position in the input space – and while they stay fixed in the map space, training involves moving weight vectors toward the initial input data. These are illustrated in Fig. 2 where each node is assigned a weight vector with the same dimensionality.
A simple Kohonen network, self-organising map.

The SOM algorithm during training forms a nonlinear topology preserving the input data mapping onto a set of neurons in the network [Reference Wittek, Gao, Lim and Zhao4, Reference Kohonen16, Reference Wittek17]. The input data set with the start (
 ${t_0}$
) and the end (
 ${t_f}$
) of the current training session is expressed as:
 \begin{align}X = \left\{ {x\!\left( t \right)|t \in \left\{ {{t_o}, \ldots ,{t_f}} \right\}} \right\}\end{align}
while the set of neurons is:
 \begin{align}M = \left\{ {{m_1}, \ldots ,{m_k}} \right\}\end{align}
The network neurons here
 $\left\{ {{m_1}, \ldots ,{m_k}} \right\}$
are arranged in a grid, with the corresponding weight vectors [Reference Wittek, Gao, Lim and Zhao4].
 \begin{align}W = \left\{ {{w_1}\!\left( t \right)\!, \ldots ,{w_k}\!\left( t \right)} \right\}\end{align}
An input is then compared with the weight vector of each node by computing the distance (
 $d$
). Data paints are mapped to their best matching (
 $BMU$
) unit, which signifies the node whose weight vector is most similar to the input.
 \begin{align}BMU\!\left( {x\!\left( t \right)} \right) = {n_b} \in M\end{align}
and the distance of the unit is the lowest.
 \begin{align}d\!\left( {x\!\left( t \right),{w_b}\!\left( t \right)} \right) \le d\!\left( {x\!\left( t \right)\!,{w_j}\!\left( t \right)} \right){\rm{\;\;\;\;\;\;\;\;}}\forall {w_j}\!\left( t \right) \in W,\end{align}
The nodes are organised on a two-dimensional map, and each has two coordinates in a grid. The weights of the
 $BMU$
and nodes close to it in the grid are adjusted towards the input vector. The magnitude of the change declines with iterations and with the distance of the grid from the
 $BMU$
. The formula for the adjustment towards the input pattern is:
 \begin{align}{w_j}\!\left( {t + 1} \right) = {w_j}\!\left( t \right) + \alpha {h_{{b_j}}}\!\left( t \right)\!\left( {x\!\left( t \right) - {w_j}\!\left( t \right)} \right)\end{align}
where the learning factor (
 $\alpha $
) is between
 $0 \lt \alpha \lt 1$
and the neighbourhood function (
 ${h_{{b_j}}}\!\left( t \right)$
) gives the distance between the neurons in different iterations.
 ${h_{{b_j}}}\!\left( t \right)$
reduces for nodes away from the
 $BMU$
in the grid. A Gaussian function like the following one is frequently used to describe the neighbourhood function.
 \begin{align}{h_{{b_j}}} = exp\!\left( {{{ - \left|\left|{r_b} - {r_j}\right|\right|} \over {\delta\! \left( t \right)}}} \right),\end{align}
The coordinates of the nodes are given by “
 ${r_b}$
” and “
 ${r_j}$
” and the width by “
 $\delta\! \left( t \right),$
” which reduces through the iterations.
During an epoch, the network is trained with all the data for one cycle. After each epoch, the neighbourhood function decreases and the training stops when the map stops changing. A batch formulation to update the weights in SOM is generally used in parallel implementations [Reference Wittek, Gao, Lim and Zhao4].
 \begin{align}{w_j}\!\left( {{t_f}} \right) = {{\mathop \sum \nolimits_{t{\rm{^{\prime}}} = {t_0}}^{{t_f}} {h_{{b_j}}}\!\left( {t{\rm{^{\prime}}}} \right)\! x\!\left( {t{\rm{^{\prime}}}} \right)} \over {\mathop \sum \nolimits_{t{\rm{^{\prime}}} = {t_0}}^{{t_f}} {h_{{b_j}}}\!\left( {t{\rm{^{\prime}}}} \right)}}\end{align}
4.0 Testing and results
4.1 Flight data
This study aims to thoroughly assess the technique across dynamic flight stages by employing the Sample Flight Data of NASA’s “The Discovery in Aeronautics Systems Health” (DASHlink) website [Reference Matthews18] – a platform for aeronautics and data mining researchers to collaborate. With this de-identified aggregate flight data source, it is possible to recognise and examine patterns and target resources, reduce operational risks, and also improve the overall safety in the airspace. While the actual data were recorded onboard a single type of regional airliner in commercial operations over a three-year period with detailed parameters of system performance, aircraft dynamics, and other engineering properties, the data source claims that records are not part of any Flight Operational Quality Assurance program, and there is no info that can be traced to a certain airline or manufacturer [Reference Matthews18].
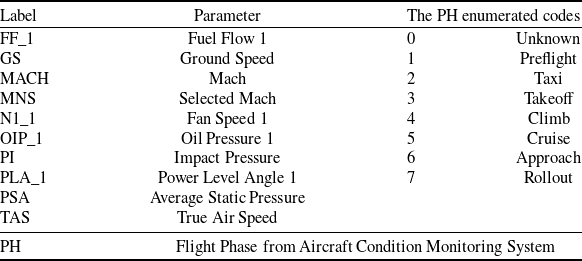
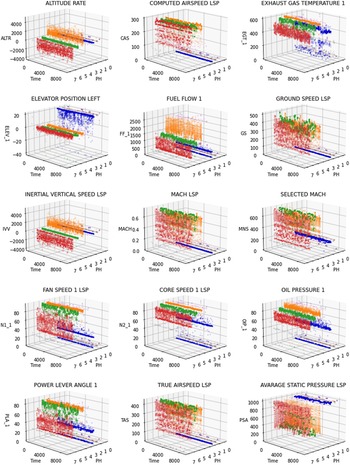
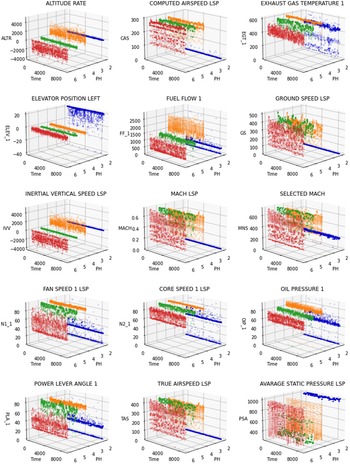
Table 1 is a list of flight parameters available in the NASA Sample Flight Data dataset. Even though the complete list of parameters is longer, only the ones here are used in this work for the sake of successful clustering. The flight phase from the aircraft condition monitoring system (PH) enumerated codes are also provided in the table. Figure 3 demonstrates plotting a 3D surface of the x-axis: flight phases, y-axis: time, and z-axis: flight parameters. Here, the figure shows how the parameters are located under different regimes (phases). Among these, the unknown time, preparation for flight (preflight), and time from the application of takeoff power to the altitude of the climb and rollout phase constitute a relatively lesser portion of the operations. The clustering method is tested using the subset Flight Data For Tail 687_1 of Sample Flight Data. Since the data size is large and the algorithm performance remains stable even with a smaller fraction, the data set is reduced by returning every hundredth data point of the top hundred data files of Tail 687_1. Figure 3 shows these flight parameters and their corresponding flight phases.
Selected flight parameters from NASA Sample Flight Dataset

Selected flight parameters in all flight phases.

The bulk of the flight data (96.7%) in Fig. 3 is the phases of Taxi: moving on the aerodrome surface to takeoff or after landing; Climb: time from the takeoff phase to a certain altitude above runway elevation or the first prescribed power reduction; Cruise: the period after a climb to a set altitude and before the descend; and finally Approach and Landing. In Fig. 4, the parameters in these major flight phases are shown, and they will be used to test the ability of the methodology to relate the clustering concept proposed in this work with what is in a real flight data scenario.
Flight parameters in selected flight phases.

With the primary purpose of visualisation, the SOM model is trained to form a large map qualifying as an emergent self-organising map for the selected data. To train and perform the analysis, the program uses the Somoclu software library written for the Python programming language for massively parallel implementation of SOM [Reference Wittek and Gao12]. In particular, it offers fast execution by parallelisation and high-level visualisation of maps. The training network configuration is as follows: the neighbourhood function is Gaussian, and the map type is planar. The number of columns and rows in the map are 200 and 320, respectively. The computational resources utilised were provided by Google Colab with local runtime. The training process was executed on a machine characterised by the following specifications: Linux system, x86_64 processor, the release of ’5.15.107+’ and version #1 SMP Sat Apr 29 09:15:28 UTC 2023. The duration of the training solely for the Somoclu model with reduced data amounted to approximately 1,226 seconds.
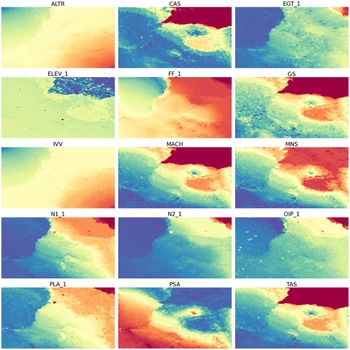
Figure 5 shows the component planes of data clusters in the Sample Flight Data. According to these output maps, there are some visually recognisable clusters with plain colours. The first obvious one is on the left of maps, especially on CAS, GS, MACH and TAS. Also, PSA component plane map has a strong cluster in the same region with blue colour. While there are certain drift indications in the rest of maps, some content-splitting tendencies can still be indicated. The second cluster can be seen on the right bottom corner of ALTR and FF_1 as the colourings assigned to these areas cluster nicely. The overall map results hint at an overlay of two remaining flight phase clusters in drift. However, the certain colour shifts in N1_1 A and PLA_1 component planes cast a new light on the separation between these relatively similar groupings. The clusters on these maps are locally meaningful and can be considered consistent on a neighbourhood level only. Consequently, some meaningful colour groupings such as the left bottom in the maps of FF_1, N1_1, N2_1, OIP_1 AND PLA_1 might stand for a sub-cluster of a flight phase or mostly inactive content. Overall from the results in Fig. 5, it is clear that there is more or less turbulence in all maps.
Component planes.

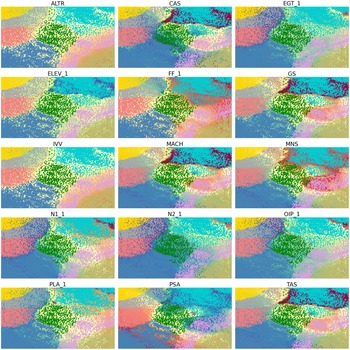
In Fig. 6, the component planes are plotted together with the best matching units for each data point. Below each map, the units are colour-coded with the flight-phase classes of the data points. Depending on the flight phase (PH) readings of Sample Flight Data, the corresponding elements of selected flight parameters are chosen and returned with the phase colour.
Maps showing flight parameter patterns with data points coloured according to the SOM clusters.

The results of the SOM cluster analysis showed that there were eight distinct clusters that emerged from the flight data. These clusters contained flight regimes that were characterised by the parameters; therefore, they were likely influenced by the aircraft’s various flight dynamics. The identified clusters also correspond to the expected patterns of each phase and suggest that each flight parameter plays a role in determining the potential flight regimes experienced by the aircraft.
Overall, these results suggest that the cluster analysis was successful in grouping flight regimes into distinct clusters based on the input data. Despite the tensions suggested by the results presented in Fig. 5, the colour-coded labels in Fig. 6 represent the clusters that have shown the highest level of success. This means that the point stacks within these clusters can be easily identified and distinguished.
The discussion section of this article is used to interpret and contextualise the results of the study, and to discuss the implications of those results in flight settings. In such a case, it would be crucial to address the importance of reducing flight regimes in order to better match the PH parameter that was provided by the data set. There are multiple reasons why it would be beneficial to regroup these regimes into four corresponding flight phases, as it helps in reducing clusters in this particular context. First, the PH parameter is a measure of the variability of an aircraft’s flight regimes. By reducing the number of clusters, it would be possible to closely analyse the clusters with PH parameters to the specific conditions under which the aircraft is operating. This could result in an improved understanding of the aircraft under multiple operating conditions. With this information, flight plan optimisation can yield several advantages. Firstly, it enables a more in-depth comprehension of flight dynamics, facilitating precise modeling and analysis of flight data. Consequently, actionable plans for enhancing aircraft operations can be discerned. Secondly, processing flight data using the defined flight phases allows for the extraction of more significant insights. This process contributes to the development of comprehensive indicators that offer valuable information across various courses of flight performance. These indicators encompass prognostics and health management, diagnostics, estimation of remaining useful life, efficiency, time management and operational costs. Leveraging these indicators empowers airlines and aviation stakeholders to optimise their flight plans, thereby augmenting efficiency and minimising environmental impact.
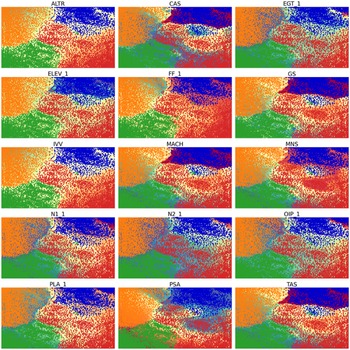
In Fig. 7 with the data points given with corresponding flight phase colours, the content can be mapped and visually depicted to allow areas of regime clusters to be readily identified. For instance, the flight phases of taxi (blue) and climb (orange) are grouped well with observable margins referring to their difference from the surrounding clusters. However, this is not as consistent as with what has been found in the flight phases of cruise (green) and landing (red).
Maps showing flight parameter patterns with reduced SOM clusters.

The most plausible explanation is that while these are two separate flight phases, the transition from cruise to approach is mostly smooth so that there is no strong track between the middle parts of these clusters in Fig. 7. It can be clearly observed that there is a continuous flow with little deviation from the expected trajectory. This lack of strong track between the middle parts of these clusters suggests that the transition itself can be considered a transition regime, characterised by a relatively stable and uniform progression. In other words, the movement from cruise to approach is not marked by significant disruptions or deviations as like in other flight phases, but rather a smooth and consistent shift. This stability is likely due to the consistency of flight operational conditions. Overall, the transition here can be seen as a smooth and well-controlled process, rather than one marked by significant variations or disruptions.
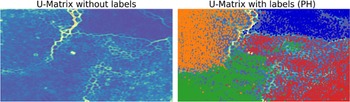
Also, it is worth emphasising that the SOM maps reward the stability of flight data in a phase, versus others changing over time. These can be further observed from the unified distance matrix (U-matrix) in Fig. 8. The purpose here is to provide a better visual representation of the network topology. The U-matrix is a representation of a SOM and it depicts the average Euclidean distance between neurons in the input data dimension space. Assuming
 $N\!\left( j \right)$
is the neighbours of a neuron
 $j$
, the height of the unified distance matrix is as:
 \begin{align} U\!\left( j \right) = {1 \over {\left| {N\!\left( j \right)} \right|}}\mathop \sum \limits_{i \in N\left( j \right)} d\!\left( {{w_i},{w_j}} \right)\end{align}
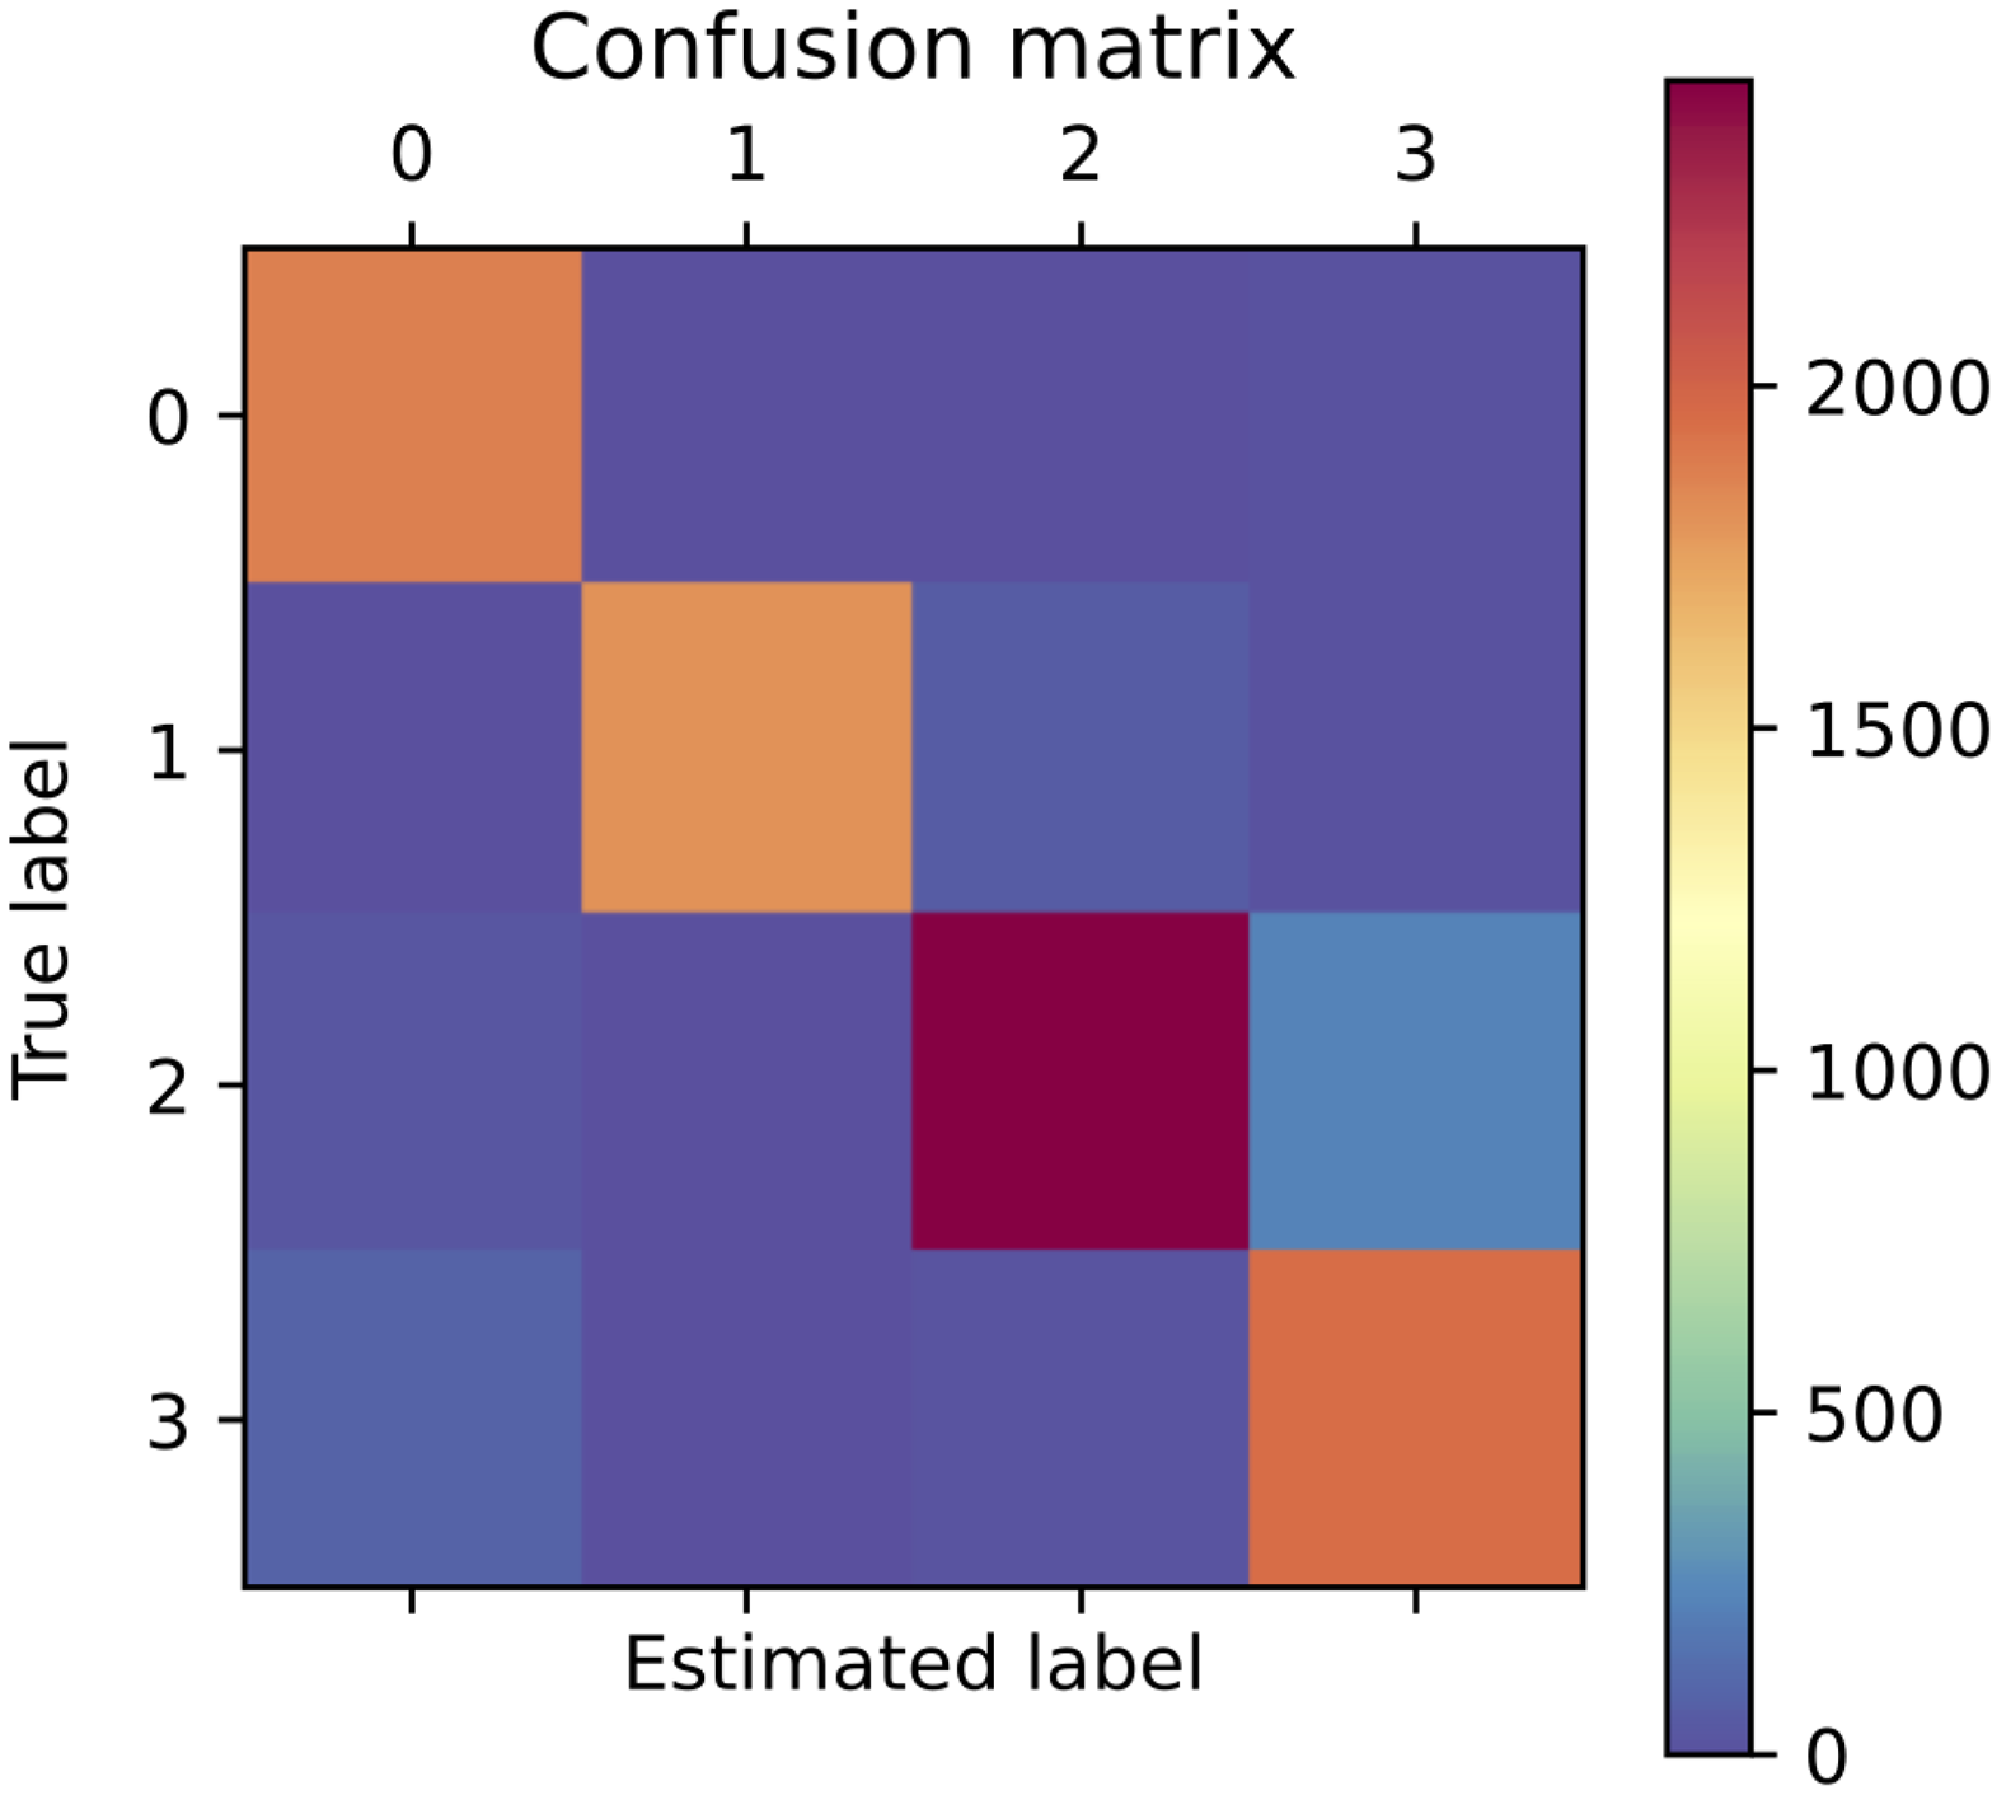
Confusion matrix for the results of the SOM algorithm

PH/Cluster options are as follows: 0:Taxi; 1:Climb; 2:Cruise; 3:Approach.
U-Matrix with BMU for each data point.

Besides some minor clustering errors and outliers in Fig. 8, the SOMs tend to emphasise the common features of the flight parameters and bring them together. These results found clear support for the method’s ability to provide meaningful groups or collections in flight data. This is specifically important when trying to learn about the flight features and organise the data.
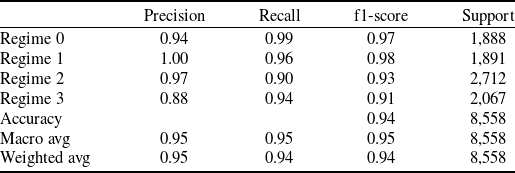
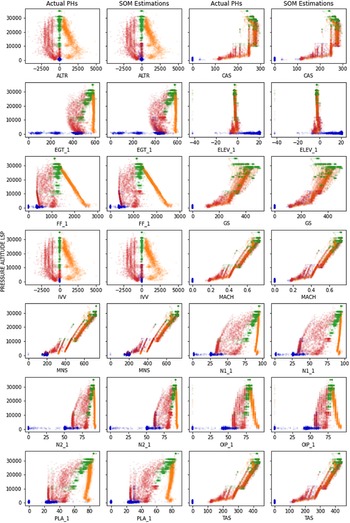
Additionally, Fig. 10 provides further results on how the actual PHs and the SOM estimations align on two-dimensional plots where y axes are one-dimensional arrays of pressure altitude (LSP). These plots show the clustering accuracy of the proposed method. The summary of prediction results is given in Table 2 and also illustrated by Fig. 9. The number of both correct and incorrect estimations is given by the count values and broken down by each cluster. Each row of the matrix represents a PHs class, while each column is the instances in a predicted cluster. It is important to note that the existing actual flight phase (PHs) labels are not exclusively relied upon as the definitive ground truth in this approach. Rather, they are considered a useful indicator for comparison and validation of the model, particularly in relation to the selected sensors that are believed to have a correlation with the actual flight phase clusters.
Classification report for the results of the SOM algorithm

PH/Cluster options = 0:Taxi; 1:Climb; 2:Cruise; 3:Approach.
Confusion Matrix Plot for model performance – PH/cluster options are as follows: 0:Taxi; 1:Climb; 2:Cruise; 3:Approach.

Comparison of clusters by pressure altitude LSP.

To evaluate the performance of the SOM cluster with the original PHs, a confusion matrix is introduced in Table 2 and also in Fig. 9. It summarises the number of correct and incorrect predictions made by the SOM. In this context, the rows represent the actual PHs and the columns represent the predicted regimes by SOM. The cells of the matrix contain the number of instances that fall into each combination of actual flight phases and predicted clusters. In this sample, the classification matrix is being used to show the similarities between the actual flight phases and the SOM algorithm predictions. It is important to note that the confusion matrix is typically used for classification tasks, where the goal is to evaluate the performance of predictions. In this context, the classification matrix is used solely for comparing the predicted flight regimes with the actual PHs, without involving actual classification. This comparison aims to highlight the similarities between the two clusters. PHs labels are not treated as the exclusive priori truth; rather, they serve as valuable indicators for validation, especially in relation to the selected sensors that are believed to correlate with the actual flight phase clusters.
Given predicted regimes and true PHs, Table 3 displays several evaluation metrics for each cluster in the model, as well as the macro average (of the unweighted mean per metric) and weighted average (of the support-weighted mean per metric). The high level of accuracy indicates that the model was able to accurately cluster the data into the regimes to correct phases. In general, the results provide a balanced assessment of the model’s performance.
The evaluation results, depicted in Table 2 and further visualised in Fig. 9, highlight a comparatively lower performance in Regime 3. This outcome is consistent with the observations made from the Confusion Matrix presented in Table 3. It is noteworthy that the performance in Regime 3 may reflect a transitional phase of the flight, necessitating careful attention to detail. Consequently, this regime may not exhibit typical characteristics associated with the phase states under consideration. Overall, the evaluation results offer a balanced and informative assessment of the model’s performance in classifying the data into distinct regimes. While the model demonstrates high accuracy in most cases, the specific challenges encountered in Regime 3 warrant further investigation and potential refinement to ensure accurate classification in all phases of the flight.
Through the iterative learning process, the SOM develops the capability to effectively classify and represent input data. This is accomplished by fine-tuning the parameters of its neurons, including their weights and positions, which play a pivotal role in shaping the SOM’s decision-making process. When analysing and comparing the shared states of these parameters in instances of accurate classification (specifically, matching the actual phase states) and misclassification (specifically, deviating from the actual phase states), the underlying factors used by the SOM to differentiate the phase state can be revealed.
By examining the consistent patterns manifested by the parameters in cases of accurate classification, it is possible to deduce the distinctive features that contribute to the precise identification of phase states. Conversely, scrutinising the disparate states of the parameters when misclassification or deviation from the actual phase states can shed light on the factors that lead to erroneous determinations. This comparative analysis of parameter states, in conjunction with classification outcomes, provides valuable insights into the decision-making mechanism of the SOM and facilitates a deeper comprehension of its classification capabilities.
Furthermore, this can enable to identify of the critical attributes or their combinations that are influential in determining the phase state. By discerning these influential parameters, it is possible to refine the SOM’s learning process and potentially enhance its classification accuracy. Exploring the states of the parameters is an essential aspect of understanding the functionality of the SOM and its capability to effectively capture and represent intricate patterns in complex data. It is crucial to emphasise that the points labeled as “misclassified” in the aforementioned analysis can be more accurately described as transitions or clusters that represent various flight phases or states. These points signify instances where the algorithm identifies a change or shift between different phases or states throughout the course of the flight. Instead of categorising these points as clear misclassifications, it is noteworthy to acknowledge them as meaningful signals of the ever-changing characteristics of flight data. The presence of these points at the boundaries between different states implies that the algorithm may exhibit uncertainty in accurately classifying them due to the intricate and fluctuating nature of flight conditions.
Understanding these transitions and regime clusters becomes particularly significant when further research, additional flight data processing, analysis or modeling is required. By separating and treating these colourings and transitions as distinct entities, it is possible to gain deeper insights and interpret the outcomes to formulate actionable plans.
Figure 10 supports the previous result by showing the graphs of pressure altitude versus the flight parameters on scatter plots. The estimated flight regimes and actual PH clusters are represented by different colours on the graph, with each colour corresponding to a particular flight regime or PH cluster. The plots could allow to visualise the relationship between pressure altitude and the flight parameter and to see how the values of these variables change and gather over the clusters. It also allows to compare the estimated flight regimes and actual PH clusters to one another and to see the minor discrepancies and overlapping cluster patterns in the data.
5.0 Conclusion
This study investigated the clustering of the flight parameters and their potential groupings at different flight phases, which might provide valuable information for flight data analytics and data-driven decisions. By analysing various flight parameters, the self-organising map was able to accurately group similar data points together, allowing for a better understanding of the patterns and behaviours of the flight. One potential application of this clustering analysis is in the optimisation of flight operations. By identifying common patterns in flight data, it may be possible to develop more efficient flight plans or to offer opportunities for flight data analysis that can automate analytical model building. Moreover, the ability to group flight data points by operational regimes can allow for a more detailed analysis of the specific challenges and requirements of each flight phase, which could inform the development of target-oriented solutions for these phases. This can also provide insight into the relationships between parameters and help identify potential issues that may occur during different phases of flight.
The study also validated that mapping from a higher-dimensional flight data space to a lower-dimensional one can provide a classification by the smallest distance metric so that the segmentation can group the data according to their flight phases. The results reveal a significant relationship between the cluster outputs and the given flight phases, indicating that the SOM network appears to have classified the flight into distinct flight phase groups. Nevertheless, there are relatively uncertain transitions between the cruise and approach phases along with some outliers and clustering errors. Enhancing the results can be achieved by applying the proposed approach to additional flight data processing, analysis and modeling endeavours, thereby enabling the interpretation of outcomes for the formulation of actionable plans. This subsequent investigation holds the potential to establish a more comprehensive set of flight data parameters, which can furnish more substantial and meaningful information. Acknowledging the need for additional research and analysis is imperative to authenticate and fortify the outcomes derived from the proposed approach. Expanding the scope of the proposed method to encompass larger datasets and conducting meticulous data processing, analysis and modeling activities will engender a more profound comprehension of flight dynamics. Additionally, this comprehensive investigation will facilitate the development of concrete plans that can be executed to optimise flight operations.