

INTRODUCTION
Many nonprofit human service organizations have a distinct mission to serve disadvantaged groups and the neighborhoods in which they reside (Hasenfeld Reference Hasenfeld and Hasenfeld2010a). Nonetheless, when they locate themselves in racially and ethnically segregated neighborhoods, are they subject to the same forces that lead to disinvestments in such neighborhoods? Do they face a greater risk of disbanding as a consequence of their spatial location? Despite increased scholarly interest in the disbanding of nonprofit or community-based organizations (Dougherty et al., Reference Dougherty, Maier and Lugt2008; Fernandez Reference Fernandez2008; Hager et al., Reference Hager, Galaskiewicz and Larson1996; Hager et al., Reference Hager, Galaskiewicz, Bielefeld and Pins2004; Hung and Ong, Reference Hung and Ong2012; Minkoff Reference Minkoff1993; Singh et al., Reference Singh, Tucker and House1986; Walker and McCarthy, Reference Walker and McCarthy2010), these questions have yet to be explored.
An expanding body of research on the relationship between ethnoracial hierarchies and neighborhood inequality suggests that residential segregation deprives minority neighborhoods of economic, social, and political resources (Lewis et al., Reference Lewis, Krysan, Collins, Edwards, Ward, Krysan and Lewis2004; Massey and Denton, Reference Massey and Denton1993; Quillian Reference Quillian2012; Smelser et al., Reference Smelser, Wilson and Mitchell2001), and privileges Whites over other groups (Bobo Reference Bobo, Krysan and Lewis2004; Bonilla-Silva Reference Bonilla-Silva2001; Feagin Reference Feagin2010; Marable Reference Marable, Krysan and Lewis2004). As a result, urban neighborhoods of color experience a dearth of institutional resources, including parks, libraries, social services, and commercial establishments (Briggs Reference Briggs2005; Small and McDermott, Reference Small and McDermott2006; Wilson Reference Wilson1987; Wolch et al., Reference Wolch, Wilson and Fehrenbach2005). Such scarcity has detrimental consequences for quality of life and social mobility (Charles Reference Charles2003; Crane Reference Crane1991; Cutler and Glaeser, Reference Cutler and Glaeser1997; Krivo et al., Reference Krivo, Peterson and Kuhl2009; Massey and Denton, Reference Massey and Denton1993; Massey and Fischer, Reference Massey and Fischer2000; Peterson and Krivo, Reference Peterson and Krivo2010; Shihadeh and Flynn, Reference Shihadeh and Flynn1996; Timberlake Reference Timberlake2002). At the same time, the existence of nonprofits in neighborhoods influences the ability of residents to access needed human services, and research suggests that their presence in racially segregated neighborhoods can help reduce the negative consequences of institutional discrimination (Peterson et al., Reference Peterson, Krivo and Harris2000; Yen and Kaplan, Reference Yen and Kaplan1999). It follows that understanding the impact of neighborhood racial and ethnic composition on nonprofit disbanding could provide insight into the mechanisms that create disparities in both neighborhood structural conditions and outcomes for residents.
The question of whether the racial and spatial landscape influences organizational disbanding has broad implications, as residential segregation by race and ethnicity still provides the basic geographic, economic, and social context in which people live. Although the United States is becoming more diverse, neighborhood segregation of Blacks and Latinos from Whites is pervasive in metropolitan areas (Holloway et al., Reference Holloway, Wright and Ellis2012), with an average non-Hispanic White person living in a neighborhood that is 75% White, an average Black person living in a neighborhood that is 45% Black, and an average Latino person living in a neighborhood that is 46% Latino (Logan and Stults, Reference Logan and Stults2011). While Black segregation relative to Whites has steadily declined over the last four decades, it still exceeds segregation of Whites from any other racial group (Parisi et al., Reference Parisi, Lichter and Taquino2011; Rugh and Massey, Reference Rugh and Massey2013).
How does the racial and ethnic composition of the neighborhood influence the odds of disbanding among nonprofit human service organizations? To address this knowledge gap, I combine scholarship from the sociological study of racial segregation with insights from the institutional perspective on organizations to develop an explanatory framework that is grounded in a structural view on organizational disbanding. I focus on the racial and ethnic isolation of Blacks, Latinos, and Whites at the neighborhood level, as measured by the percentage of the group in the census tract. An analysis of data from a panel study of nonprofit human service organizations in Los Angeles County that were surveyed in 2002 and 2011 supports the hypothesis that an increase in the percentage of Blacks and Latinos in the surveyed neighborhoods is positively related to organizational disbanding. By contrast, an increase in the percentage of Whites in the surveyed neighborhoods decreases the odds of organizational disbanding. The results suggest the salience of racial and ethnic stratification as an engine that drives the disbanding of nonprofit human service organizations in predominately Black and Latino neighborhoods. Results also highlight a potential mechanism—differential disbanding rates—that might help explain variation in the density of nonprofit human services across neighborhoods.
THEORY AND HYPOTHESES
For their survival, nonprofit human service organizations depend on institutional, political, and economic resources. When they are located in a neighborhood largely populated by racial and ethnic out-groups, their ability to mobilize these resources may be constrained because of discriminatory patterns that deprive the neighborhood of needed resources. Factors include social policies that disinvest in people of color, spatial isolation, and discriminatory allocation patterns at the local level that channel resources across neighborhoods. The cumulative effects of these forces may lead to greater disbanding of nonprofits located in racially and ethnically isolated neighborhoods.
Social Policies
The nonprofit sector has become the major provider of mandated human services (Salamon Reference Salamon and Salamon2003), and the social policies from which human service organizations obtain resources may discriminate against racial and ethnic out-groups by undersubscribing benefits to them. Racial and ethnic isolation concentrates the effects of these deprivations in spatially defined neighborhoods (Massey and Denton, Reference Massey and Denton1993). Thus when nonprofit human service organizations attempt to locate in and serve these neighborhoods, their ability to mobilize institutional, political, or economic resources may be challenged, because in serving disadvantaged groups who are the target of discriminatory social policies, they too face a scarce resource environment.
Sometimes these policies are explicitly racialized. Scholars have suggested that widely shared moral valuations of target client groups can influence the policymaking process (Schneider and Ingram, Reference Schneider and Ingram1993; Steensland Reference Steensland, Hitlin and Vaisey2010), resulting in policies that undersubscribe public benefits to groups that are constructed as morally devalued and oversubscribe benefits to highly valued groups. For example, research shows that policy features of redistributive social programs for poor people are less generous and more restrictive when the public believes that the target population is a racial minority (Fording Reference Fording, Schram, Soss and Fording2003; Howard Reference Howard1999; Radcliff and Saiz, Reference Radcliff and Saiz1995; Soss et al., Reference Soss, Schram, Vartanian and O’Brien2001).
Yet even social policies that do not explicitly target racial and ethnic out-groups for disinvestment may deprive minority neighborhoods of resources. For example, William J. Wilson (Reference Wilson2009) notes that the conservative fiscal policies of Ronald Reagan and George W. Bush, while they were not overtly racial, resulted in drastic cuts to federal aid for social programs on which poor and minority groups depend. These cuts had a greater impact in metropolitan areas whose populations had become predominately minority. Since nonprofit human services are highly dependent on public resources (Boris et al., Reference Boris, Leon, Roeger and Nikolova2010; Salamon Reference Salamon and Clotfelter1992), cuts in public aid may increase their risk of disbanding.
Spatial Isolation
As a form of structural racism, spatial isolation is thought to enable dominant groups to deprive out-groups of resources by strategically disinvesting in the neighborhoods in which they live (Alba and Logan, Reference Alba and Logan1993; Alba et al., Reference Alba, Logan and Stults2000; Kasarda Reference Kasarda1989; Logan et al., Reference Logan, Alba, McNulty and Fisher1996; Logan and Molotch, Reference Logan and Molotch1987; Massey and Denton, Reference Massey and Denton1993; Peterson and Krivo, Reference Peterson and Krivo2010; Sharkey Reference Sharkey2013; Squires and Kubrin, Reference Squires and Kubrin2005; Tilly Reference Tilly1998; Vélez Reference Vélez, Peterson, Krivo and Hagan2006). Racial and ethnic isolation influences discriminatory allocation patterns by: (1) increasing the salience of racial and ethnic categories, and (2) facilitating the disinvestment of out-groups.
First, the confluence of spatial borders and racial categories raises the salience of the boundaries between races by increasing the social distance between racial categories, or the awareness of difference or nearness experienced between categories on each side of the racial divide (Fox and Guglielmo, Reference Fox and Guglielmo2012; Lamont and Molnar Reference Lamont and Molnar2002; Tilly Reference Tilly1998). Research has demonstrated that greater racial isolation at the block or census tract level increases White hostility toward racial out-groups, presumably because it reduces direct inter-group contact which would challenge Whites’ negative stereotypes about out-groups (Baybeck Reference Baybeck2006; Oliver and Wong, Reference Oliver and Wong2003; Rocha and Espino, Reference Rocha and Espino2009). It may also lead to more prejudicial policy preferences (Kinder and Mendelberg, Reference Kinder and Mendelberg1995). Second, racial and ethnic isolation enables the disinvestment of out-groups by allowing dominant groups to channel resources away from the neighborhoods in which the out-groups reside (Massey Reference Massey2007; Wimmer Reference Wimmer2008).
Discriminatory Resource Allocation
The institutional perspective on organizations complements the model of structural racism and racial segregation by proposing that legitimacy is the key to organizational survival for highly institutionalized organizations such as nonprofit human services (DiMaggio and Powell, Reference DiMaggio and Powell1983; Meyer and Rowan, Reference Meyer and Rowan1977). It argues that the ability of the organization to mobilize resources and survive depends on the legitimacy it can garner from key institutional audiences, such as institutional funders and the general public (DiMaggio and Powell, Reference DiMaggio and Powell1983; Meyer and Rowan, Reference Meyer and Rowan1977). As defined by Suchman (Reference Suchman1995), legitimacy is “a generalized perception or assumption that the actions of an entity are desirable, proper, or appropriate within some socially constructed system of norms, values, beliefs, and definitions…” (p. 574). Location in neighborhoods heavily populated by out-groups may undermine organizational legitimacy with key institutional audiences, and as a result may compromise access to needed resources.
Some research suggests that public officials can be discriminatory in the spatial distribution of government benefits to nonprofit human service organizations that locate in neighborhoods of color. Eve Garrow (Reference Garrow2014) shows that greater neighborhood poverty increases the likelihood that nonprofit human service organizations will receive government funding. However, in neighborhoods with a high percentage of Black residents, greater poverty reduces the likelihood that the organization will receive government funding. Jennifer Wolch and colleagues (2005) find that human service organizations in minority neighborhoods have less access to government funding than organizations in White neighborhoods. In an analysis of Community Development Block Grant data in the San Francisco Bay area, Els De Graauw and colleagues (2013) show how government funding to nonprofit organizations that serve and represent immigrant groups depended on regional differences in how local government officials socially constructed those groups. They found that elected officials in suburban immigrant destinations were less likely than officials in the urban core to fund the organizations that served foreign-born residents, concluding that “a key obstacle for immigrants residing in municipalities outside traditional gateway cities is that they are not viewed as legitimate interlocutors and civic partners by city decision makers” (p. 117).
Widely shared attitudes about target groups also shape the giving patterns of institutional audiences such as the general public and corporations. Julian Wolpert (Reference Wolpert1993) demonstrated that higher rates of charitable donations were positively correlated with per capita income and with giving that was directed toward services used by the donors rather than toward more charitable social services that targeted out-groups and the poor. He concluded that residential segregation separated donor capacity from geographic centers of need, leading to highly regressive effects at the neighborhood level. And although no research has examined the relationship between residential segregation and corporate giving, evidence suggests that corporations may avoid controversial issues that might cause negative publicity and the loss of customers (Froelich Reference Froelich1999; Powell and Friedkin, Reference Powell, Friedkin and DiMaggio1986; Useem Reference Useem and Powell1987). It follows that they may be less likely to fund nonprofit human services that locate in devalued neighborhoods. The cumulative effects of these forms of disinvestment may deprive nonprofit human service organizations of key resources needed for survival.
The history of the “Weed and Seed” program in the Los Angeles area provides an example of how widely shared negative attitudes held by stakeholder groups about minority neighborhoods can divert critical organizational resources such as legitimacy and funding away from the nonprofit human services in the neighborhoods, even when the neighborhoods are targeted for support. The program, which was initiated by the Bush administration in response to the Los Angeles civil unrest of 1992, aimed to root out the criminal element in poor, minority neighborhoods affected by the riots (“weed”) and fund social services, which had been severely neglected (“seed”). When it became apparent that the criminal justice element would be prioritized over social service funding, local community groups, leaders, and the city council members representing the targeted areas argued that the implementation would be “both racist and repressive because the program would impose a warfare approach to the resolution of the pressing problems confronting the residents of the target communities” (Johnson et al., Reference Johnson, Farrell and Jackson1994, p. 22). The project was renamed, and control was handed over to local government with community input. Yet community leaders worried that funding patterns would continue to exacerbate existing disparities. According to James Johnson and colleagues (1994), local community leaders were still suspicious of the local city council that had not, in recent decades, “generated much assistance for the residents of the target communities. Instead, the power of the pocketbook...seemingly has dictated the allocation of resources in the city during this period” (p. 22).
Combining a structural view on race and the institutional perspective on organizations, I propose that the survival prospects of nonprofit human service organizations are influenced by a racial hierarchy that privileges organizations in White neighborhoods at the same time that it reinforces the disadvantaged status of organizations in neighborhoods occupied by racial and ethnic minorities (Bobo Reference Bobo, Krysan and Lewis2004; Bonilla-Silva Reference Bonilla-Silva2001; Feagin Reference Feagin2010; Marable Reference Marable, Krysan and Lewis2004). I examine the relationship between organizational disbanding and the percentage of Blacks, Latinos, and Whites—three of the most populous racial and ethnic groups in Los Angeles County—in the neighborhood.Footnote 2
Together, these groups comprised about 85% of the total population in the county in 2000.Footnote 3 In general, Whites are positioned at the top of the ethnoracial hierarchy. Blacks, who have experienced a unique history of oppression and discrimination in the U.S. context, are at the bottom, and Latinos fall somewhere in between (Bobo and Hutchings, Reference Bobo and Hutchings1996; Link and Oldendick, Reference Link and Oldendick1996). However, ethnoracial hierarchies vary across time and space (Gullickson Reference Gullickson2010; Wimmer Reference Wimmer2008), and may be different in Los Angeles County than in other areas.
Therefore, to determine the relative ethnoracial positioning of Blacks, Latinos, and Whites in Los Angeles County, I assess whether the nominal racial distinctions used by the census correspond to meaningful social differences in the lives of residents. In particular, I focus on ethnoracial differences in socioeconomic status, marginality (i.e., the extent to which groups are excluded from socioeconomic institutions and statuses that signify social inclusion), and political participation and representation (Soss and Bruch, Reference Soss and Bruch2008). A comparison along these dimensions suggests that in 2000, Whites in Los Angeles County were positioned at the top of the ethnoracial hierarchy, while the relative disadvantage of Blacks and Latinos varied across measures (results are available on request). For example, of the three groups, Whites had the highest median income, the lowest poverty rate (socioeconomic status), the lowest unemployment rate, and the highest educational attainment (marginality). Latinos fared better than Blacks on some indicators (median income, unemployment) and the same or worse on others (poverty rate, educational attainment) (U.S. Bureau of the Census 2000). Whites also appeared to have an advantage in terms of political participation. For example, Blacks and Whites registered to vote at greater rates than Latinos, while Whites turned out to vote at higher rates (50%) than Blacks and Latinos (40%) (Los Angeles Urban League and United Way of Greater Los Angeles 2005).
I expect that the ethnoracial hierarchy in Los Angeles County will be replicated in patterns of disbanding. Therefore, organizations that locate in predominately Black or Latino neighborhoods should experience an increased risk of disbanding. Conversely, organizations that locate in neighborhoods containing high percentages of Whites should experience a reduced risk of disbanding.
H1: The higher the percentage of Blacks in the neighborhood in which the organization is located, the greater the likelihood that the organization will disband.
H2: The higher the percentage of Latinos in the neighborhood in which the organization is located, the greater the likelihood that the organization will disband.
H3: The higher the percentage of Whites in the neighborhood in which the organization is located, the lower the likelihood that the organization will disband.
Taking a perspective that those ethnic communities with potentially homogenous interests could provide a cultural, social, and political foundation for the development of neighborhood human services (Iglehart and Becerra, Reference Iglehart and Becerra2011; Jenkins Reference Jenkins1988), an alternative hypothesis is that location in places with high levels of minority-group concentration lowers the risk of organizational disbanding. For example, in response to the systematic exclusion of Blacks from mainstream social services, a system of Progressive Era charity organizations arose to provide for social service needs and to promote racial equality in Black neighborhoods (Gordon Reference Gordon1991; Jackson Reference Jackson1978; O’Donnell Reference O’Donnell2001). Scholars have noted that the concentration of minorities can signal homogenous demand to which the nonprofit sector may respond with more services (Bielefeld et al., Reference Bielefeld, Murdoch and Waddell1997). Minority neighborhoods could also benefit from co-ethnic social networks, voting blocs and political coalitions that can translate service needs into resources (Barreto et al., Reference Barreto, Segura and Woods2004; Barreto et al., Reference Barreto, Villarreal and Woods2005).
DATA AND METHODS
I use data from a probability sample of 501(c)(3) nonprofit organizations in Los Angeles County that offer human services, defined as services to promote social and psychological well-being (Table 1A in the Appendix). Strictly medical or educational organizations were excluded from the sample.Footnote 4 The sampling frame was constructed from five sources: the Internal Revenue Service (IRS) list of registered organizations, the California Secretary of State registries, the database used by LA Infoline, the Rainbow Directory, and the California Office of Statewide Health Planning and Development. The use of multiple sources yielded a sampling frame that is more complete than what could have been achieved by relying on any one source. For example, small organizations are more likely to appear in databases such as the Rainbow Directory than in the IRS list, which, although it is typically used as a source for sampling frames for 501(c) (3) organizations, excludes smaller organizations which are not required to complete the IRS 990 tax forms.Footnote 5 Out of a final sampling frame of 6850 organizations, a random sample of 1334 was stratified by organizational revenues and location in the county to guarantee that all parts of the county were represented. A total of 707 interviews were completed. Fifty-two organizations were later removed because it was discovered that they did not fit the study criteria (they were churches or foundations, or did not have 501(c)(3) status), bringing the sample to 1282 and the number of interviews to 655 for an overall response rate of 51%.Footnote 6 One-hour telephone interviews were conducted with the CEOs of these organizations in the summer of 2002. Respondents were instructed to provide information for a service location. When organizations were a branch of a multi-site organization, data were collected only for the branch that corresponded to the service location that was reported.
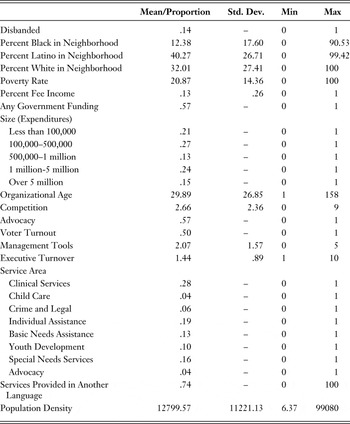
Means/Proportions, SD, Minimums, and Maximums for All Variables

Disbanding
In the spring of 2011, the study team followed up the organizations surveyed in 2002 to ascertain whether they were active or had disbanded. An organization was determined to have disbanded when a knowledgeable informant or other source (e.g., information obtained from the Internet) verified that the organization was no longer active. Ninety-three organizations fit this description. The outcome is a dichotomous variable that indicates whether the organization had disbanded as of the spring of 2011, coded 0 for organizations that were active and 1 for organizations that had disbanded.
Independent Variables
The unit of analysis for neighborhood-level variables is the census tract. Los Angeles County is multiethnic, and mixing is greater at the levels of zip codes, communities, and cities than in census tracts and blocks (Clark Reference Clark, Waldinger and Bozorgmehr1996). Therefore, using a unit of analysis larger than the census tract would mask much of the striking racial homogeneity at the neighborhood level. In addition, evidence suggests that service utilization is localized. Rebecca Kissane’s (Reference Kissane2010) ethnographic study of women living in a high-poverty neighborhood in Philadelphia demonstrates that geographic distance (sometimes even one mile was deemed too far to travel to obtain services) reduced service utilization outside of the local neighborhood. Quantitative analyses also demonstrate that service utilization is localized (Allard et al., Reference Allard, Tolman and Rosen2003) and deteriorates beyond a one-mile radius (Bielefeld et al., Reference Bielefeld, Murdoch and Waddell1997). Census tract location was ascertained by asking the respondent for the address of the organization’s service location in 2001.Footnote 7 Census variables are based on 2000 census data. Percent Black in the neighborhood is constructed from percent Black. Percent Latino in the neighborhood is constructed from percent Hispanic. Percent White in the neighborhood is constructed from percent White. Non-Hispanic data are used to prevent double-counting.
Control Variables
I control for alternative explanations of disbanding to factor out their effects. Organizational legitimacy enhances access to resources, which in turn promotes organizational survival (Aldrich and Auster, Reference Aldrich and Auster1986). Location in high-poverty neighborhoods can increase the legitimacy of nonprofit human service organizations by signaling that they have a commitment to improving the life conditions of the local residents. Government funders in particular may be more willing to fund nonprofits that locate in high-poverty neighborhoods because allocation rules for human services typically consider the degree of poverty in the organization’s location (Salamon Reference Salamon and Clotfelter1992). Conversely, some scholars have argued that greater poverty may result in insufficient local investment to support a vibrant sector, which could lower organizational life chances (Wilson Reference Wilson1987; Wolpert Reference Wolpert1993). The variable for poverty is measured by the poverty rate in the organization’s location based on 2000 census data on “people in poverty,” normalized by the number of people for whom they could ascertain poverty status. The poverty rate is measured as a continuous variable (0–100%).
Because residential segregation by race may concentrate the greater economic deprivation and other disadvantages found among minorities in spatially defined communities (Massey and Denton, Reference Massey and Denton1993), residents are constrained in their capacity to support local organizations through fee-for-service. Such constraint may increase the risk of disbanding. A variable for percent fee income is constructed from a response to an item that asks how much of the organization’s total revenue came from fees-for-service in the most recent fiscal year. Data collected from the organizations’ IRS 990 tax forms was used to replace missing data.
Endorsements of key institutional actors such as government funders are thought to enhance organizational survival by providing material resources and increasing the legitimacy of the organization (Baum and Oliver, Reference Baum and Oliver1991; Wiewel and Hunter, Reference Wiewel and Hunter1985). A variable for any government funding is constructed from a response to two items that ask how much of the organization’s revenue comes from government grants and contracts and how much comes from government reimbursements in the previous fiscal year. The sum of these two responses is used to create a dichotomous variable indicating receipt of any government funding in the most recent fiscal year, coded 0 for organizations that received no government funding and 1 for organizations that received any government funding. When available, I replace missing data with revenue data collected from the organizations’ IRS 990 tax forms.
Organizational ecologists point to smallness as an explanation for disbanding (Hannan and Freeman, Reference Hannan and Freeman1989). Larger organizations may be less likely to fail because their size signals success and they are therefore viewed as more legitimate than smaller organizations. Larger organizations may also have more slack resources and can more easily raise capital than smaller organizations (Aldrich and Auster, Reference Aldrich and Auster1986). Organizational size is measured as total expenditures during the preceding fiscal year. Respondents were asked to report the total expenditures of the organization. Expenditure data collected from the organizations’ IRS 990 tax forms were used to replace missing data. Because the data are skewed, I created five dummy variables for the following expenditure categories: (1) less than 100,000; (2) 100,000–500,000; (3) 500,000–1 million; (4) 1 million–5 million; and (5) over 5 million.
The “liability of newness” thesis (Hannan and Freeman, Reference Hannan and Freeman1989, p. 81) argues that young organizations lack the exchange relationships and legitimacy required to maximize survival chances and are thus more likely to fail than older, established organizations. The organization’s age is computed by subtracting the year of founding from 2002.
Many ecological studies on organizational populations validate the idea that greater competition for resources leads to an increased likelihood of organizational disbanding (Baum and Oliver, Reference Baum and Oliver1991; Hannan and Carroll, Reference Hannan and Carroll1992). In their study of hospitals, for example, Renee Hsia and colleagues (2011) found that location in a competitive market was positively related to closure. A competition variable is constructed from the following items—How much competition does your organization experience from other nonprofit organizations: a) getting financial resources?; b) recruiting staff?; and c) attracting clients? Responses to all competition questions are coded on a scale with 0 indicating ‘‘none,’’ 1 ‘‘some,’’ 2 ‘‘a fair amount,’’ and 3 ‘‘a great deal.’’ The results of a factor analysis warrant the inclusion of all three items in the scale (alpha 5 .72).Footnote 8 Values range from 0, indicating no competition from nonprofit organizations on all three dimensions, to 9, indicating ‘‘a great deal’’ of competition from nonprofit organizations on all three dimensions.
Advocacy can enhance the legitimacy of organizations and their worthiness of support in the eyes of policymakers and institutional funders, increasing survival chances. Nicole Marwell (Reference Marwell2004) showed how community-based organizations engage their local politicians to ensure continued fiscal support, and Eve Garrow (Reference Garrow2011, Reference Garrow2014) found that advocacy increases the likelihood that nonprofit human services will acquire government funding. Advocacy is a dichotomous variable, scored 0 for those who answer “no” to the question, “Is your organization actively involved in advocating or promoting certain policy issues, or the interests of a certain group or groups?,” and 1 for those who answer “yes” to this question.
Some research suggests that the distribution of organizational resources is influenced by the political influence of neighborhoods (Marwell Reference Marwell2004, Reference Marwell2007). Minority neighborhoods with strong political participation and influence may be able to obtain more organizational resources than politically disengaged neighborhoods. To test for this possibility, I include a measure of voter turnout at the census tract level. Voter turnout is the percentage of the population in the census tract that voted in the 2002 general election (Statewide Database 2002). Interaction terms are created by dichotomizing the variable at the median and multiplying it by the variables for the percentage of Blacks and the percentage of Latinos in the census tract to test the possibility that increased political participation in the census tract reduces the positive association between minority concentration and the risk of organizational disbanding.
The use of institutionalized management tools can enhance organizational legitimacy and increase survival prospects because they are interpreted as an indication of strong management and leadership (Brody Reference Brody2005). Martin Ruef and W. Scott (Reference Ruef and Scott1998) demonstrated that the use of highly institutionalized management practices improved the survival chances among a sample of hospitals. A scale for the use of management tools is constructed from the following five items—In the last three years, has your organization: a) undertaken a market analysis?; b) developed a strategic plan?; c) implemented a program evaluation system?; d) reorganized your administrative or management structure?; and e) implemented a new fiscal or cost control system? Responses are coded 1 for “yes” and 0 for “no” and are aggregated into a scale that ranges from 0 to 5 (alpha=5.65).
I also control for the effect of leadership stability and experience on the chances of disbanding by including a variable for executive turnover. The variable is constructed from a response to the question, “In the past three years how many different executive directors or CEOs has your organization had?”
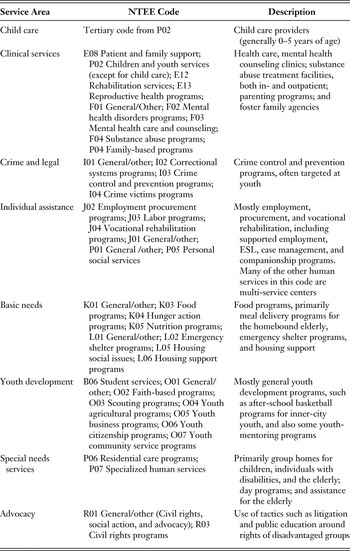
The matching of services to residents’ needs could enhance survival prospects by increasing the organization’s legitimacy and relevance within the community context. To control for service area, I include a series of dummy variables based on the National Taxonomy of Exempt Entities (NTEE) codes, as indicated by the National Center for Charitable Statistics on data compiled from the IRS Form 990. I collapsed the NTEE codes into the following service areas: child care clinical services, crime and legal services, individual assistance, youth development, basic needs services, special needs services, and advocacy (See Table 1A in the Appendix for full descriptions of the service areas). Because nonprofit human service organizations often operate in multiple service areas, the categories used in this analysis represent the organization’s service area that receives the greatest share of expense allocations.
Los Angeles County has experienced a considerable influx of immigrants (particularly Latinos) in recent decades (Clark Reference Clark, Waldinger and Bozorgmehr1996). Ecological theory suggests that organizations adapt their services to the attributes of local residents and may experience structural inertia when those attributes change, creating a mismatch between neighborhood needs or preferences and organizational services (Hannan and Freeman, Reference Hannan and Freeman1989). Organizations that respond to the needs of new populations—for example by providing services in multiple languages—should increase their legitimacy in the neighborhood and, in turn, their survival prospects. To control for this possibility, I include a dichotomous measure to the question, “Does your organization provide services in any language other than English?,” scored 0 for organizations that answer “no” and 1 for those who answer “yes” to the question.
Population density is a potential indicator of demand. Greater density in the organization’s location may translate to more demand for services and greater survival prospects. In addition, densely populated urban cores have longer histories of community development and organizational infrastructure from which nonprofits may benefit (De Graauw et al., Reference De Graauw, Gleeson and Bloemraad2013). The measure uses 2000 Census data to calculate the number of persons per square mile.
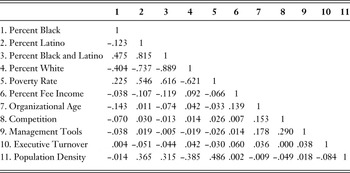
Descriptive statistics and pairwise correlations for all variables are shown in Tables 1 and 2. Table 1 indicates that about 14% of the organizations sampled in 2002 disbanded by 2011.
Pairwise Correlations for All Continuous Variables

Analytic Technique
I use logistic regression with survey estimation procedures to correct for stratification of the sample. The nested structure of the data (organizations within census tracts) is treated as ignorable.Footnote 9 Missing data range from 0% for the dependent variable to 14% for the fees variable, with an average percentage for the independent variables of 3.8% missing. Using the multivariate normal method, I imputed all variables with missing values, and included all of the variables in the dataset in the imputation model to maximize the amount of information available to estimate missing values. To impute the missing data, I created five multiple imputation datasets using STATA 12 for a sample size of 655.Footnote 10
RESULTS
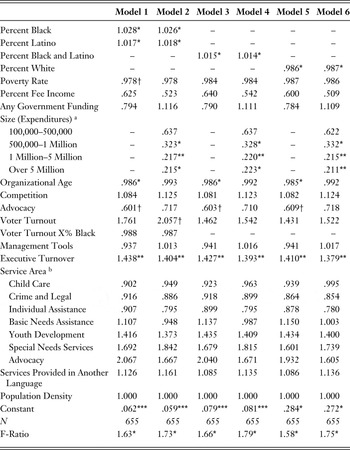
Table 3 presents the results from the logistic analysis of the relationship between predictor variables and disbanding. Because percent Black and percent Latino are both highly correlated with percent White, I model percent White separately. The mean variance inflation factors are between 2 and 3 for all models, indicating that multicollinearity is not a problem. The estimated coefficients are presented as odds ratios, which can be interpreted as the expected percent change in the odds of disbanding for a unit increase in the predictor variable, holding all covariates constant. Table 3, Model 1 includes the variables for percent Black and Latino in the neighborhood and all covariates except organizational size, which has been shown in studies to be negatively related to the disbanding of nonprofit organizations (Hager et al., Reference Hager, Galaskiewicz and Larson2004; Hung and Ong, Reference Hung and Ong2012; Walker and McCarthy, Reference Walker and McCarthy2010). The size variable is introduced in Model 2.
Logistic Regression of Organizational Disbanding, Nonprofit Human Service Organizations in Los Angeles County, 2002–2011

a The omitted category is “Less than 100,000.”
b The omitted category is “Clinical Services.”
† p<.1; *p<.05; **p<.01; ***p<.001
I expected a positive relationship between the percentage of Blacks in the neighborhood in which the organization is located and organizational disbanding (Hypothesis 1). The data presented in Model 2 provide support for this expectation. Net the effect of other variables in the model, a one-unit increase in the percentage of Blacks in the neighborhood results in a predicted 2.6% increase in the odds of disbanding. Also consistent with expectations, a one-unit increase in the percentage of Latinos in the neighborhood results in a predicted 1.8% increase in the odds of disbanding (Hypothesis 2). Additional analyses (available on request) that compute indirect effects using the product-of-coefficients approach indicate that organizational size mediates about 19% of the effect of percent Black in the neighborhood on organizational disbanding. Thus organizations in predominately Black neighborhoods may on average be smaller, which in turn increases their odds of disbanding. The association between percent Black and disbanding is not mediated by any of the remaining covariates, and no covariates mediate a substantive amount of the association between percent Latino and disbanding. A test for linear combinations of slope coefficients, calculated using the lincom command in STATA (not shown), indicates that the difference in the slopes for the percent Black and percent Latino variables is not statistically significant.
To further explore whether the percentage of Blacks and Latinos in the neighborhood influence one another, Models 3 and 4 replace the percent Black and percent Latino variables in Models 1 and 2 with a variable measuring the combined Black/Latino percentage. The measure is positively and significantly associated with disbanding and has an effect size similar to that of the variable for the percentage of Latinos in Model 2. Additional analyses, not shown, explore interaction effects between percent Black and percent Latino, which are not significant. I conclude that the effect of the percentage of Blacks and Latinos in the neighborhood are substantively similar and can be thought of as substituting for one another.
Given the advantaged position that Whites occupy in the racial hierarchy relative to Blacks and Latinos (Bobo Reference Bobo, Krysan and Lewis2004; Bonilla-Silva Reference Bonilla-Silva2001; Feagin Reference Feagin2010; Marable Reference Marable, Krysan and Lewis2004), I expected that an increase in the presence of Whites in the neighborhood would protect organizations from disbanding. Results in Models 5 and 6, which replace the percent Black and percent Latino variables in Models 1 and 2 with a variable for percent White, provide support for this hypothesis (Hypothesis 3). As shown in Model 6, the full model, a one-unit increase in the percentage of Whites in the neighborhood, is associated with a 1.3% decrease in the odds of organizational disbanding net the effect of all other variables in the model. Additional analyses (available on request) that compute indirect effects using the products-of-coefficients approach indicate that none of the covariates mediate the effect of percent White in the neighborhood on organizational disbanding. Analyses, not shown, test interaction effects between percent White and percent Black and between percent White and percent Latino, neither of which are statistically significant. Thus the analyses suggest that the percentage of Whites in the neighborhood has an independent association with disbanding which is not influenced by other variables.
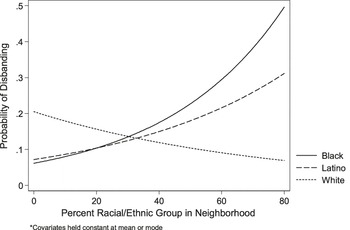
Figure 1 converts the odds ratios for the percentage of Blacks, Latinos, and Whites in the neighborhood to predicted probabilities. I estimate the parameter estimates for organizations with mean values for continuous covariates and modes for categorical covariates. When estimating the predicted probability of disbanding as a function of the percentage of Blacks in the neighborhood, I hold the percentage of Latinos constant at 20%, and when estimating the predicted probability of disbanding as a function of the percentage of Latinos in the neighborhood, I hold the percentage of Blacks constant at 20% (Model 2). As mentioned above, the overall rate of disbanding is around 14%. An increase in the percentage of the group from 0% to 80% raises the predicted probability of disbanding from 6% to 50% for Blacks and from 7% to 31% for Latinos. By contrast, raising the percentage of Whites in the neighborhood from 0% to 80% decreases the predicted probability of disbanding by about two-thirds—from 20.5% to 7% (Model 6).
Probability of Disbanding as a Function of the Racial Composition of the Neighborhood

Residential segregation by race often concentrates economic deprivation in minority neighborhoods (Massey and Denton, Reference Massey and Denton1993; Quillian Reference Quillian2012), lowering the availability of community resources to support the nonprofit sector. The poverty rate is negatively and significantly related to disbanding at the p < 0.1 alpha level in Model 1 but does not reach statistical significance in the remaining models. Additional tests for interaction effects between the poverty rate and the racial composition of the neighborhood (available on request) are not significant, suggesting that the poverty rate does not moderate the relationship between the racial composition of the neighborhood and the odds of disbanding. Reliance on fee income is also not related to disbanding. Thus it appears that organizational disbanding rate is unrelated to the availability of community resources to support the organization.
Receipt of any government funding, an indication of the legitimacy of an organization through its ties to public funders, is negatively and significantly related to disbanding at the p < 0.1 alpha level in a bivariate analysis (not shown) and reduces the odds of disbanding by around 31%. However, in the models shown, the coefficient for receipt of government funding is non-significant. Additional analyses (available on request) compute indirect effects using the products-of-coefficients approach. They provide evidence that organizational size (expenditures) is most strongly associated with government funding becoming non-significant in the models. Thus the analysis suggests that government funding assists organizations in becoming large, which in turn lowers their odds of disbanding.
Consistent with previous research, organizational disbanding rates decline with increased size (Baum and Oliver, Reference Baum and Oliver1991, Reference Baum and Oliver1992). Converting the odds ratios to probabilities and holding all other variables constant at their means or modes, Model 2 indicates that the predicted probability of disbanding ranges from around 19.4% for very small organizations (less than $100,000 in expenditures) to around 4.2% for very large organizations (over $5 million in expenditures). Increased age has the expected negative effect on disbanding; however, after controlling for organizational size in the full models, disbanding rates do not decline with age. This finding is consistent with ecological studies indicating that what appears to be a negative relationship between age and disbanding is a confounding of unmeasured organizational size (Baum and Oliver, Reference Baum and Oliver1991, Reference Baum and Oliver1992; Levinthal Reference Levinthal1991). Greater competition from other nonprofit organizations for resources is unrelated to disbanding.
Policy advocacy can enhance the legitimacy of organizations and their worthiness of support in the eyes of policymakers and institutional funders, increasing survival chances. The coefficient for advocacy, which is marginally significant (p < 0.1) and negatively related to disbanding in Models 1, 3, and 5, drops from significance in the full models that include the variable for organizational size. It appears that advocacy helps organizations grow by increasing their access to resources (Garrow Reference Garrow2011; Marwell Reference Marwell2004), which in turn reduces their likelihood of disbanding. Another measure of political participation, voter turnout at the neighborhood level, is not significantly related to disbanding in any of the models at the p < .05 alpha level. The interactions between voter turnout and the percentage of Blacks and Latinos in the neighborhood are also not significant, suggesting that greater political participation as measured by voter turnout does not shield organizations from the negative effects of race on organizational survival. The interaction between voter turnout and the percentages of Latinos in the neighborhood reduces the efficiency of the model without contributing to its explanatory power and is therefore excluded from the analysis. The variable for use of management tools is unrelated to disbanding, while leadership turnover is positively related to disbanding. The organization’s service area and its use of culturally competent services (as measured by the availability of services provided in languages other than English) are unrelated to disbanding, providing some evidence that disbanding has little to do with service type or the failure of organizations to tailor their services to local cultural conditions.
DISCUSSION
The evidence presented in this study shows that the racial and ethnic composition of the neighborhood is strongly associated with the disbanding rates of nonprofit human service organizations that locate in them. Consistent with the theoretical expectations, greater percentages of Blacks and Latinos in the neighborhood predicted higher disbanding rates and greater percentages of Whites predicted lower disbanding rates. Additional analyses suggest that the percentage of Blacks in the neighborhood may in part influence disbanding indirectly by decreasing organizational size, which in turn leads to higher rates of disbanding. This finding points to the role of neighborhood racial composition in attracting resources that enable organizational growth and, in turn, improved survival prospects.
The results support a structural view on race which suggests that the spatial configuration of racial inequality not only reinforces the disadvantaged position of minorities but also serves to reproduce the privileges experienced by Whites (Bobo Reference Bobo, Krysan and Lewis2004; Bonilla-Silva Reference Bonilla-Silva2001; Feagin Reference Feagin2010; Marable Reference Marable, Krysan and Lewis2004). In Los Angeles County, Blacks and Latinos are relatively disadvantaged when compared to Whites on a host of dimensions, including socioeconomic status, labor market participation, educational attainment, and political participation. These disparities map onto a racial hierarchy of place, in which nonprofit human service organizations in White neighborhoods are relatively advantaged when compared to organizations in Black and Latino neighborhoods, at least in terms of their survival prospects (Alba and Logan, Reference Alba and Logan1993; Alba et al., Reference Alba, Logan and Stults2000). The results are also consistent with the proposition, drawn from the institutional perspective on organizations, that location in neighborhoods that are heavily populated by out-groups may undermine organizational legitimacy—a key to survival for highly institutionalized organizations such as nonprofit human services (DiMaggio and Powell, Reference DiMaggio and Powell1983; Meyer and Rowan, Reference Meyer and Rowan1977).
Consistent with extant research, size—a common indicator of organizational legitimacy—emerged in the analysis as a robust predictor of organizational disbanding (Hager et al., Reference Hager, Galaskiewicz and Larson2004; Hung and Ong, Reference Hung and Ong2012; Walker and McCarthy, Reference Walker and McCarthy2010). Larger organizations have greater legitimacy, greater access to resources, and may also have more slack resources and can more easily raise capital than smaller organizations—features which protect organizations from disbanding (Aldrich and Auster, Reference Aldrich and Auster1986). Yet it is important to note that neighborhood racial composition was associated with disbanding independent of the effect of size, and in fact may yield more pronounced penalties on survival prospects than small size. For example, when holding covariates at their means and modes, the penalty for small size (less than $100,000 in expenditures) on the predicted probability of disbanding was severe in neighborhoods that are 80% Black and 20% Latino (Model 2) and barely consequential in neighborhoods that are 80% White (Model 6) (78% and 11.1%, respectively). In fact, organizations with expenditures exceeding 5 million that are located in neighborhoods that are 80% Black had a higher predicted probability of disbanding, at 16.8%, than organizations with expenditures under $100,000 that are located in neighborhoods that are 80% White, at 11.1%.
Other forms of legitimacy, controlled for in the analysis, appeared to either influence disbanding indirectly by impacting organizational size or to have no effect. Receipt of government funding, which is thought to raise the legitimacy of organizations by linking them to key institutional actors such as public officials and government funders, was not significantly related to disbanding in any of the models. However, additional analyses suggest that government funding may influence disbanding indirectly by increasing organizational size, which in turn decreases the odds of disbanding (Baum and Oliver, Reference Baum and Oliver1991; Wiewel and Hunter, Reference Wiewel and Hunter1985). Engagement in advocacy, which can enhance the legitimacy of organizations and their worthiness of support in the eyes of policymakers and institutional funders, also seemed to reduce the odds of disbanding by increasing the size of the organization, a finding that is consistent with research suggesting that advocacy is critical to the mobilization of resources, such as government funding, that can help organizations grow (Garrow Reference Garrow2011; Marwell Reference Marwell2004). The use of management tools and the delivery of services in languages other than English, both of which can increase organizational legitimacy, had no effect on disbanding.
Voter turnout, an indication of political participation, was not related to disbanding, and the analysis provided no evidence that higher voter turnout protected organizations from the negative effects of neighborhood racial and ethnic group composition on disbanding. Thus in terms of political participation, the findings suggest that organizational strategies such as policy advocacy matter more than neighborhood contextual factors in protecting organizations from disbanding. Future research could examine the effect of other indicators of political participation, such as neighborhood mobilization around specific issues, on organizational disbanding.Footnote 11
The patterns uncovered in the analysis provide a potential explanation for the dearth of organizational resources in Black and Latino neighborhoods documented in prior research (Allard Reference Allard2009; Small and McDermott, Reference Small and McDermott2006; Wolch et al., Reference Wolch, Wilson and Fehrenbach2005). Higher disbanding rates in neighborhoods of color are likely to result in disparities in the geographic distribution of organizational resources (Small and McDermott, Reference Small and McDermott2006). At the same time, ecological theorists have proposed that high disbanding rates of populations of organizations signal a hostile resource environment, discouraging organizational founding (Aldrich et al., Reference Aldrich, Zimmer, Staber, Beggs, Baum and Singh1994; Baum and Oliver, Reference Baum and Oliver1992). Future research can explore the relationship between neighborhood racial composition, founding, and disbanding.
More research is needed that will uncover metropolitan-level determinants of racial stratification as it relates to organizational disbanding. For example, work is needed that directly assesses how public officials and other institutional audiences socially construct worthiness and legitimacy as they allocate funding, and how these constructions vary according to the particular histories of immigration, race relations, and patterns of residential segregation at the regional level. In their study on the allocation of Community Development Block Grant dollars in the San Francisco Bay area, for example, De Graauw and colleagues (2013) demonstrate that public officials in newer suburban areas are less likely than officials in traditional immigrant gateways to award grants to immigrant organizations. They argue that officials in traditional immigrant gateways embrace norms of inclusion that have not yet been institutionalized in the suburbs. Segregation at the metro or county level might also influence the risk of disbanding in heavily minority neighborhoods by determining the level of racial hatred. Research has demonstrated that acute residential segregation at the block or census tract level may exacerbate racial tensions (Baybeck Reference Baybeck2006; Oliver and Wong, Reference Oliver and Wong2003; Rocha and Espino, Reference Rocha and Espino2009), heightening racial hatred and leading to more prejudicial policy preferences among Whites (Kinder and Mendelberg, Reference Kinder and Mendelberg1995). As this study focuses on Los Angeles County, metro-level variables are held constant.
The disbanding of nonprofit human services may also depend on organizational and/or neighborhood-level factors that I have not measured or accounted for in my theoretical framework. For example, I cannot assess the degree to which lack of demand for services may contribute to disbanding. Although I have included population density as a proxy, I have not measured demand directly. Nonprofit scholarship suggests that nonprofit human services locate in minority neighborhoods to meet the needs and preferences of local residents (Bielefeld et al., Reference Bielefeld, Murdoch and Waddell1997). Yet, as noted by Wilson (Reference Wilson2009), neighborhoods populated by racial out-groups experience chronic racial isolation—in part because people go out of their way to avoid them. While there is evidence that organizations that locate in and serve particular ethnic or racial minority neighborhoods can work to expand their boundaries to include groups that cross immigrant, ethnic, and racial lines (Okamoto and Gast, Reference Okamoto and Gast2013), they may nonetheless experience reduced demand for services when potential clients or other stakeholders avoid the neighborhood because of its racial composition (Kissane Reference Kissane2010). Still, to the extent that resource-poor Black and Latino neighborhoods experience demand that outstrips supply, demand may not account for much of the variance in the analysis. It is also possible that smaller nonprofit organizations, which are more likely to disband, self-select into minority neighborhoods. Although controlling for size, measured as expenditures, does not rule out selection effects, it does suggest that neighborhood racial composition has a robust effect net the effect of size.
Finally, the findings need to be understood as generalizable to the particular types of organizations included in the sample. The sample excludes hospitals and educational organizations that may be more likely to survive than the smaller and less institutionalized nonprofit human service organizations that comprise the bulk of the sector. The sample also excludes religious congregations, although it includes faith-based nonprofit human service organizations that are not congregations. Research has shown that congregations are theoretically distinct from non-congregations. They are generally smaller, more loosely structured, and more limited in their range of human services than secular human service organizations and faith-based human service organizations that are not congregations (Clerkin and Gronbjerg, Reference Clerkin and Gronbjerg2007; Cnaan and Boddie, Reference Cnaan and Boddie2001). Research also suggests that storefront congregations are often oriented toward followers outside the local community (McRoberts Reference McRoberts2003).
CONCLUSION
In this paper I demonstrate that nonprofit human service organizations experience increased odds of disbanding with an increase in the percentage of Blacks and Latinos in the neighborhood, while an increase in the percentage of Whites in the neighborhood has the opposite effect. Thus, the stratification of nonprofit human service organizations mirrors the social stratification of people and the social categories that define them. As a result, disbanding patterns of nonprofit human service organizations tend to reinforce these fundamental categories of social worth. Given the pervasive nature of residential segregation by race in the United States, especially for Blacks (Holloway et al., Reference Holloway, Wright and Ellis2012), results suggest the need to take seriously the potential role of neighborhood racial and ethnic composition in structuring the risk of disbanding among nonprofit human service organizations.
APPENDIX
Codes for Service Areas: National Taxonomy of Exempt Entities (NTEE)