1. INTRODUCTION
Ships are the world's foremost means of transportation and are recognized as the most economical method of moving goods around the world. Due to the large quantities of cargo carried by each ship even a single accident can cause an environmental disaster and/or a serious short-term environmental impact if the cargo is discharged into the ocean. An ever increasing cargo volume carried by sea and an increased concern for the environment has led to increased focus on analysis of ship traffic both to prevent accidents and to make informed decisions about fairway design, traffic separation schemes and disposition of emergency services. This increased focus on safety has led to a need for risk analysis models for ship operations and grounding, including analysis of ship traffic and manoeuvring. Analysis of ship traffic has been hindered by a lack of data and the difficulty of obtaining data from all vessels passing through an area during a sufficient time span to produce statistics. The analysis has had to rely on limited data sets from purpose-built shore based measurement systems, data sets from selected vessel or synthetic data from simulators. Simulator studies have shown an increase in capability with the development of faster computers, but they are either limited by number if human operators are employed, or by a lack of accuracy if the human element is forgone in favour of a large number of trials with autopilot algorithms. A new possibility of data acquisition was introduced with the introduction of AIS. Originally designed for radar augmentation and vessel traffic services (VTS), the system can be used to collect information about traffic in the area with little effort as the infrastructure is deployed around the world in compliance with the SOLAS convention. AIS provides position updates at sample rates varying from three seconds to three minutes dependent on the individual vessel's manoeuvre situation. The amount of data generated from AIS varies with the instantaneous traffic situation in the area, but if one considers historic data for traffic analysis, the amount of data to be processed increases to a hitherto unimagined scale. The amount of available information will tend to infinity if one keeps the detailed AIS records; it is evident that the previous situation of data scarcity has been replaced by an overabundance of data and that the techniques employed to analyze this data is of increasing importance if one wishes to utilize this data source to its fullest potential. Little has been published about the use of AIS for traffic analysis. Gucma & Przywarty, Reference Gucma and Przywarty2007 and Gucma & Goryczko, Reference Gucma and Goryczko2007 used AIS to provide data of the major traffic patterns and their density in the Baltic Sea to analyze the location of possible oil spills. AIS can provide data for more detailed analysis, down to the scale of individual manoeuvres, but this scale poses additional problems as the manoeuvre patterns in AIS position reports fall into groups defined by geometry not by some measure of absolute position. This problem is further enhanced by analysis of areas where no prior knowledge of manoeuvre patterns exist, making the problem both the identification of manoeuvre patterns and the grouping of the data according to these patterns.
This paper will show how one can utilize AIS as a data source to explore the existing manoeuvre pattern in an area, estimate the manoeuvre sequence and generate traffic statistics by application of computer vision theories. The process produces an idealized description of the manoeuvring pattern and statistics with relatively little effort. In addition it will be shown how to utilize databases of publicly maintained navigational aid installations to estimate the most probable navigational aid used for transitions in the manoeuvre sequence.
2. METHODOLOGY
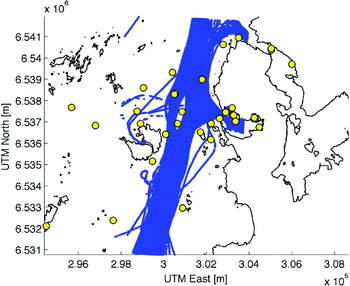
The selected area of study shown is in Figure 1. Position reports were obtained from AIS data collected in the period of April to June 2006. The area is that surrounding Risavika harbour in south-western Norway and shows a clear traffic pattern. The premises of application of computer vision techniques to explore and group the traffic in an area are:
• There are well defined manoeuvre patterns which can be detected by looking at the traces of the ship positions.
• A prototypical manoeuvre plan is, or appears from external observations, shared by vessels following a manoeuvre pattern.
The assumptions are fulfilled in constrained waters where geographical features restrict traffic and either prescribe a particular manoeuvre plan, or necessitate an orderly manoeuvre execution. A typical collection of position reports in constrained waters from AIS is seen in Figure 1, which exhibits several overlapping, and well defined traffic patterns.
AIS samples in blue and navigational markings in yellow in an area where traffic is constrained by land and island formations.

2.1. AIS as a data source
AIS was introduced in a SOLAS amendment and is a recent addition to the required bridge equipment aboard vessels in domestic and international traffic. The system connects the ship's global positioning and speed measurement systems to a transponder, which broadcasts the ship data. The AIS data is received by other ships as well as base stations along the coast, and is used both by ship-based ECDIS and VTS control centres for surveillance and radar augmentation. The system is self-organizing by a time division multiplexing algorithm and provides updates to variable data at rates depending on the ship's speed and manoeuvre situation. The data broadcasted from an AIS transponder is divided into static, semi-static and dynamic data.
• Static data: Ship identification number (MMSI number), length and breadth.
• Semi-static data: Ship destination, hazard level of cargo and ship draft.
• Dynamic data: Time of broadcast, ship speed, rate of turn, course over ground and position.
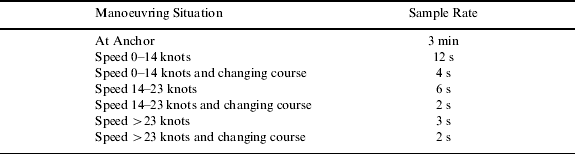
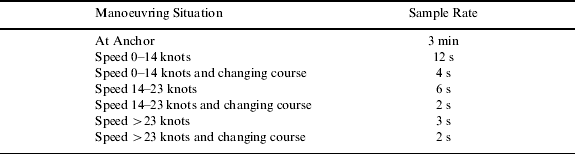
The rate of data transmission is seen in Table 1. The data rates are sufficient to conduct manoeuvring pattern studies, and the time-code multiplexing algorithm of the system provides space for about 1000 vessels at the same time; a limit which the amount of traffic in the studies area is well below. The accuracy of the position data transmitted is limited by the accuracy of the ship-borne global positioning system. While there are different satellite positioning systems available or in development GPS is the leading system currently deployed. While the accuracy of GPS originally left something to be desired, the development of differential GPS systems and advances in positioning algorithms has greatly increased the accuracy of the position measurements from GPS. The currently installed set of global positioning systems in the world fleet is a mix of low and high quality receivers. This mix of position quality directly influences position reports in AIS and can be exaggerated by the use of low quality receivers on recreational vessels or on vessels where AIS is perceived as being unnecessary equipment. This heterogeneous data quality can be perceived as noise in the position data and be countered by relying only on repeated similar series of position reports and using the median values to arrive at a description of the traffic.
Sample rate of variable data from AIS.
AIS data from the greater area around Stavanger in the south-west of Norway was delivered by the Norwegian Coastal Administration. The data contained MMSI number, time of transmission and dynamic AIS data. The AIS reports are not in the form of ship position reports in a sequence, but as a stream of packets from different ships as received. To apply the data from AIS in manoeuvring analysis, the data for individual ships must first be reconstructed. This reconstruction is achieved by use of the unique MMSI number and the time of broadcast with which every data frame is marked and allows the sorting of data from AIS into time series for each different MMSI number. There are various error sources in AIS data as reported in (Harati-Mokhtari et al., Reference Harati-Mokhtari, Wall, Brooks and Wang2007) and (Norris, Reference Norris2007), ranging from data corruption, erroneous MMSI number, target swaps, faulty position reports and errors in rate-of-turn data. Faulty position reports as encountered when there is a problem with the receiver (Norris, Reference Norris2007; Graveson, Reference Graveson2004) are handled in historic analysis by the selection of samples by area. Erroneous MMSI numbers are difficult to compensate for if there is more than one transponder in the area broadcasting the same number; target swaps and duplicate MMSI numbers were filtered out using a filter based on comparing distance between samples and the possible distance covered at the reported speed and time difference. To account for situations where a ship might leave the studied area and reappear, the resulting time series from the MMSI groups were split at major discontinuities in time. Detection of these discontinuities is achieved by the mean and standard deviation of the sample rate for each specific MMSI number. The presence of harbours in the area is accounted for by removing sections in the time series where the ship has zero speed. It was found that in the absence of velocity data the field reserved for speed in the navigation message is set to 127 (all 8 bits set), thus the operation had no effect on time series where speed data was missing.
2.2. Model for ship traffic in restricted waters
The analysis of traffic in an area must be supported by an underlying theoretical model for the traffic and it must capture the features of the underlying process. In the case of ship traffic, the underlying process is ship manoeuvring and the representation of the data is conceptually divided into three levels:
• Time-series: A collection of sequential data of a single ship's manoeuvre process.
• Traffic-Group: Collection of the time-series of ship traffic following a similar geometrical pattern in the same direction of travel.
• Area-traffic: The result of the combination of all the traffic-lanes in the area.
The aggregation of similar geometric patterns is based on the assumption that a similar manoeuvre process will produce a similar geometric trace of ship movements. The traffic-group is positioned as the aggregation of the individual ship movements into the traffic patterns we observe in retrospect. The traffic-group enables the median path and spread of traffic to be measured and can provide useful statistics about the current traffic situation. Median values and statistics cannot alone model the traffic pattern and only help to summarize the traffic situation. To find a meaningful model we turn to the process behind the results, that of ship manoeuvring, to provide a suitable description of the manoeuvre process of the traffic-group.
2.2.1. Manoeuvre model
The process of ship manoeuvring is assumed to follow a pattern where specific manoeuvre strategies are executed in sequence to produce the desired outcome. The traffic-group can then be represented by the execution of one specific manoeuvre strategy in a part, or section, of the traffic-group. The admissible manoeuvres in a traffic-group are limited and are represented by a necessary simplification since it is impossible to discern between manoeuvre types other than course changing and course keeping by analyzing position and speed reports. This results in a model of manoeuvring where a course keeping strategy is selected for sections without course change. For sections with course change a strategy where control of the relationship between the rate of turn and speed is executed to place the vessel on a circular path is selected. The strategy of turning the ship along a circle gives the master a procedure to control the future position of the vessel in restricted waters while executing a course change. This idealized representation is inspired by (Lützhöft & Nyce, Reference Lützhöft and Nyce2006) and (Aarsæther & Moan, Reference Aarsæther and Moan2007) where the approach is observed both in planning manoeuvres and in training programmes. While different manoeuvre strategies can be expected to be employed, the simple line-circle representation is intended as a low-resolution representation of the manoeuvring process. The numerical parameters required for the manoeuvre model are derived by the information needed to specify each manoeuvre. The following properties are used to initiate a specific manoeuvre from the idealized representation:
• Straight line: Course angle of the line and speed
• Circle section: Radius of turning circle, course change and speed
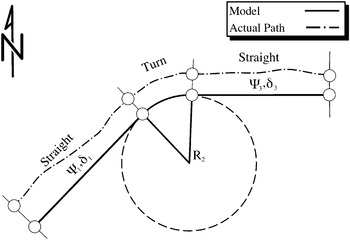
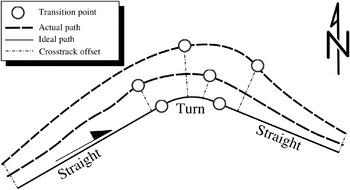
The total traffic model for an area is obtained by superimposing the different manoeuvring patterns. This neglects the interaction of ships following different manoeuvre patterns, but the simplification is a necessity as it allows the treatment of different manoeuvre patterns separately. The manoeuvre parameters of each section in the traffic-group are specified as statistical distributions to capture the variation of the ship traffic. The final model is the idealized description as a collection of straight line segments connected by tangential circles with probability distributions for the parameters of each segment. The model for ship manoeuvring can then be illustrated by Figure 2, which shows an ideal path of the traffic-group with manoeuvre sections along with a typical observed case. The defining geometric characteristics of each manoeuvre are indicated with Ψ being the actual course and R the radius of turn manoeuvre. δ is the possible perpendicular offset from ideal path, or spread of the traffic.
Manoeuvre pattern model.

2.2.2. Manoeuvre transitions
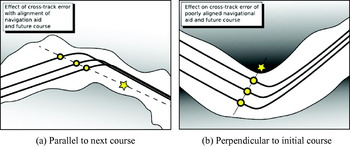
The transition between different manoeuvre strategies is triggered either by an external condition such as the vessel's orientation relative to landmarks and navigational aids in the fairway, or by the evolution of vessel specific variables like course and position. The location of all the navigational aids in Norwegian waters is recorded by the Hydrographic Service of The Norwegian Mapping Authority. The records of the navigational aids are available in machine readable form with coordinates, name and type available for each installation. This data source is cross-referenced with the results of inferring the manoeuvre plan to produce the probable conditions used to transition between manoeuvres. The choice of transition condition is critical since it greatly influences the end result of the method. The applied condition is based on the aptitude of the navigational aid to provide consistent identification of a beneficial transition point in order to minimize the propagation of cross-track error along the path. This is achieved where the object selected for reference is an apparent bearing as close as possible as the next course. An illustration of the result achieved with this selection of navigational aid is seen in Figure 3a where course lines with identical shape and initiation of turn are superimposed with different cross-track errors. It is worth noting the difference with a selection of a bearing to navigational marking that is indifferent to cross track error as in Figure 3b. The propagation of the cross-track error is minimized with a decreasing difference between the bearing to the selected navigational aid and the next desired course angle at the desired transition point. This principle of navigation is selected as the guiding mechanism to identify the condition and navigational aid used for transitions between straight and turn segments.
Effect of navigational aid selection on the evolution of cross-track error along the path.

2.3. AIS data frames to manoeuvre model
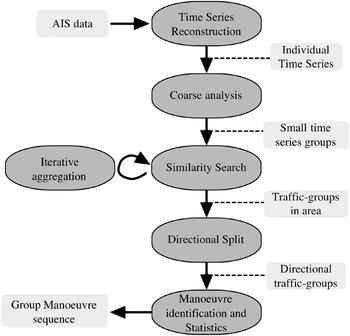
The process of converting AIS data of the ship traffic in an area into an idealized description separated into individual manoeuvres is a multistage process. It starts with the time-series reconstruction and proceeds with the aggregation of the individual time-series into traffic-groups which are further analyzed to yield traffic statistics and a sequence of manoeuvres followed in both directions of the traffic-groups. A conceptual flowchart of the process is seen in Figure 4.
Flowchart of the process to transform AIS samples to a sequence of manoeuvres.

2.3.1. Track-line registration
The problem of automatically detecting and comparing and tracking features in images has been explored in the fields of computer vision and medical imaging. The task of comparing images to produce an objective measure of their similarity is named image registration, a technique which is used to stitch satellite images for GIS and in medical imaging. Image registration techniques are surveyed in (Zitova & Flusser, Reference Zitova and Flusser2003) and (Brown, Reference Brown1992) and can be divided into two major categories:
• Feature based, comparison of aggregated features of identified shapes in an image-like area centre and intersections.
• Region based, test of similarity in image intensities.
These methods can be used to detect the overlapping regions of images or to find areas in images that match a reference shape. These techniques can be applied to the problem of manoeuvring analysis to separate traffic into groups of similar geometric shapes. In order to apply these methods, the AIS data had to be presented as digital images such as monochrome images that are represented as a matrix of grey-scale intensities in the range [0, 1]. To transfer the AIS position reports to an image representation, the area was discretisized by a partition into 75-by-75 metre bins with the number of position reports in each bin as the grey-scale values. The resulting resolution of the area becomes 83×150 pixels with this bin size. The density of position reports from AIS shows the intensity of ship traffic in the area, but individual reconstructed time-series treated in the same way result in an image of representation of the position trace for a particular ship.
The application of image registration techniques is well suited to organize the track-lines into geometrical similar groups and the artificial image representation of the AIS samples is well suited for such an application since it is generated in controlled circumstances. The controlled transfer of remotely sensed data into a discrete representation of the position traces simplifies registration by removing the need to consider differences in resolution and geometrical distortions expected in images collected from optical equipment. While the image resolution and geometric distortions are eliminated, the offset in North (x) and East (y) direction of individual position traces following the same manoeuvre pattern is not. To compensate for the slightly different imprint of each time-series, the image representation is augmented by extending each sample by three pixels in each direction. To reduce processing time the sorting of position traces was divided into a coarse and detailed analysis. The coarse analysis simply looked at the correspondence of track images without accounting for possible translations. If two images were deemed similar, future comparison was done with the mean track of the two. The coarse analysis left a large number of small groups, which were used as inputs to the detailed analysis. To compensate for possible translations in x and y direction the similarity between the track-line images was measured by computing the cross-correlation between two images for translations in North and East direction. The magnitude of the admissible variation in translation must be carefully selected based on the traffic in the area, the displacement must be allowed to cover as much of the traffic as possible, but it must also be restricted so as to counter mis-registrations of similarly shaped traffic groups in different parts of the area. The track-group image is used as a template image which the procedure attempts to find in the track-line image which is tested. To implement the search for maximum similarity by translation the template image is extended 10% in each direction, and the (x, y) translations (u, v) allowed to vary between 0 and 20% of the image size in each direction. The cross correlation function will have a maximum for a specific translation (u, v), and the relative degree of similarity between the images is obtained by dividing the resulting maximum in the cross-correlation function with the total image intensity of the original image. The equation for the cross-correlation between the track-line group image and the track-line template for a translation (u, v) is seen in Equation 1 which is a slightly modified version of the formula presented in (Brown, Reference Brown1992), where T is the template image, I is the image we wish to test and the pairs (x, y) & (u, v) denotes pixel position in the images and translation offset for the test image. The normalization factor is modified to account for the presence of only 0 and 1 in the image which simplifies the sum of absolute image intensities to the number of nonzero pixels; this eliminates a computationally expensive matrix multiplication and square root computation.

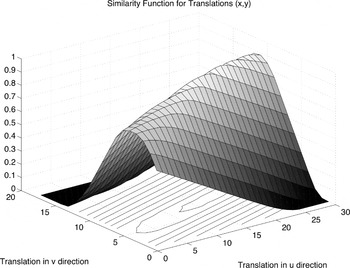
Equation 1 measures the percentage of overlap between the pixels between the reference image and the tested image with a translation (u, v) and produces values in the interval [0, 1] for each possible (u, v) pair. The Equation 1 maximum is desired as it indicates the maximum degree of similarity obtainable between the two images. The maximum of Equation 1 is found by formulating the image similarity as a constrained non-linear optimization problem with constraints placed on the maximum translation between the two images. Discrete optimization techniques, such as branch-and-bound, are not applied due to the computational complexity. The function value at an arbitrary decimal (u, v) translation is found by interpolation in two dimensions inside the set of points enclosing the translated (x, y) pair. The precise location of the maximum is not relevant in this analysis and the interpolation strategy provides the benefits of sub-pixel accuracy in the search for a maximum. A detailed derivation of optimization and interpolation strategies is found in (Nocedal & Wright, Reference Nocedal and Wright1999; Press et al., Reference Press, Teukolsky, Vetterling and Flannery2007). The selected method is a simple gradient descent search where the gradient is estimated from object function values. The standard optimization method employed only guarantees the convergence to a local, not the global, maximum. The function is expected to have several local maxima due to variations in the real-world data. The robustness of the solution is therefore verified by performing searches for the maximum starting at a set of initial translation values. A typical plot of the similarity function in 2D for two similar track-line images is seen in Figure 5. The detailed analysis combined the groups from the coarse analysis by an iterative process where groups that showed a maximum correlation were combined. The final operation was to divide the geometric groups into two subgroups depending on the direction of travel.
Surface of image similarity function for translations in x and y direction.

2.3.2. Track-line group analysis
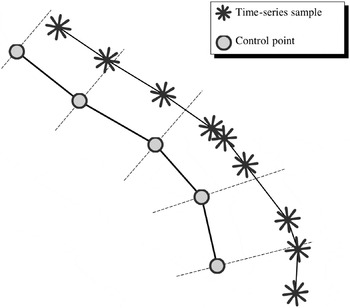
With the time-series sorted into groups of similar shape, the groups were divided into two subgroups depending on the direction of travel. These directional groups form the basis of traffic-group analysis. The desired output value from the analysis is the idealized representation of the time-series group as a set of interconnected straight lines and turn manoeuvres with associated statistics. The time-series reconstructed from AIS have heterogeneous sample rates, within the geometric similar group, and even within the individual time-series. This necessitates a transfer of individual time series data to a common representation, which compensates for the variations in sample-rates. Control points were computed as the mean points of 100 evenly spaced points for each time-series belonging to the group. The control points were computed as the median value of points at 1% increments of the total time-series' geometric length. To establish a mapping between the time-series samples and the control points of the traffic-group the intersection between the position traces and a perpendicular line of each control point was found to establish index map of the time-series' onto the traffic-group. An illustration of the mapping procedure is seen in Figure 6 where the inhomogeneous sample rate of the time-series is related to the evenly spaced control-points. Vessel speeds at the control points were found by mapping the control point indices onto the time-series and values for cross-track spread as the distance from the median point to the intersection along the perpendicular vector. This provides the statistical summary of the traffic along the traffic-groups length. Separation of the traffic group into a sequence of the two manoeuvre types is achieved by analysis of the median curvature κ of the time-series' at the control points.
Index mapping between evenly spaced control points and the variable spaced time-series points. Perpendicular lines at the control points show the intersections where speed and cross-track offset are calculated.

2.3.3. Curvature calculation
The curvature κ of the ship's track can be calculated from the position and time data. This can be done by filtering the position data to remove noise and then using a numerical expression for the curvature calculated by solving the equation for a circle passing through the three consecutive points. κ can also be obtained directly from the time domain signals for the position x=x(t) and y=y(t). The curvature of these two signals in Cartesian coordinates with Φ as the tangential angle of the signal is:
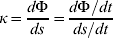
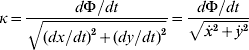
The need for dΦ/dt can be eliminated by the following identity:
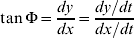
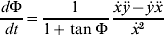
Equation 5 substituted into 3 gives the final expression for the curvature calculated from the x and y time domain signals:

This expression for κ relies on the derivative and double derivative of the vessel track line positions. Numerical calculation of these derivatives from noisy position data is inherently error prone. Instead of calculating the derivatives numerically, the derivatives are evaluated by fitting polynomials to the x(t) and y(t) signals. It is impossible to find a general polynomial to describe the complete track with sufficient accuracy for the entire ship track. To calculate the curvature at a specific track sample, a 5th order polynomial is fitted to a section spanning 20 samples both forward and backward in time. This provides both a theoretical form for the evaluation of the derivatives and suppresses the noise in the positioning data. The derivatives and double derivatives can then easily be evaluated from the corresponding formulas for polynomials. The polynomial fit was computed using MATLAB's POLYFIT function using both centring and scaling to improve the numerical properties of the fitting procedure.
2.4. Identification of manoeuvres and navigation aids
The separation of the traffic-group into straight and turn sections is based on the features of the groups' curvature trajectory. The group curvature was found by applying the mapping between the individual time series and the control points of the traffic-group. The median value for curvature at each control point was selected to form the curvature of the entire group at the control points. The identification of turn and straight sections was based on an ad-hoc method applying the mean (µ) and standard deviation (σ) of the median curvature trajectory. If a point on the trajectory was outside a low curvature band defined by μ±2σ the point was identified as being in a turn-manoeuvre. This procedure was repeated twice by recalculating the mean and standard deviation of the identified straight section of the curvature trajectory and assigning any outliers to the turn segments.
The prescribed geometric model with straight lines interconnected by turns reduces the task of segment separation of the individual time-series to the identification of the turn segments, any part of the time-series not belonging to a turn section must by definition belong to a straight section. The manoeuvre pattern of the group is replicated with some variations in each time-series. In order to measure the variation of the manoeuvre parameters of the entire group, the manoeuvres in the time-series must correspond to the individual manoeuvres in the group. This mapping is especially important when identifying the most probable navigational aid, since each time series will have slightly different transition points between manoeuvres. The situation of the slight variation in the location of the individual manoeuvres in time and space is seen in Figure 7 where the differing manoeuvre transition points in relation to the median track of the directional group are shown.
Separation of time-series into manoeuvre sequences. The manoeuvre sequence in the ideal path is shared but the precise location of the transition points between manoeuvres varies.

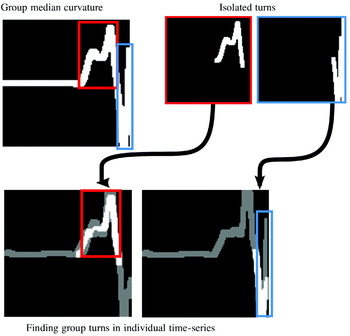
Image registration techniques were applied to identify the turn sections from the curvature of the directional traffic groups in the curvature of the individual time-series. This was achieved by creating an image representation of the curvature of the directional group turns and maximizing similarity between each of the group turns and the curvature trajectory of the individual time-series. This process is illustrated in Figure 8 where the turns of the traffic-group are separated and transferred to image representations and the maximum correlation between these images and the time-series curvature is used to identify the execution of the group pattern in an individual case. Equation 1 was again applied, but the denominator was simplified to only scale for overlap of the pixels in the isolated turn images. Ordering of the turn sequence was enforced by limiting the image similarity search to the part of the trajectory following the last identified turn section. The location of the individual time-series turns was the midpoint of the turn structure identified with turn border points modified by shifting them with the offset of the maximum correlation. Most probable navigational aid for the initiation of turns was identified by considering the bearing from the vessel to all the navigational aids in the area at the turn initiation point located by the image registration based procedure. The criterion used was to find the minimum difference between the apparent angle to the navigational aid and the next desired course angle. The name and index of the identified navigational aid for each time-series was stored for later analysis.
Finding the group manoeuvre sequence in an individual time series. The curvature of the turns in the traffic-group is isolated and the most probable location of the group turns is found in an individual time-series by maximizing the similarity between the isolated group turns and the curvature of the time-series. The overlap between the median curvature and the individual time-series curvature is seen as white, and non-overlapping regions as dark grey.

3. RESULTS
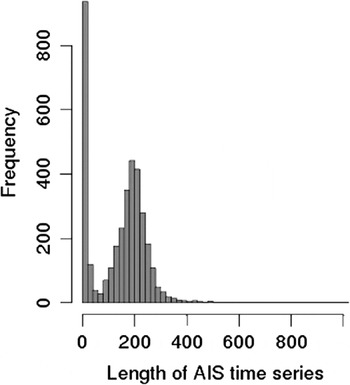
The AIS data was stored in an SQL database and indexed after MMSI number and time, this made the process of obtaining AIS position reports ordered by time for a particular vessel straightforward manner with standard SQL queries. The time series was separated as described above resulting in excess of 3600 cases, time series shorter than 15 samples were then excluded resulting in 2763 cases with a total of 513,533 position reports. The exclusion criterion was based on the distribution of sample lengths. Some time series were short because they were by-products of the time-series splitting procedure. This can result from periodically exceeding the speed threshold used to split time-series to remove stationary vessel data, and the time series were removed to reduce processing time. The distribution of time series lengths is seen in Figure 9. It is evident that there is a component of very short time series containing a small fraction of the total number of samples. The remaining time series were used as input for the traffic-lane construction. Image registration was implemented in MATLAB with FMINCON from the optimization toolbox used for maximization of image similarity.
AIS time series length showing a large component of very short time series from reconstruction.

3.1. Traffic separation and statistics
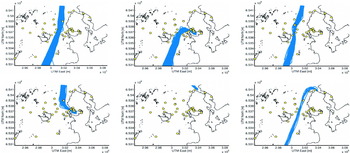
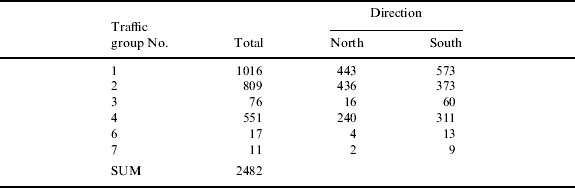
The number of time series in each group is shown in Table 2 which also includes the breakdown of traffic in the two travel directions. The traffic-groups are numbered and shown in sequence in Figure 10; the median track of the resulting directional traffic-groups is shown in Figure 11.
Separation of traffic by geometry into groups, which shows the overlapping traffic patterns present in the area.

Median track of the traffic-groups in Figure 10. Median track is shown for the directional groups “North” (continuous line) and “South” (dash-dotted line), with high curvature sections shown in red.

Distribution of time series in traffic groups.
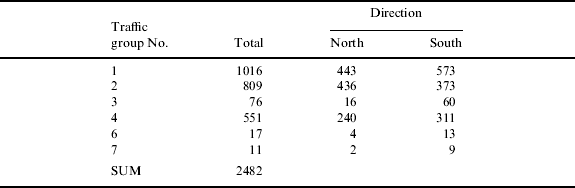
Traffic group No. 5 is not included since it refers to vessels at anchor in the harbour. The number of time series in each group reveals that most of the traffic in the area follows the main traffic-lane crossing the area in the North/South direction. The other main traffic-lanes are those entering and leaving the harbour in the area. Three other auxiliary traffic-lanes are also visible with group No. 3 representing traffic crossing westward of the navigation markings in the approach to the harbour, group No. 6 a small part of another traffic-lane intersecting with the north-east corner of the area and group No. 7 showing a small component of traffic between the north-east corner and the mid-point of the southern border of the area. It is worth noting the difference in traffic density between the three densest and the following sparsely populated traffic-groups. The low number of passages in the three least populated traffic-groups implies a limited accuracy of any statistical description of the traffic. While the quality of the quantitative measures for those lanes are lacking, the information they provide regarding rarely occurring manoeuvre patterns can provide interesting scenarios of interfering traffic for risk-analysis and crew training pertaining to this particular area. Relevant statistics were collected for each section.
• Straight section: Median speed over section, cross-track deviation from median value at start and end and average course angle over section.
• Turn section: Median and mean curvature over section, median speed and course angle at exit.
The variables for each section were fitted to the skew-normal distribution (Azzalini Reference Azzalini1985). The skew-normal probability distribution was chosen since it defines a class of distributions which contains the regular normal distribution, but in addition allows the data to exhibit a bias capturing the deviations from the normal distribution one would expect from measurements. The skew-normal distribution is an extension of the normal distribution and still retains the association with the central limit theorem due to its close link with the normal distribution. While the normal distribution is a two-parameter model fully specified by the mean and standard deviation, the skew-normal distribution is a three-parameter model with location, scale and shape required to fully specify the model. The location and scale of the skew-normal distribution are analogous to the mean and standard deviation of the normal distribution while the shape parameter is introduced to represent the bias of the underlying process, with a shape variable of 0 the normal distribution is recovered. The skew-normal distribution was preferred due to its simplicity and yet the ability to capture the wider range of behaviours encountered in ship traffic and manoeuvring analysis.
3.2. Manoeuvre plan inference
The inference of the applied manoeuvre plans in the area is a two-step process, the first task is to identify the sequences of straight and turn manoeuvres in the time-series groups. With the manoeuvre type and sequence in each group established, statistics for the manoeuvre parameters of each section are derived from the parameter values from the corresponding time-series sections using the manoeuvre to time-series map. The completion of the manoeuvre plan comes from the identification of the most probable navigational aids and the corresponding bearings from vessel to navigational aid for each transition from a straight section into a turn. A full treatment of the manoeuvre plan for all the traffic groups with two direction is not possible due to lack of space, so the directional groups “North 2” entering the harbour starting at the southern border and “North 4” leaving at the northern border starting in the harbour are selected to illustrate the procedure. These directional traffic-groups were selected since they represent the manoeuvre sequence of the most complicated traffic patterns in the area. It was assumed that the effect of travel direction within each group was negligible, and the selection also shows the two situations of traffic entering and leaving the harbour.
3.2.1. Manoeuvre sequence
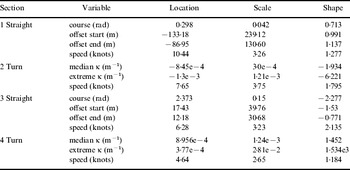
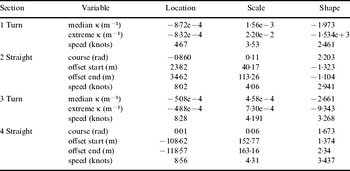
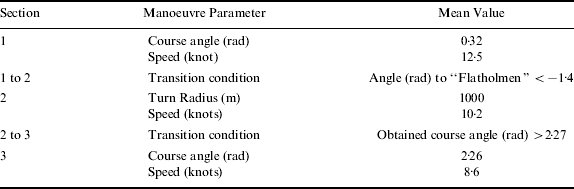
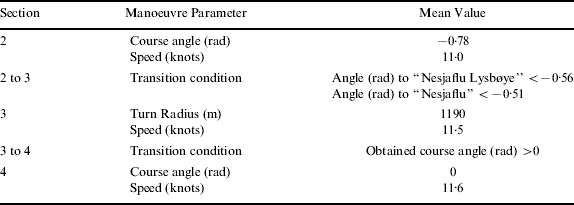
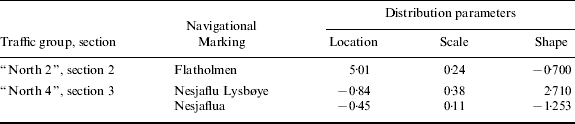
Manoeuvre sequences and estimated parameters for skew-normal probability distributions are shown in Tables 3 and 4. The sequence of manoeuvres and their statistical properties are seen to be very consistent with the properties of the corresponding sample-groups shown in Figures 10 and 11. It is worth noting the correspondence of the statistics for the two straight sections, which enters (“North 2” section 3) and leaves (“North 4” section 2) the harbour in the two manoeuvred sequences. It should be noted that the underlying assumptions about the traffic patterns breaks down in the harbour area, and the results dependent on course and curvature suffers from the relative divergence in course as the vessels manoeuvre for berthing in different parts of the harbour. The discretization of the area has insufficient resolution to capture this effect, and it is not desirable to separate the traffic flows in and out of the harbour from their future or past berthing point. This leads to a high degree of uncertainty about the curvature and final course angle of section 4 in “North 2” and section 1 in “North 4”. The statistic for speed is unaffected by this issue since it will reflect the median speed while manoeuvring in the harbour.
Manoeuvre sequence and statistics for sample group “North 2”.

Manoeuvre sequence and statistics for group “North 4”.

3.2.2. Manoeuvre transition
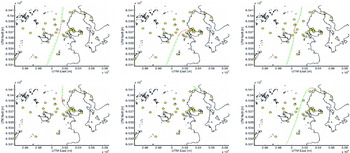
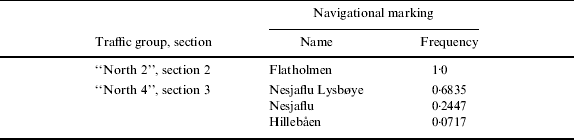
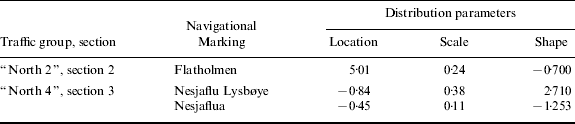
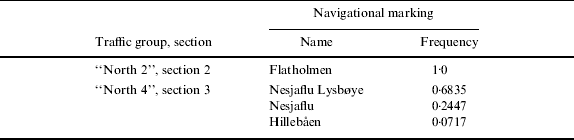
The transition points in each time series were identified by applying the mapping from identified sample-group turns to the individual time-series. The transition points into and out of the turn manoeuvres were identified for all time-series and the median of the course angle at the end of the turn manoeuvre was used to represent the future desired course at the start. The difference between the current course and the estimated future desired course provided an estimate of the ideal bearing to a navigational marker used to initiate the turn for each time series. The apparent angle from the vessel to all the navigational markings in the area within one nautical mile was calculated at the turn initiation point and compared with the course difference between the current and future desired course. The navigational mark with the minimum discrepancy in the course difference was selected as the most probable navigational marking. The relative frequency of most probable navigational marking is seen in Table 5. For “North 2”, section 2, there is only one probable navigational marking, while “North 4”, section 3, is dominated by two markings sharing the same location. The angle from the vessel to the navigational aid for the dominating installations in the identification in each turn initiation is seen in Figure 12a and Figure 12b–12c for section 2 of “North 2” and section 3 of “North 4” respectively. Statistical parameters for the distributions of angle to navigational aid are seen in Table 6. Angles are calculated as negative to starboard of the vessels, objects with apparent angles greater than π are to the starboard side of the vessel.
Angle to most probable navigational aid at initiation points.

Relative frequency of most probable navigational marking.
Statistical parameters for angle (rad) to navigational aid at turn initiation. Angle defined positive in counter-clockwise direction.
3.3. Median manoeuvre plans
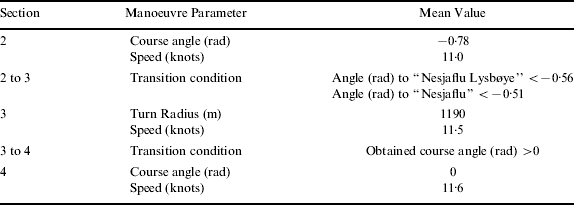
The identification of the manoeuvre sequence and its parameters in combination with identification of navigational aids for turn initiations makes it possible to formulate a template navigational plan for the observed traffic by substituting observed mean values for manoeuvre parameters and angle to navigational aid at turn initiations. The manoeuvre plans are seen in Table 7 for “North 2” and Table 8 for “North 4”. The turn sections in the harbour are omitted due to the uncertainty of turn radius and navigational aid. Turn direction in the presented plans can be inferred by the change in course angle and the apparent angle to the land marks are translated to the range [−π, π]. Course angles are positive in clockwise direction, while apparent angles to landmarks are negative in clockwise direction.
Inferred mean manoeuvre plan for traffic-group “North 2”.
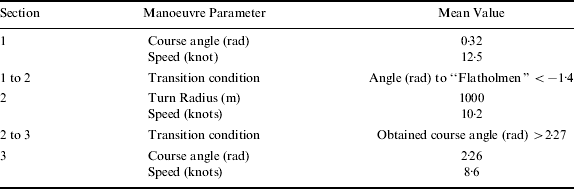
Inferred mean manoeuvre plan for “North 4”.
4. DISCUSSION
The method outlined above is found to yield good results in normal navigation scenarios, while the accuracy in the inner harbour area is limited due to a very complex manoeuvring behaviour. In this case the harbour area was close to the limit on accuracy afforded by a discretization in 75-by-75m bins and the capability of the manoeuvre model to represent the underlying mechanisms of ship traffic. Another effect that was experienced in the harbour area was the drop in accuracy of the curvature calculations near the end of the time-series, due to an increasingly shorter filtering distance. This effect is exaggerated by the location of the time-series ends in the high curvature region associated with turn manoeuvres.
The model's assumption, that the parameters of the traffic statistics and the manoeuvre plan can be calculated independently, is tested by computing the correlation ratio of the parameters. The correlation of cross-track offset, speed, measured curvature in turns and course angle in straight sections are given in Table 9. A value close to one indicates a high degree of correlation and values close to zero, a low degree of correlation. From Table 9 it is evident that the correlation increases with the complexity of the manoeuvre, but even the most complex manoeuvre sequence has a relatively low correlation ratio. This could be explained by the ability of the human operators on the vessels to adapt to the situation and successfully eliminate undesirable conditions and obtain the desired future state of the vessel. The low degree of correlation supports the assumption that manoeuvres can be treated separately and the error introduced by doing so will be small. The viability of AIS as a data source appears good, as the number of cases compensates for the lack of accuracy with regards to simulation trials. The large number of cases in the densest traffic-groups also lends credibility to the statistical description and the measured median values.
Correlation ratio for cross-track offset, speed, course and curvature.

5. CONCLUSIONS
We have shown how automated grouping of ship traffic can be achieved and how it can aid in providing a large sample size for analysis of ship traffic. The methodology presented makes few, if any, assumptions about the behaviour of the traffic in the area and does not utilize any prior knowledge about the traffic pattern and produces good results in the vicinity of a harbour. The combination of automated grouping and the availability of AIS data opens up a range of possibilities for analysis of ship traffic and manoeuvring from simple statistical studies of current traffic to the inference of a prototypical voyage plan for a group of ships. However the method is dependent on recognizable patterns in the traffic in an area and it will not detect traffic patterns where none exist, but it has the potential to be of great aid to traffic and manoeuvring analysis.
6. SUGGESTION FOR FUTURE WORK
This paper has presented a method for almost automatic estimation of manoeuvre patterns from AIS. A natural progression from this work would be to apply these results to provide manoeuvre plans to faithfully simulate the traffic in an area. What is missing from this paper is a fully probabilistic definition of the simplified manoeuvre plan. Median values provide a suitable description of the traffic in the area as a whole. To apply the probability distributions derived for the manoeuvre parameters in Monte-Carlo style simulation studies there should be a procedure to translate a probability level into a coherent set of manoeuvres, introducing an effect of semi-random plans to the simulation. Such a formulation will enable the study of the effect of highly improbable manoeuvre plans.