INTRODUCTION
Efficient use of nitrogen (N) by crops is of increasing importance for both environmental and economic reasons. A number of definitions and approaches to working with nitrogen use efficiency (NUE) have been developed by different groups of researchers (e.g. in the UK: Foulkes et al. Reference Foulkes, Hawkesford, Barraclough, Holdsworth, Kerr, Kightley and Shewry2009; Barraclough et al. Reference Barraclough, Howarth, Jones, Lopez-Bellido, Parmar, Shepherd and Hawkesford2010; Kindred & Sylvester-Bradley Reference Kindred and Sylvester-Bradley2010), depending on their context and concerns. Terminology varies slightly but two principal components of NUE are usually adopted – N uptake efficiency (NUpE), or N capture, the proportion of N taken up relative to that available, and N utilization efficiency (NUtE), or N conversion, the amount of grain produced per unit of N taken up by the crop. Indigenous nitrogen already present in the soil and nitrogen added as fertilizer are both included as available N.
Thus,

where NUpE is the N taken up by the crop/(soil N supply (SNS)+fertilizer N applied) (where SNS is assumed to be fully recovered and fertilizer N applied has variable recovery of <1·0 efficiency) and NUtE is the grain yield/N taken up by the crop, i.e. NUE is the efficiency with which the crop uses the N available to produce grain yield.
Foulkes et al. (Reference Foulkes, Hawkesford, Barraclough, Holdsworth, Kerr, Kightley and Shewry2009) reviewed the contributions of NUpE and NUtE to genetic gain in NUE and of total N uptake (their above-ground N, AGN), nitrogen harvest index (NHI) and grain N concentration to genetic gain in yield at low and high N supply reported in the literature, finding that all could contribute. They commented that N uptake by wheat crops in the UK was relatively efficient, at approximately 0·5–0·6, compared with average recovery worldwide, which is estimated to be approximately 0·3–0·5. Jing et al. (2009), for example, reported recoveries in wheat of 0·34 at N applications of less than 150 kg/ha and 0·27 at N applications of greater than 150 kg/ha in the first year and 0·45 on average across all N rates in the second year of experiments in Nanjing, Jiangsu, China. Barraclough et al. (Reference Barraclough, Howarth, Jones, Lopez-Bellido, Parmar, Shepherd and Hawkesford2010), citing a number of papers in which NUE, NUpE and NUtE, were studied in wheat cultivars at two or more N rates in 2 or more years, highlighted that the literature on N efficiency in UK cultivars was ‘sparse’; the research programme they conducted included 39 wheat cultivars grown in, at most, 4 years and at a maximum of five N rates but only at one location, Rothamsted, albeit in different fields in each year. The results being reported in the present paper include three locations, adding another dimension to that of year in the array of environmental factors.
The relationship of grain yield with grain N concentration and the amount of N taken off by the crop above-ground (AGN), assuming a constant NHI, was examined by Foulkes et al. (Reference Foulkes, Hawkesford, Barraclough, Holdsworth, Kerr, Kightley and Shewry2009). Barraclough et al. (Reference Barraclough, Howarth, Jones, Lopez-Bellido, Parmar, Shepherd and Hawkesford2010) were primarily concerned with achieving high grain N concentration and invoked the law of conservation of matter to explore relationships among characteristics contributing to NUE, concluding that it set a limit on crop N requirements. Grain N concentration has been included in RB 209 (7th edn.; Anon 2000) and the Fertilizer Manual (8th edn.; Anon 2010) as a tool to help growers review their N management, taking the optimum N rate (Nopt) as the standard for efficient N use. In the Fertilizer Manual (Anon 2010), nitrogen is considered to have been optimally available when grain N concentration is 19 mg/g in feed wheat and 21 mg/g in bread-making wheat. Sylvester-Bradley & Clarke (Reference Sylvester-Bradley and Clarke2009) concluded that grain N concentration could be used to indicate whether crops had been under- or over-fertilized in c. 0·7–0·8 of cases; they reported that ‘the main uncertainty in determining grain N concentration was in determining Nopt itself. Yield did not contribute to explaining variation in grain N concentration at Nopt and cultivar type, previous crop and soil type contributed less than 0·3 of the variation in grain N concentration. Following the discussion on differences found with grain N concentration in Denmark, Sylvester-Bradley & Clarke (Reference Sylvester-Bradley and Clarke2009) recommended comparison with other countries such as Ireland. The results reported in the present paper will contribute to this comparison, as Northern Ireland is geographically separate from Great Britain and often has quite different weather conditions (Anon 2011a, b).
The work reported in the present paper also follows on from the HGCA-funded ‘Exploitation of cultivars for UK cereal production’ sub-project on ‘Varietal responses to soil and fertilizer N availability’ (White et al. Reference White, Wilson, Kettlewell, Sylvester-Bradley, Foulkes and Scott1998). Although cultivars of winter wheat were of primary interest in that programme, detailed work conducted on N provides useful background information. Total N uptakes were similar at the two locations in England and one location in Northern Ireland at which the winter wheat experiments were conducted. Grain yields and harvest indices at the Agri-Food and Biosciences Institute (AFBI) Crossnacreevy were much higher than at ADAS Boxworth and Harper Adams University College under the same high N availability treatment. Grain N concentrations were generally lower at AFBI Crossnacreevy (20·2, 21·2 and 20·2 mg/g in 1994, 1995 and 1996, respectively) than at ADAS Boxworth (21·6, 22·6 and 22·3 mg/g in 1994, 1995 and 1996, respectively) and Harper Adams (24·9, 24·2 and 19·6 mg/g in 1994, 1995 and 1996, respectively). The contrast in efficiency of use of acquired N in producing yield between AFBI Crossnacreevy compared with ADAS Boxworth and Harper Adams prompted the studies of yield and grain N concentration relationships in variety trials in Northern Ireland reported in the present paper.
MATERIALS AND METHODS
Winter wheat variety trials at three locations in Northern Ireland are partly funded by the HGCA and conducted by AFBI according to agreed protocols authorized by the HGCA and used throughout the UK (Anon 2011c). The locations are at AFBI Crossnacreevy, south-east of Belfast (54°32′N, 5°53′W), and on-farm near Downpatrick, Co. Down (54°16′N, 5°41′W) and near Limavady, Co. Londonderry (55°04′N, 6°59′W). Grain yields were routinely measured, but grain N concentrations were not always determined. In Northern Ireland, where wheat is almost always grown only for animal feed, there is not the same emphasis put on grain N concentration as in bread-making.
The trials reported in the present paper were carried out in 1998 and 1999. An additional variety trial conducted in 1998, to which a new (at the time) strobilurin fungicide was applied, is also included. Three cultivars were selected from among the 20+ included in the trials for detailed study of NUE and its components. Hereward, a hard endosperm nabim (National Association of British and Irish Millers) Group 1 cultivar (i.e. produces consistent milling and baking quality), was selected because of its bread-making quality. Rialto, a hard endosperm nabim Group 2 cultivar (i.e. exhibits bread-making potential but is not suited to all grists), was selected because of its high yield. Riband, a soft endosperm nabim Group 3 cultivar (i.e. suitable for biscuits, cakes and other flours requiring a soft endosperm), was selected because of its soft endosperm texture.
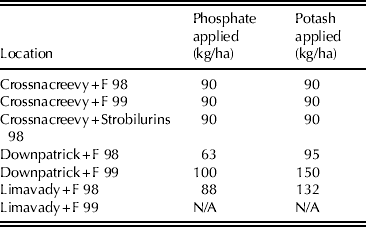
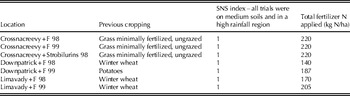
The trials comprised three replications sown in an incomplete block design to maximize statistical efficiency. They were sown with an Øyjord plot drill at seed rates calculated to give viable populations of 250 plants/m2 in spring. Plot width was 1·27 m, with an interplot gap of 0·26 m, and harvested plot area was 40 m2. Phosphate and potash fertilizer were applied according to soil indices to maintain soil levels, taking into account expected crop uptake (Table 1). Herbicides were applied routinely to control weeds. Full fungicide programmes (hence the trial identification of ‘+F’ in the tables) were applied according to agreed HGCA protocols to ensure that disease infections remained below 0·05 of the green area throughout the season. Take-all was not a problem at the second wheat sites, the trials being assessed regularly for incidences of all diseases (in fact take-all is rarely a problem in Northern Ireland, probably because of the relatively high rainfall.) Details of the total amounts of fertilizer N applied in the seven trials are presented in Table 2.
Phosphate and potash applications to trials conducted in 1998 and 1999

Previous cropping, SNS index derived using RB 209 (7th edn., Anon 2000) and total fertilizer N applied to trials conducted in 1998 and 1999

Grain yields were determined following harvesting with an MF8 plot combine and are presented at zero moisture content. Samples of grain were collected and dried at 60°C to zero moisture content. Prior to harvest in 1998 and 1999, all above-ground material on a 1 m length of an inner row from each plot of the three cultivars was collected. The samples were air-dried and threshed, all material being recovered. Following drying and weighing, the grain and straw, which comprised all other material, were milled using a Christy and Norris hammer mill with a 1 mm sieve. Nitrogen concentrations of the grain and the straw were determined by the ‘Dumas’ dry combustion technique using a Leco FP 2000 analyser (AOAC 2000).
The following crop characteristics were determined: harvest index (HI) and NHI were calculated as the efficiencies with which above-ground biomass and AGN were partitioned to the grain within the crop, respectively. Grain N off-take was calculated from grain yield and determined using the combine and grain N concentration from the whole plant sample. Total N uptake was calculated from grain N off-take and NHI. NUpE was calculated from total N uptake and total N applied plus a notional amount of N allocated to the soil (see below). NUtE was calculated from grain yield and total N uptake. NUE was calculated from grain yield and total available N (N applied plus a notional amount of nitrogen allocated to the soil; see below).
None of the trials included plots that received no fertilizer N. Therefore, it was not possible to determine either SNS using crop N uptake in an unfertilized plot, or NUpE. The SNS index was determined retrospectively using the Field Assessment Method included in RB 209 (Anon 2000) and information about previous cropping, soil type and winter rainfall. All the trials in 1998 and 1999 had an SNS index of 1 and so a notional SNS of 70 kg/ha N, the median of the range of 60–80 kg/ha N covered by SNS index 1, was included in the calculation of NUpE (Table 2). Such an assumption seems reasonable given that total N uptakes of 10–12 winter wheat cultivars reported by White et al. (Reference White, Wilson, Kettlewell, Sylvester-Bradley, Foulkes and Scott1998) averaged 57, 65 and 80 kg/ha averaged over N rates of 0, 40 and c. 250 kg/ha applied to the previous crop at AFBI Crossnacreevy in 1994, 1995 and 1996, respectively.
Analysis of variance was used to compare the cultivars. Variance ratios for cultivars, trials and cultivars×trials from the analyses of variance reflect the magnitude of the influence of trials and differences among the cultivars in their behaviour in the trials compared with the cultivar effect. Sizeable variation in all characteristics across the three cultivars in all trials provided an opportunity to use regression analysis to examine relationships among the characteristics. Results at Downpatrick in 1998 were not included in the regression analyses because an unknown amount of N was provided by organic manure applications.
RESULTS
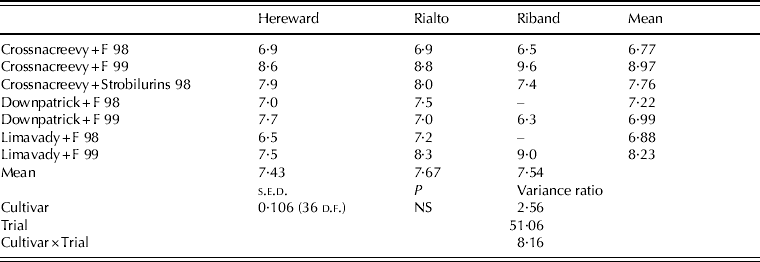
Yields of the cultivars (Table 3) were similar (7·4–7·7 t/ha at zero moisture content), which is surprising, given that in the 1999 UK Recommended List (Anon 1999), the 5-year mean yields of Hereward were much lower (7·7 t/ha, 0·93 of controls) than those of Rialto (8·4 t/ha, 1·02 of controls) and Riband (8·3 t/ha, 1·01 of controls). Variation from trial to trial and in the behaviour of the cultivars in the trials, as indicated by the variance ratios, was large compared to the differences among the cultivars.
Grain yield (t/ha at zero moisture content) (ex combine) of wheat cultivars Hereward, Rialto and Riband in 1998 and 1999

NS: not significant.
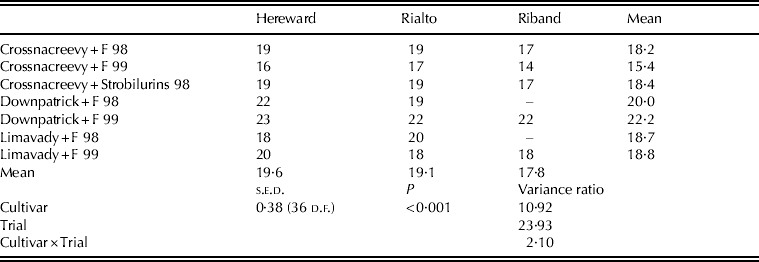
Grain N concentration was significantly higher, in Hereward (19·6 mg/g dry matter (DM)) and Rialto (19·1 mg/g DM) than in Riband (17·8 mg/g DM; P<0·001; Table 4). These were similar to the values for Hereward, Rialto and Riband in the UK 1999 Recommended List (20·2, 19·3 and 17·7 mg/g DM, respectively; Anon 1999). Of all the characteristics measured in the present study, grain N concentration was most consistent, the cultivar×trial variance ratio being smaller than both the trial and cultivar variance ratios and also smaller than in all the other characteristics. Thirteen of the cultivar×trial samples had grain N concentrations less than 19·2 mg/g DM, the remaining six samples being greater than 20·2 mg/g DM with three of these occurring at one site, Downpatrick 1998, where an unknown amount of N was provided by organic manure applications.
Grain N concentration (mg/g) of wheat cultivars Hereward, Rialto and Riband in 1998 and 1999

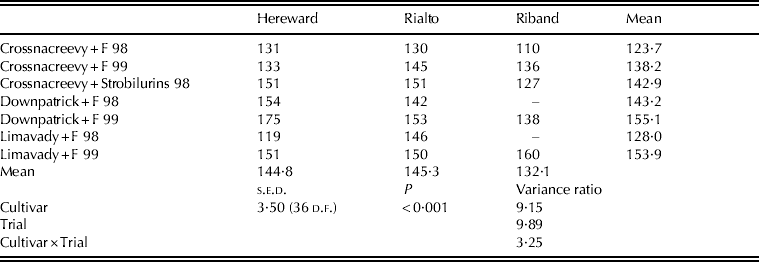
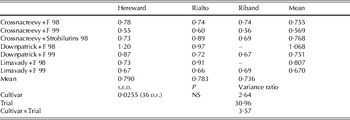
Grain N off-take was also significantly higher in both Hereward and Rialto (145 kg/ha) than in Riband (132 kg/ha; P<0·001; Table 5). Variation from trial to trial and in the behaviour of the cultivars in the trials was relatively small, as indicated by the variance ratios, the range of the means being 118–175 kg/ha. Although total N uptakes and NUpE of the cultivars were not significantly different, the relationships among them were similar to those found in grain N off-take, with Hereward and Rialto being similar and greater than Riband (Tables 6 and 7). A year effect was apparent within each location, with total N uptake and NUpE being higher in 1998 than in 1999. This is reflected in the higher variance ratios for the trial effect than for both the cultivar effect and the Cultivar×Trial interaction for total N uptake and NUpE.
Grain N off-take (kg N /ha) of wheat cultivars Hereward, Rialto and Riband in 1998 and 1999

Total N uptake (kg N/ha) of wheat cultivars Hereward, Rialto and Riband in 1998 and 1999

NS: not significant.
NUpE (total N uptake/total N applied+SNS of 70 kg/ha) of wheat cultivars Hereward, Rialto and Riband in 1998 and 1999

NS: not significant.
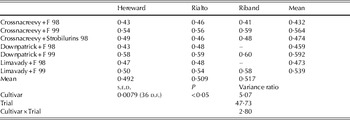
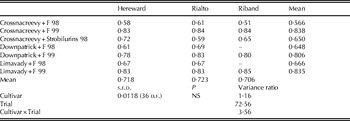
HI was highest in Riband (0·52) and lowest in Hereward (0·49) with Rialto intermediate (0·51; P<0·05; Table 8). NHI was not significantly different in the three cultivars, varying between 0·71 in Riband and 0·72 in Hereward and Rialto (Table 9). The year effect is again very noticeable with both HI and NHI being much greater in 1999 than in 1998 at all three locations. This is reflected in the higher variance ratios for the trial effect than for both the cultivar effect and the cultivar×trial interaction for HI and NHI.
HI of wheat cultivars Hereward, Rialto and Riband in 1998 and 1999

NHI of wheat cultivars Hereward, Rialto and Riband in 1998 and 1999

NS: not significant.
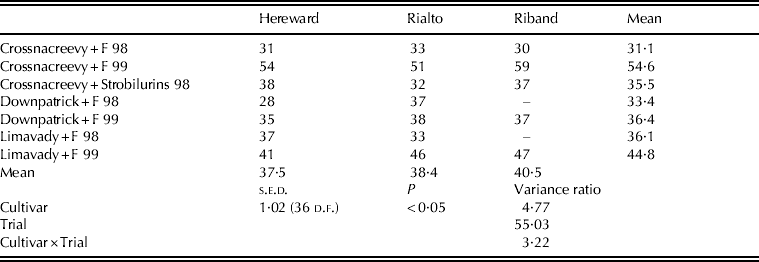
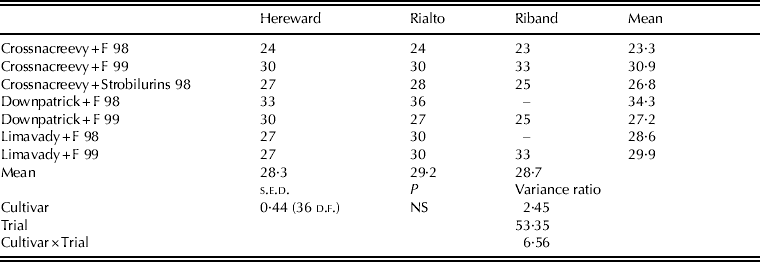
NUtE was significantly lower in Hereward and Rialto (37·5 and 38·4 kg grain/kg N taken up, respectively) than in Riband (40·5 kg grain/kg N taken up; P<0·05; Table 10). Variation from trial to trial was large, NUtE at AFBI Crossnacreevy 1999 being much higher, 55 kg grain/kg N taken up, than in the other trials, but the behaviour of the cultivars in the trials was consistent as indicated by the variance ratios. NUE of the three cultivars across all trials was very similar, 28·3–29·2 kg grain/kg available N (Table 11). As with NUpE and NUtE, NUE showed significant variation from trial to trial but its range overall was much smaller. At AFBI Crossnacreevy and Limavady in 1999, low NUpE combined with high NUtE to give NUE similar to most of the other trials. However, the very high NUpE at Downpatrick in 1998 did lead to higher NUE when combined with the average NUtE in that trial.
NUtE (kg/kg) (grain yield/total N off-take) of wheat cultivars Hereward, Rialto and Riband in 1998 and 1999

NUE (kg/kg) (grain yield/total N availability (N applied+an assumed 70 kg/ha N in the soil)) of wheat cultivars Hereward, Rialto and Riband in 1998 and 1999

NS: not significant.
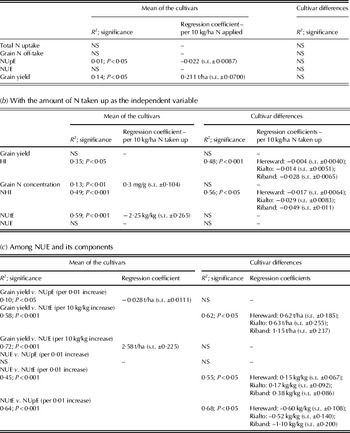
Cultivars and trials are discrete qualitative entities and therefore interpretation and explanation of the results is difficult because they are not quantitatively related. Nitrogen availability to the crop from both soil and fertilizer and N availability within the crop can be thought of as the two primary elements that ‘drive’ NUE and its components. Therefore, the amount of N applied to the trials has been used as an independent variate in regression analysis against which total N uptake, grain N off-take, NUpE, NUE and grain yield were tested (Table 12a). Further regression analysis was used to examine how grain yield, HI, NHI, grain N concentration, NUtE and NUE were related to the total amount of N taken up (Table 12b).
Relationships among the characters determined by regression analysis (excluding Downpatrick in 1998)

NS: not significant.
The amount of N applied as fertilizer varied from 170 to 220 kg/ha across the six trials (excluding Downpatrick in 1998 because of the organic manure applications to this trial), with the three trials at AFBI Crossnacreevy receiving the maximum rate that would have been recommended if RB 209 (Anon 2000) had been available. This represents a substantial range in fertilizer N rate against which total and grain N off-takes and NUpE can be tested. However, the number of trials, six, limits the robustness of the regressions as all cultivars had access to the same amounts of N in each trial.
Total N uptake, grain N off-take and NUE were not related to the amount of fertilizer N applied (Table 12a). NUpE of the crops decreased significantly as fertilizer N rate increased (P<0·05). If it is assumed that similar amounts of soil N were available in all trials (Table 2) then actual recovery of fertilizer N is likely to have decreased as fertilizer N rate increased.
Grain yield increased as fertilizer N rate increased, following the classic response to N (Table 12a). However, this relationship, like that of NUpE with the amount of fertilizer N applied, was weak, even though statistically significant (P<0·05).
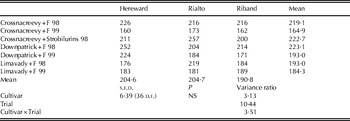
Total N uptake ranged from 160 kg/ha in Hereward at AFBI Crossnacreevy in 1999 to 257 kg/ha in Rialto in the AFBI Crossnacreevy+Strobilurin trial in 1998. The ranges in total N uptake within each cultivar were similar to this for Hereward and Rialto, but Riband had a maximum uptake of 216 kg/ha. Nevertheless, the uptakes for all three cultivars provide a robust base against which the effects of cultivar and trial can be tested using regression analysis (Table 12b).
Partitioning of both biomass (HI) and nitrogen (NHI) to the grain decreased as availability of N within the crop increased, i.e. with higher N applications the crops were less efficient at allocating biomass and N to the grain (Table 12b). Grain yield and NUE were unaffected but grain N concentration increased as total N uptake increased, i.e. efficiency of N use by the grain decreased. NUtE, based on total N uptake as opposed to grain N off-take for which grain N concentration is the measure of efficiency, also decreased with increasing total N uptake. Deteriorating efficiency, as reflected in both increasing grain N concentration and decreasing NUtE, is as would be expected from the lack of response of grain yield to increasing total N uptake.
Since together NUpE and NUtE comprise NUE, for completeness, the relationships of grain yield with NUpE, NUtE and NUE and among NUE and its components were also determined (Table 12c). Grain yield was strongly associated, and increased, with both NUtE and NUE, but was only weakly associated, decreasing, with NUpE. Yields of Riband increased to a greater extent than those of Hereward and Rialto as NUtE increased.
NUE was not associated with NUpE but was strongly associated with NUtE, increasing more rapidly in Riband than in Hereward and Rialto, which had similar responses (Table 12c). NUtE and NUpE were very strongly associated with NUtE of all three cultivars decreasing as NUpE increased but with Riband showing a much greater decrease than Hereward and Rialto.
DISCUSSION
Variation in all the characteristics measured in the present study can be attributed to cultivar, to trial and to differences between the cultivars in their behaviour in the various trials (Tables 3–11). The three cultivars had similar grain yield (Table 3), total N uptake (Table 6), NUpE (Table 7), NHI (Table 9) and NUE (Table 11). Hereward and Rialto had significantly higher grain N concentration (Table 4), grain N off-take (Table 5) but significantly lower HI (Table 8) and NUtE (Table 10) than Riband. Cultivar means for the characteristics are relevant, even though substantive influences of site and season and variation in responses of the cultivars from trial to trial were found for almost all the characteristics. The final outcome of the breeding process is cultivars that have to express their characteristics consistently across a wide range of environments, i.e. site-seasons, in trials. The UK variety evaluation system is designed to distinguish a (potentially) weak genetic influence against the large effects of soils and weather. This is achieved by measuring characteristics in a large number of trials. The mean values provide an index of the cultivars as they progress through the breeding process and the variety evaluation system, even though there may be interactions underlying them.
All the characteristics, apart from grain yield and NUE, varied significantly with increasing total N uptake, confirming the conclusion from the analyses of variance that other factors besides genotype, in this case the amount of N in the crop, influence the efficiency of yield formation processes and utilization of N. The cultivars only differed significantly in their response to total N uptake for HI and NHI, Hereward and Rialto showing similar, and smaller, decreases than Riband in HI and NHI as total N uptake increased. These results are encouraging, confirming that genetic variation exists for some of the characteristics. The lack of difference between the cultivars in the responses of NUtE and NUE to total N uptake does not rule out the possibility that genetic variation exists. Foulkes et al. (Reference Foulkes, Hawkesford, Barraclough, Holdsworth, Kerr, Kightley and Shewry2009) found that the contributions of total N uptake (their AGN), NHI, grain N concentration, NUpE and NUtE to genetic gain in yield were more likely to vary at high N supply than at low N supply. Barraclough et al. (Reference Barraclough, Howarth, Jones, Lopez-Bellido, Parmar, Shepherd and Hawkesford2010) concluded that although cultivar had a smaller effect on yield, grain N concentration, total N uptake and NUtE than N and year, significant genetic variation existed in all the characteristics they discussed.
Grain N concentration (Table 4) was lower than the current 19 mg/g taken as the grain N concentration at which N use is optimal in feed wheat in the Fertilizer Manual (Anon 2010) in eight of the 19 cultivar×site samples. The trial locations fell into a consistent pattern over years, with AFBI Crossnacreevy tending to have low, Downpatrick high grain N concentrations and Limavady grain coming close to the ‘standard’. Interpreting these in terms of efficiency, i.e. where a low grain N concentration corresponds to a high efficiency of use of N and vice versa, suggests that the Downpatrick crops did not use N efficiently, those at Limavady were efficient while those at AFBI Crossnacreevy were very efficient. The application of organic manure in one of the years at Downpatrick may have contributed to higher grain N concentration in that trial. The AFBI Crossnacreevy crops received the rate of fertilizer N that would have been recommended by RB 209 (Anon 2000), had it been available at the time, but they were probably capable of producing higher yields if more N had been available and/or taken up by these crops. Such consistent differences between locations support the use of grain N concentration as a tool in reviewing N management decisions as advocated in the Fertilizer Manual/RB 209 (Anon 2010). The difference of 4 mg/g in grain N concentration at Nopt of wheat grown in Denmark compared with wheat grown in the UK reported by Sylvester-Bradley & Clarke (Reference Sylvester-Bradley and Clarke2009) draws attention to the possibility that grain N concentration at Nopt may vary depending on how growth and development are influenced by weather conditions. Indeed geographic patterns of availability of radiation and rainfall across the British Isles produced by Sylvester-Bradley et al. (Reference Sylvester-Bradley, Foulkes, Reynolds, Sylvester-Bradley and Wiseman2005) illustrate a fundamental contrast between the south-east of England where crops are more likely to be limited by lack of rainfall and crops in Northern Ireland which are more likely to be limited by lack of radiation.
NUpE (Table 7) varied from 0·57 to 0·81 among the six trials, not including the results from the Downpatrick site in 1998 at which an unknown amount of organic manure was applied, and from 0·55 to 0·91 when the cultivars were considered individually. Barraclough et al. (Reference Barraclough, Howarth, Jones, Lopez-Bellido, Parmar, Shepherd and Hawkesford2010) reported similar variation of between 0·63 and 0·78 among cultivars at 200 kg/ha N. Year appeared to have an effect, with NUpE being higher in 1998 than in 1999. Overall, and bearing in mind the assumption being made that an SNS index of 1 provided 70 kg/ha N recovered at 1·00 efficiency, recovery of N in these trials exceeded the assumed recovery of 0·60 for medium soils in RB 209 (Anon 2000) and the Fertilizer Manual (Anon 2010). This is encouraging from an environmental perspective, especially given the relatively high rainfall in Northern Ireland and the consequently greater risk of N leaching. Explanations of the variation in recovery would only be possible with much more information about weather and soil conditions throughout the growing season at each location. However, the existence of such wide variation indicates the potential for understanding recovery of fertilizer N and seeking to achieve higher NUpE through agronomic practices. Foulkes et al. (Reference Foulkes, Hawkesford, Barraclough, Holdsworth, Kerr, Kightley and Shewry2009) identified four crop management practices that could lead to poor N uptake by crops, some of which could be addressed in the future by in-season crop monitoring and improvement of soil health, particularly through increasing soil organic matter.
NHI (Table 9) was very variable, although year differences emerged consistently across the trials, NHI being lower in 1998 than in 1999. Although the cultivars were similar overall, in three of the seven trials their NHI differed by more than a few percent. It is important to note that NHI was higher in the year when uptake of N (Table 7) and total N uptake (Table 6) were lower, and vice versa. Sylvester-Bradley & Kindred (Reference Sylvester-Bradley and Kindred2009) commented that NHI was unlikely to have increased significantly since semi-dwarf cultivars were introduced and reported mean NHIs of 0·710 in ‘old’ cultivars and 0·714 in ‘new’ cultivars across 13 sites. Elsewhere in the paper, Sylvester-Bradley & Kindred (Reference Sylvester-Bradley and Kindred2009) reported that NHI increased from 0·69 to 0·75 in a typical modern wheat cultivar in response to fertilizer N in one trial but then qualified this by stating that associated data, presumably from other trials that were not discussed in such detail, showed that a decrease is more normal. Variation in NHI, such as that found in the present study, reflects the inherent flexibility of crops to adapt to growing conditions and the over-riding influence of the yield formation processes in leading to a higher proportion of N being partitioned to the grain when less N has been taken up by the crop.
NUtE was fairly constant at c. 30–38 kg grain/kg N taken up except for the trials at AFBI Crossnacreevy and Limavady in 1999 (Table 10). The much higher NUtE in these trials was generally associated with lower NUpE (Table 7); although higher NUpE at Downpatrick in 1998 was associated with average NUtE (Table 10). The small differences between the cultivars in their mean NUtE were relatively inconsistent, making it difficult to identify a genetic contribution to improved NUtE. Indeed, Sylvester-Bradley & Kindred (Reference Sylvester-Bradley and Kindred2009) reported experiments in which NUtE was found to be similar in ‘old’ cultivars (34·9 kg grain/kg N taken up) and ‘new’ cultivars (35·3 kg grain/kg N taken up) at Nopt.
Strong positive associations of grain yield with NUE and NUtE and of NUE with NUtE were found (Table 12c). Barraclough et al. (Reference Barraclough, Howarth, Jones, Lopez-Bellido, Parmar, Shepherd and Hawkesford2010) also found a positive correlation between NUtE and yield. Decreasing NUtE as both uptake of N and NUpE increased are expected given the asymptotic response shown by yield to N. Barraclough et al. (Reference Barraclough, Howarth, Jones, Lopez-Bellido, Parmar, Shepherd and Hawkesford2010) reported that, on average, NUtE decreased from 61 to 35 kg grain/kg N taken up at 0 and 350 kg/ha N, respectively. The strong associations of NUtE with total N uptake and NUpE that emerged in the present study serve to emphasize that research into the factors influencing N uptake by crops is a high priority. Total N uptake and the efficiency with which N was recovered were, at most, weakly associated with the amount of N applied. Since there were no measurements of soil mineral N (SMN) the amount of N supplied by the soil has been estimated using the Field Assessment Method in RB 209 (Anon 2000). The amount of N supplied by the soil may have varied beyond the 61–80 kg/ha N notionally indicated by the SNS index of 1 assessed for all the trials. Although the Field Assessment Method is recognized as being of limited value, uncertainty in estimating soil mineral N also abounds, such that crop N uptake when fertilizer N has not been applied is considered to be the best predictor of the SNS. In an analysis of 400 winter cereal trials with zero N treatments, Knight et al. (Reference Knight, Macdonald, Glendining, Whitmore, Dailey, Goulding, Sinclair and Rees2008) reported that ‘crop N uptake varied widely in relation to the amount of SMN present’. These realities lead us to focusing on the factors influencing acquisition of N by the crop as the key driver in our desire to improve the efficiency of N use.
The characteristics/traits that contribute to NUE need to have some heritability if the efficiency of N use is to be improved through breeding. In the trial series reported here, the preponderance of large variance ratios for the cultivar×trial term in the analyses for all characteristics except for grain N concentration indicates that NUE and its components were not strongly genetically determined. Therefore, as for yield, a large number of trials are needed to detect differences among cultivars using their means across all trials. Focusing on N requirement, Kindred & Sylvester-Bradley (Reference Kindred and Sylvester-Bradley2010) stated that conducting variety trials with at least six N rates over many sites and many years was desirable but not feasible with current limited resources. Measuring a number of characteristics, including grain protein, was proposed. Kindred & Sylvester-Bradley (Reference Kindred and Sylvester-Bradley2010) discussed testing at nil N and theorized that N rates just below Nopt would best discriminate between cultivars in their recovery of fertilizer N. In the present study, however, differences between the cultivars became more apparent at higher N uptakes for several of the characteristics, suggesting that trials well supplied with N to ensure that N uptake is high are more likely to provide opportunity of detecting differences between cultivars in the NUE-related characters.
The relative lack of variation in NUtE in these results is disappointing, suggesting that there is limited genetic contribution to this component of NUE. There may not be genes for NUtE, or they may have a weak influence relative to environmental factors. However, it may also be that, like grain yield, NUtE is a ‘high level’ characteristic, the net outcome of the influence and interaction during crop growth and development of several, or indeed many, other characteristics that are genetically controlled. That such a complex genetic control system may exist might not matter. After all, yield has been successfully selected for in the UK over the past 50 years or more by breeders and through the variety evaluation system, although yield increases appear to have been less in recent years (MacKay et al. Reference Mackay, Horwell, Garner, White, Mckee and Philpott2010; Sylvester-Bradley Reference Sylvester-Bradley2010). Increased yield in wheat cultivars has been attributed to increased HI by Austin et al. (Reference Austin, Bingham, Blackwell, Evans, Ford, Morgan and Taylor1980) and in more modern cultivars to increased total biomass production by Shearman et al. (Reference Shearman, Sylvester-Bradley, Scott and Foulkes2005) and White & Wilson (Reference White and Wilson2006) as is also the case in barley (Naylor et al. Reference Naylor, Stokes and Matthews1998). Neither HI nor total biomass production has been actively used by breeders or in the variety evaluation system, yet yield has increased simply because it was prioritized. Therefore, if the aim is to improve NUtE, then selection for NUtE per se throughout the breeding process and in the variety evaluation system may be the most successful strategy.
However, a much more immediate and effective means for identifying and selecting cultivars with improved NUE is readily available. In the HGCA UK Recommended List trial series, cultivars have access to the same available N from the SNS and from fertilizer N in each trial (Anon 2011c). Since grain yield=available N×NUpE×NUtE, grain yield itself is an outcome of NUE in these trials. As NUE is responsive to N and since the available N will vary from trial to trial, a straight mean of yield reflects the influence of many agro-ecological factors, including non-optimal availability of N. NUE therefore needs to be determined either using a standard method or according to a standard criterion. Alternatives could be to compare yield at a standard N application rate (expanding, maybe, to adjust for soil type, market and SNS index as in the Fertilizer Manual, Anon 2010) or at a standard grain N concentration. Since a grain N concentration of 19–20 mg/g, depending on N: grain price ratio, is generally accepted as an indicator of optimal N availability, this could be used as a criterion in using information from the HGCA UK Recommended List trial series to investigate NUE in cultivars. For example, trials could be classified into sub-optimal, optimal and supra-optimal N availability on the basis of the grain N concentrations in selected control cultivars. Average yields for each of these classes of N availability could be compared to identify how N availability influences NUE from cultivar to cultivar. Such a retrospective analysis is in line with how trials data are currently used to identify cultivars suited to specific growing scenarios. Indeed it could be argued that, because yield reflects NUE and is the chief criterion for recommendation, NUE in the UK is already being optimized by grower choice of the most appropriate cultivars for their markets and their growing scenarios based on the HGCA UK Recommended List and associated information.
The author thanks colleagues at AFBI Crossnacreevy who conducted the experiments and colleagues at AFBI who provided comments during writing of this paper.