1 Introduction
Since the seminal works by Fairbrother & Stubbs (Reference Fairbrother and Stubbs1935), Taylor (1961) and Bretherton (1961), gas–liquid flows in capillary tubes have attracted much interest among different scientific communities due to their widespread occurrence in many natural and engineered fluidic systems such as pulmonary flows (Grotberg Reference Grotberg2011), oil extraction (Havre, Stornes & Stray Reference Havre, Stornes and Stray2000; Di Meglio Reference Di Meglio2011), flows in porous media (Lenormand, Zarcone & Sarr Reference Lenormand, Zarcone and Sarr1983; Hirasaki et al. Reference Hirasaki and Lawson1985; Dias & Payatakes Reference Dias and Payatakes1986; Stark & Manga Reference Stark and Manga2000) or microfluidic systems (Gunther et al. Reference Gunther, Khan, Thalmann, Trachsel and Jensen2004; Assmann & von Rohr Reference Assmann and von Rohr2011; Ladosz, Rigger & von Rohr Reference Ladosz, Rigger and von Rohr2016). In particular, liquid plugs (also called bridges, slugs or boluses) play a fundamental role in pulmonary flows where they can form in healthy subjects (Burger & Macklem Reference Burger and Macklem1968; Hughes, Rosenzweig & Kivitz Reference Hughes, Rosenzweig and Kivitz1970) or in pathological conditions (Weiss et al. Reference Weiss, Faling, Mintz, Brooks, Chodosh and Segal1969; Griese, Birrer & Demirsoy Reference Griese, Birrer and Demirsoy1997; Wright et al. Reference Wright, Hockey, Enhorning, Strong, Reid, Holgate, Djukanovic and Postle2000; Hohlfeld Reference Hohlfeld2001) due to a capillary or elasto-capillary instability (Kamm & Schroter Reference Kamm and Schroter1989; White & Heil Reference White and Heil2005; Duclaux & Quéré Reference Duclaux, Clanet and Quéré2006; Heil, Hazel & Smith Reference Heil, Hazel and Smith2008; Grotberg Reference Grotberg2011; Dietze & Ruyer-Quil Reference Dietze and Ruyer-Quil2015). For patients suffering from pulmonary obstructive diseases, these occluding plugs may dramatically alter the distribution of air in the lungs, hence leading to severe breathing difficulties.
Conversely, liquid plugs can be used for therapeutic purpose (Van’t Veen et al. Reference Van’t Veen, Wollmer, Nilsson, Gommers, Mouton, Kooij and Lachmann1998; Nimmo et al. Reference Nimmo, Carstairs, Patole, Whitehall, Davidson and Vink2002): boluses of surfactant are injected inside the lungs of prematurely born infants to compensate for their lack and improve ventilation (Engle et al. Reference Engle2008; Barber & Blaisdell Reference Barber and Blaisdell2010). A thorough understanding of liquid plug dynamics is therefore mandatory to improve treatment of both patients suffering from obstructive pulmonary diseases and of prematurely born infants.
When a liquid plug moves inside a cylindrical airway at low capillary number, deformation of the front and rear menisci occurs near the walls and leads to interfacial pressure jumps at the front and rear interfaces. This deformation also leads to the deposition of a liquid film on the walls. From a theoretical point of view, Bretherton (1961) was the first to provide an estimation of the pressure jump and the thickness of the liquid layer at asymptotically low capillary numbers. Bretherton’s analysis was later formalised in the framework of matched asymptotic expansions by Park & Homsy (Reference Park and Homsy1984) who extended this work to higher-order developments. Later on, the dynamics of a meniscus moving on a dry capillary tube was studied both experimentally and theoretically by Hoffman (Reference Hoffman1975) and Tanner (Reference Tanner1979).
These pioneering results were later extended to unfold the effects of wall elasticity (Howell, Waters & Grotberg Reference Howell, Waters and Grotberg2000), the behaviour at larger capillary numbers (Aussillous & Quéré Reference Aussillous and Quéré2000; Klaseboer, Gupta & Manica Reference Klaseboer, Gupta and Manica2014), the effects of surfactants (Waters & Grotberg Reference Waters and Grotberg2002), the role of a microscopic or macroscopic precursor film (Jensen Reference Jensen2000; Chebbi Reference Chebbi2003), the influence of more complex tube geometries (Wong, Radke & Morris Reference Wong, Radke and Morris1995a ,Reference Wong, Radke and Morris b ; Hazel & Heil Reference Hazel and Heil2002), the influence of gravity (Suresh & Grotberg Reference Suresh and Grotberg2005; Zheng, Fujioka & Grotberg Reference Zheng, Fujioka and Grotberg2007) or the influence of non-Newtonian properties of the liquid (Guttfinger & Tallmadge Reference Guttfinger and Tallmadge1965; Hewson, Kapur & Gaskell Reference Hewson, Kapur and Gaskell2009; Jalaal & Balmforth Reference Jalaal and Balmforth2016; Laborie et al. Reference Laborie, Rouyer, Angelescu and Lorenceau2017). These key ingredients have then been combined with conservation laws determining the evolution of plug size and estimation of the pressure jump in the bulk of the plug to provide analytical models of the unsteady dynamics of liquid plugs in capillary tubes (Baudoin et al. Reference Baudoin, Song, Manneville and Baroud2013; Fujioka et al. Reference Fujioka, Halpern, Ryans and Gaver2016; Magniez et al. Reference Magniez, Baudoin, Liu and Zoueshtiagh2016). In particular, Baudoin et al. (Reference Baudoin, Song, Manneville and Baroud2013) introduced the long range and short range interactions between plugs to simulate the collective behaviour of a train of liquid plugs. These models were in turn used to determine the critical pressure head required to rupture a liquid plug in a compliant (Howell et al. Reference Howell, Waters and Grotberg2000) or rigid prewetted capillary tube (Magniez et al. Reference Magniez, Baudoin, Liu and Zoueshtiagh2016), or determine the maximum stresses exerted on the walls (Fujioka et al. Reference Fujioka, Halpern, Ryans and Gaver2016), a fundamental problem for lung injury produced by the presence of liquid plugs in the lung.
It is interesting to note that the dynamics of bubbles (Bretherton 1961; Ratulowski & Chang Reference Ratulowski and Chang1989; Fries, Trachsel & von Rohr Reference Fries, Trachsel and von Rohr2008; Warnier et al. Reference Warnier, De Croon, Rebrov and Schouten2010) and liquid plugs in capillary tubes looks similar from a theoretical point of view, since the interfacial pressure jumps and the deposition of a liquid film on the walls induced by the dynamical deformation of the interfaces can be calculated with the same formula. Nevertheless, there are also fundamental differences, which lead to very different dynamics: trains of bubble are pushed by a liquid finger whose viscous resistance to the flow is generally higher than the resistance induced by the presence of the bubble. In this case, a pressure driven flow is stable and the flow rate remains essentially constant over time. In the case of liquid plugs, the resistance of the plugs to motion is higher than that of the air in front of and behind the plug. This leads to an unstable behaviour with an acceleration and rupture of the plugs (Baudoin et al. Reference Baudoin, Song, Manneville and Baroud2013) or a deceleration and the obstruction of the airways (Magniez et al. Reference Magniez, Baudoin, Liu and Zoueshtiagh2016).
From an experimental point of view, Bretherton’s interfacial laws have been extensively verified for different systems (bubbles, liquid fingers, foams
 $,\ldots$
). Nevertheless, there have been few attempts to compare the unstable dynamics of single or multiple plugs in capillary tubes to models accounting for the interface and bulk pressure jumps along with mass balance. Baudoin et al. (Reference Baudoin, Song, Manneville and Baroud2013) showed that their model was able to qualitatively predict the collective accelerative dynamics of multiple plugs in rectangular microfluidic channels. More recently, Magniez et al. (Reference Magniez, Baudoin, Liu and Zoueshtiagh2016) were able to quantitatively reproduce the acceleration and deceleration of a single liquid plug in a prewetted capillary tube. Their model further provided the critical pressure below which the plug slows down and thickens whereas above it accelerates and ruptures. These experiments were particularly challenging owing to the complexity of controlling the prewetting film thickness and performing the experiments before the occurrence of Rayleigh–Plateau instability. Huh et al. (Reference Huh, Fujioka, Tung, Futai, Paine, Grotberg and Takayama2007) measured in realistic experiments the injury caused by the motion of liquid plugs on human airway epithelia deposited at the surface of an engineered microfluidic airway. Later on, Zheng et al. (Reference Zheng, Fujioka, Bian, Torisawa, Huh, Takayama and Grotberg2009) quantified the deformation of the walls induced by the propagation of a liquid plug in a flexible microchannel. Song et al. (Reference Song, Baudoin, Manneville and Baroud2011) employed microfluidic techniques to investigate single liquid plug flow in a tree geometry and evidenced the role of the forcing condition on the flow pattern. Finally, Hu et al. (Reference Hu, Bian, Grotberg, Filoche, White, Takayama and Grotberg2015) studied the rupture of a mucus-like liquid plug in a small microfluidic channel.
From a numerical point of view, simulations of liquid plugs in capillary tubes are highly challenging. Indeed, the thin layer of liquid left on the walls requires either adaptive mesh or the use of boundary integral methods to reduce the computational costs. Moreover, the unstable dynamics of the plugs pushed at constant pressure head leads to high variability in the associated characteristic times. Fujioka & Grotberg (Reference Fujioka and Grotberg2004) were the first to provide numerical simulations of the steady dynamics of a liquid plug in a two-dimensional channel. Later on, they studied the effects of surfactants (Fujioka & Grotberg Reference Fujioka and Grotberg2005), the unsteady propagation (Fujioka, Takayama & Grotberg Reference Fujioka, Takayama and Grotberg2008) in an axisymmetric tube, the effects of gravity (Zheng et al. Reference Zheng, Fujioka and Grotberg2007), the role played by the tube’s flexibility (Zheng et al. Reference Zheng, Fujioka, Bian, Torisawa, Huh, Takayama and Grotberg2009) and the motion of Bingham liquid plugs (Zamankhan et al. Reference Zamankhan, Helenbrook, Takayama and Grotberg2012). More recently, Vaughan & Grotberg (Reference Vaughan and Grotberg2016) studied numerically the splitting of a two-dimensional liquid plug at an airway bifurcation.
In all of the aforementioned theoretical, experimental and numerical studies, the liquid plugs are pushed either at constant flow rate or at constant pressure head in a single direction. These driving conditions substantially differ from those in the lung where a liquid plug will experience periodic forcing. In this paper, we investigate both experimentally and theoretically the response of liquid plugs to cyclic and periodic pressure or flow rate forcing. The experiments are conducted in straight cylindrical glass capillary tubes and compared to an extended theoretical model based on previous developments by Baudoin et al. (Reference Baudoin, Song, Manneville and Baroud2013) and Magniez et al. (Reference Magniez, Baudoin, Liu and Zoueshtiagh2016). It is shown that, depending on the type of forcing (flow rate or pressure cycle), the dynamics of the liquid plug can either be periodic with the reproduction of the same cyclic motion over time, or accelerative, eventually leading to plug rupture. In particular, this study discloses the central hysteretic role played by the liquid film deposition on the plug dynamics.
The paper is organised as follows. In § 2 we describe the experimental set-up and the mathematical model. Section 3 is dedicated to the comparison of different type of forcings: pressure head and flow rate. In § 4, we compare the efficiency of cyclic and unidirectional forcings for obstructed airways reopening. Finally, concluding remarks and future prospects are provided in § 5.
2 Methods
2.1 Experimental set-up
(a) Sketch of the experimental set-up. (b) First half-cycle: the liquid plug moves on a dry capillary tube. (c) Following back and forth motions: the liquid plug moves on a prewetted capillary tube.
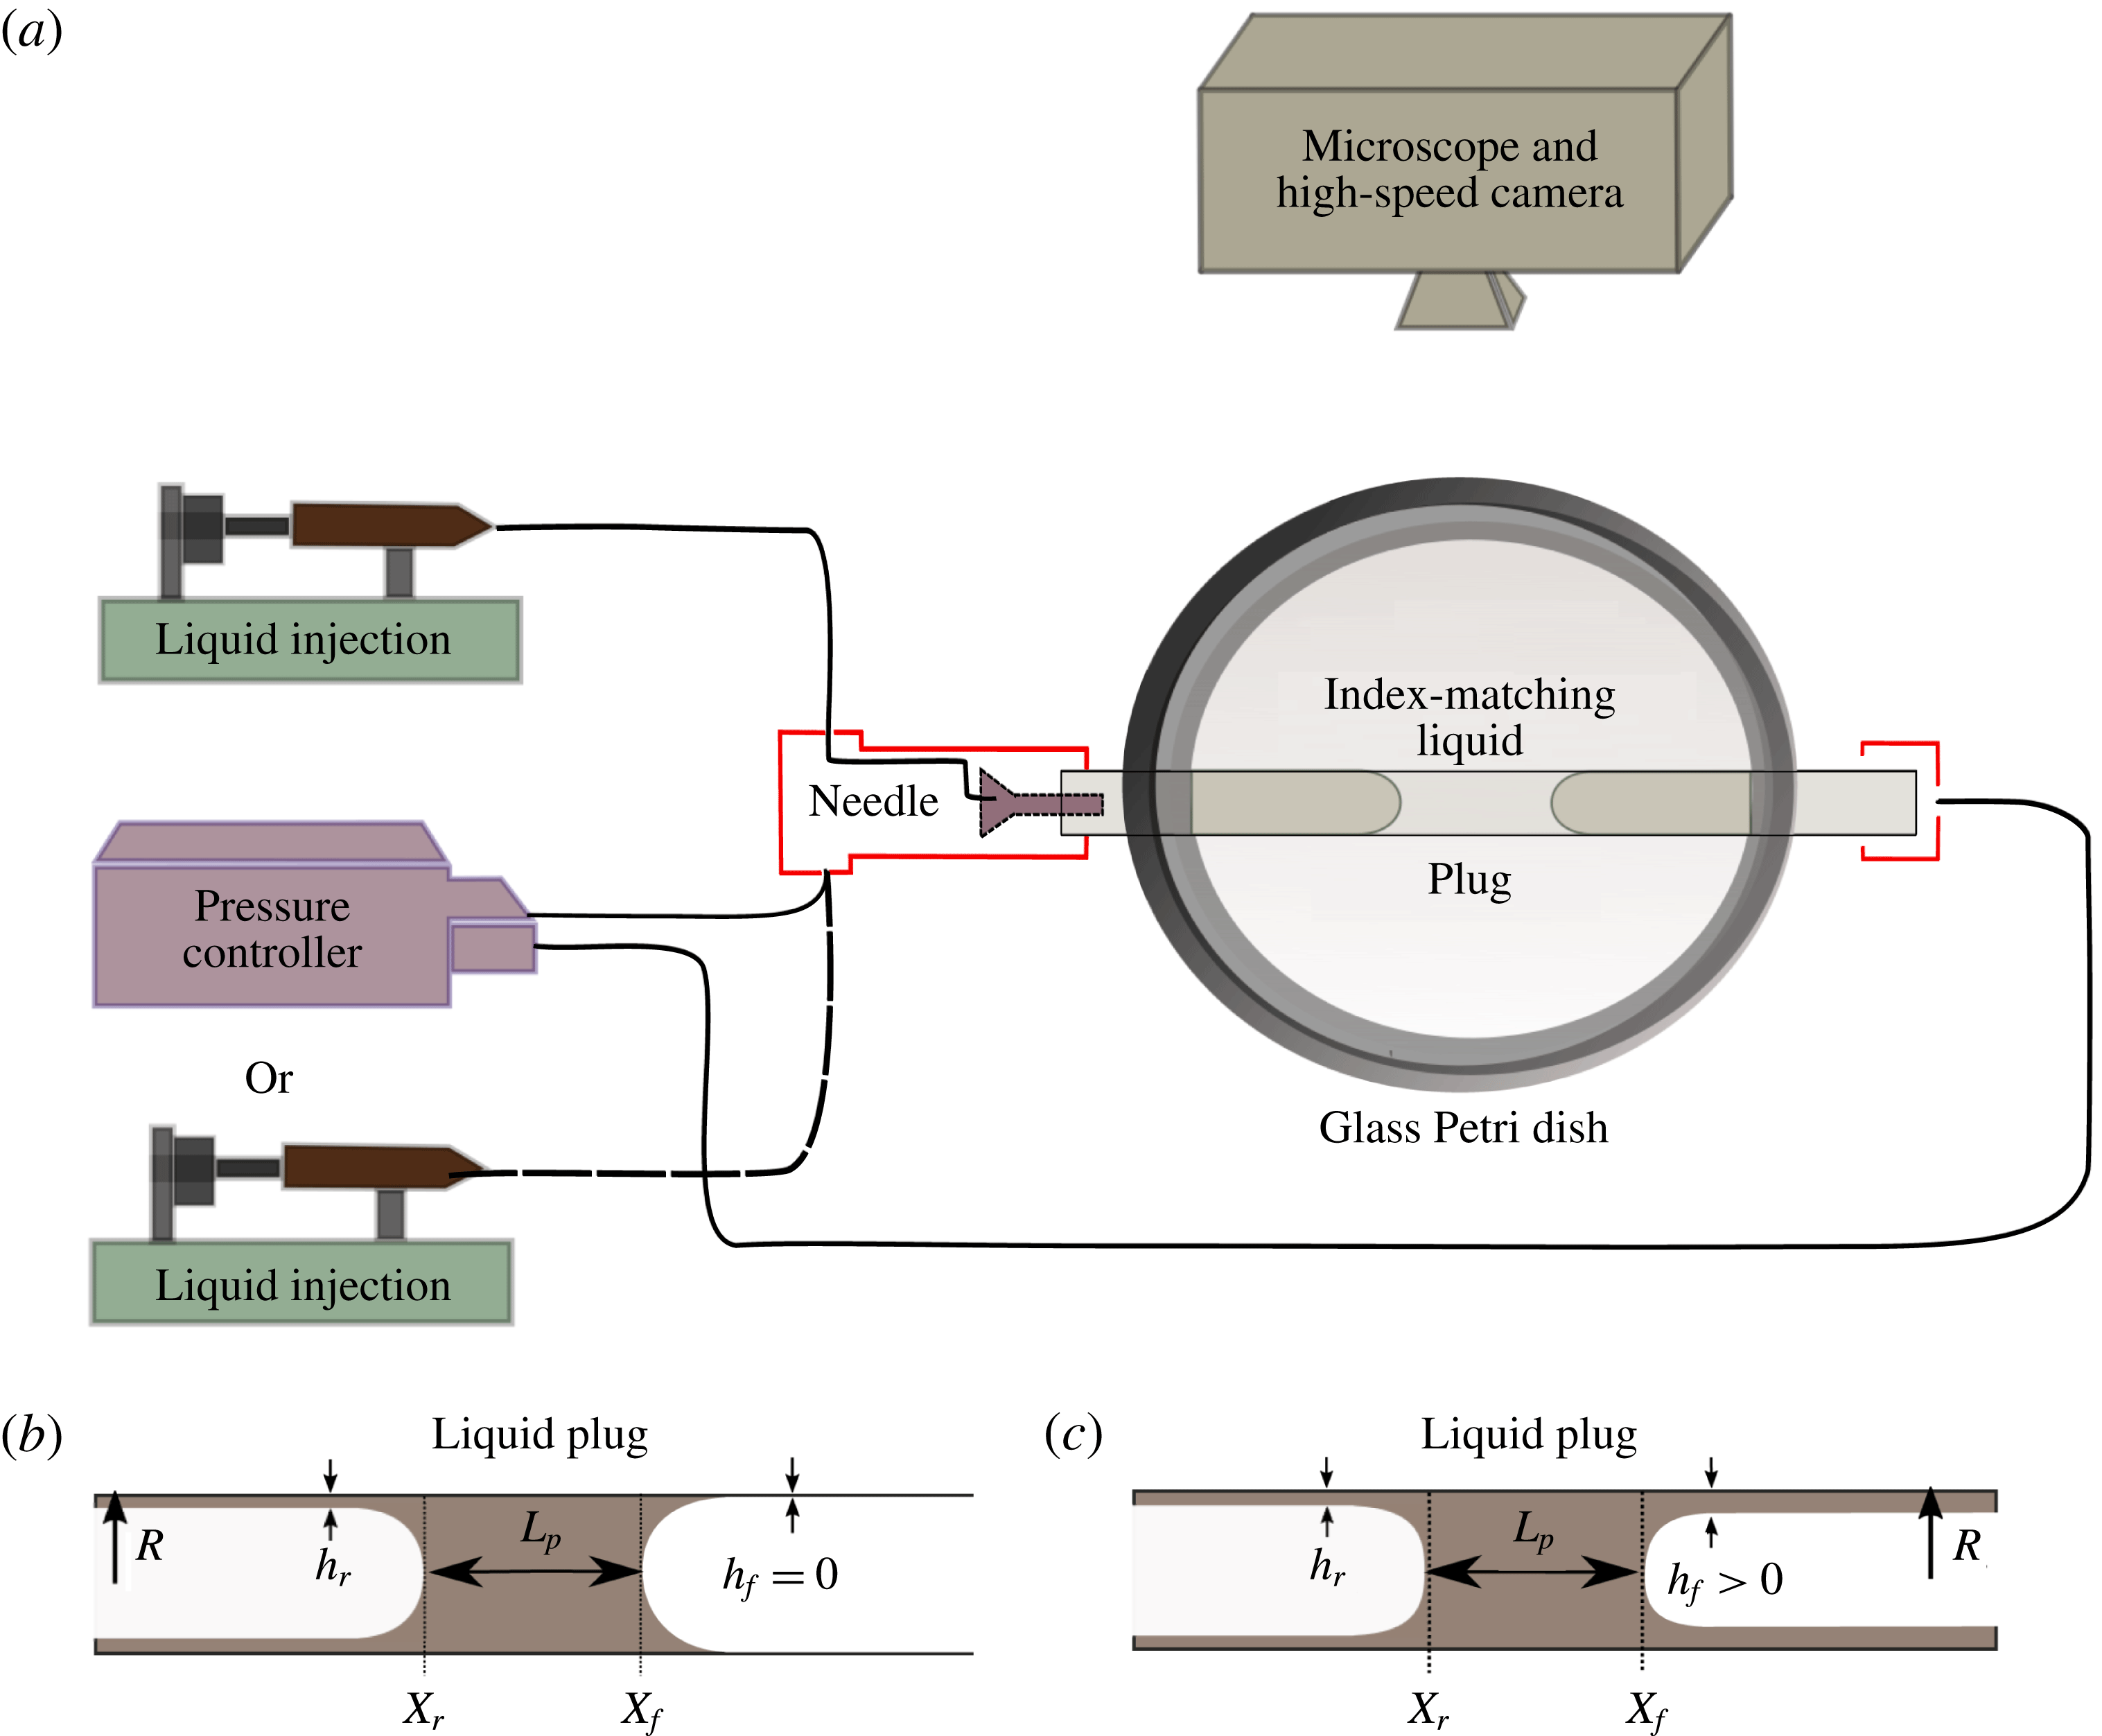
A schematic of the experimental set-up is provided in figure 1(a). A perfluorodecalin liquid plug of controlled volume is injected through a needle inside a rigid horizontal cylindrical glass capillary tube (inner radius
 $R=470~\unicode[STIX]{x03BC}\text{m}$
). Then, air is blown at a low flow rate (
 $Q=10~\unicode[STIX]{x03BC}\text{l}~\text{min}^{-1}$
) to bring the liquid plug to the centre of the channel and stopped manually when the plug reaches the target position. Thus, depending on the size of the liquid plug, the creation step can take up to 10 s. Finally, liquid plugs are moved back and forth with either pressure or flow rate cyclic forcings enforced respectively with a MFCS Fluigent pressure controller or a KdScientific 210 programmable syringe pump. For both pressure driven and flow rate driven experiments, the period of oscillation is fixed at
 $2T=4~\text{s}$
, with
 $T$
the duration of the motion in one direction. It is important to note that during the first half-cycle,
 $t\in [0,T]$
, the liquid plug moves along a dry capillary tube (figure 1
b). The motion of the plug leads to the deposition of a trailing film on the walls of thickness
 $h_{r}$
behind the rear meniscus at position
 $X_{r}(t)$
. Thus, in the subsequent back and forth motion, the front interface of the liquid plug moves on walls prewetted by a layer of thickness
 $h_{f}(X_{f})$
(with
 $X_{f}(t)=X_{r}(t)+L_{p}(t)$
the position of the front meniscus and
 $L_{p}(t)$
the plug length) as long as it remains on a portion of the channel already visited by the liquid plug (figure 1
c) in a previous half-cycle.
The glass tubes were cleaned prior to the experiments with acetone, isopropanol, dichloromethane and piranha solutions (a mixture of sulphuric acid (
 $\text{H}_{2}\text{SO}_{4}$
) and hydrogen peroxide (
 $\text{H}_{2}\text{O}_{2}$
)) successively to obtain a perfectly wetting surface and prevent dewetting induced by the presence of dust or organic contaminants on the surface. Perfluorodecalin (dynamic viscosity
 $\unicode[STIX]{x1D707}=5.1\times 10^{-3}~\text{Pa}~\text{s}$
, surface tension
 $\unicode[STIX]{x1D70E}=19.3\times 10^{-3}~\text{N}~\text{m}^{-1}$
and density
 $\unicode[STIX]{x1D70C}=1.9\times 10^{-3}~\text{kg}~\text{m}^{-3}$
) was chosen for its good wetting properties and inertness. Experiments are recorded using a Photron SA3 high speed camera mounted on a Z16 Leica microscope at a frame rate of
 $125$
images per second, a trigger time of
 $1/3000~\text{s}$
and a resolution of
 $1024\times 64$
pixels. To prevent image deformation due to the cylindrical shape of the capillary tube, it is immersed in an index-matching liquid. The image analysis is then performed using ImageJ software and MATLAB.
2.2 Dimensional analysis of the problem
The characteristic parameters in this problem are the radius of the tube
 $R$
, the surface tension
 $\unicode[STIX]{x1D70E}$
, the liquid density
 $\unicode[STIX]{x1D70C}$
and viscosity
 $\unicode[STIX]{x1D707}$
and the characteristic speed
 $U$
of the liquid plug. From these parameters, one can derive the characteristic convection time
 $\unicode[STIX]{x1D70F}_{c}=R/U$
, the characteristic viscous diffusion time
 $\unicode[STIX]{x1D70F}_{v}=\unicode[STIX]{x1D70C}R^{2}/\unicode[STIX]{x1D707}$
, the Reynolds number
 $Re=\unicode[STIX]{x1D70C}UR/\unicode[STIX]{x1D707}$
(comparing inertia to viscous diffusion), the capillary number
 $Ca=\unicode[STIX]{x1D707}U/\unicode[STIX]{x1D70E}$
(comparing viscous diffusion to surface tension), the Bond number
 $Bo=\unicode[STIX]{x0394}\unicode[STIX]{x1D70C}gR^{2}/\unicode[STIX]{x1D70E}$
(comparing gravity effects to surface tension) and finally the Weber number
 $We=\unicode[STIX]{x0394}\unicode[STIX]{x1D70C}U^{2}R/\unicode[STIX]{x1D70E}$
(comparing inertia to surface tension). Table 1 summarises the maximum values of these key dimensionless parameters based on the maximal velocity of the liquid plug
 $U_{m}=28~\text{mm}~\text{s}^{-1}$
observed in the present experiments.
Based on the order of magnitude of these dimensionless parameters, a few primary insights can be drawn. The low Bond number and the horizontal position of the tube suggest weak effect of gravity in this problem. The flow in the bulk of the plug remains laminar owing to the moderate values of the Reynolds number. In addition, Aussillous & Quéré (Reference Aussillous and Quéré2000) studied the impact of inertia on the deposition of a trailing liquid film behind a moving liquid plug. From dimensional analysis and experiments, they introduced a critical capillary number
 $Ca_{c}$
(equal to
 $3.6\times 10^{-1}$
in the present case) above which the effect of inertia becomes significant. In the present experiments, the capillary number is two orders of magnitude smaller than this critical value and thus inertia can be neglected in the film deposition process. Finally, Kreutzer et al. (Reference Kreutzer, Kapteijn, Moulijn, Kleijn and Heiszwolf2005) studied numerically the influence of inertia on pressure drops at liquid/air interfaces. They showed that inertia plays no role for
 $Re<10$
at capillary numbers comparable to the present study. Thus, inertial effects can safely be neglected here. Furthermore, the weak capillary and Weber numbers indicate that surface tension is globally dominant over viscous stresses and inertia. Nevertheless, it is to be emphasised that viscous effects must still be accounted for close to the walls, in the so-called ‘dynamic meniscus’ that is the part of the meniscus deformed by viscous stresses. Finally, since the convection and viscous diffusion times
 $\unicode[STIX]{x1D70F}_{c}$
and
 $\unicode[STIX]{x1D70F}_{v}$
are two orders of magnitude smaller than the duration of the pressure or flow rate cycles, the unsteady term in Navier–Stokes equation can be neglected and the flow can be considered as quasi-static.
Another phenomenon that may occur during the plug motion is the destabilisation of the trailing liquid film due to a Rayleigh–Plateau instability. The characteristic time associated with the most unstable mode is given by the following formula (Chandrasekhar Reference Chandrasekhar1961; Eggers Reference Eggers1997):
 $$\begin{eqnarray}\displaystyle \unicode[STIX]{x1D70F}_{RP}=\frac{12\unicode[STIX]{x1D707}R^{4}}{\unicode[STIX]{x1D70E}h^{3}}. & & \displaystyle\end{eqnarray}$$
The smallest destabilisation times are thus obtained for the thickest fluid layer. In the experiments conducted in this paper, the thickness of the liquid film remains typically smaller than 5 % of the tube radius leading to
 $\unicode[STIX]{x1D70F}_{RP}=13~\text{s}$
, whose value remains significantly larger than the period of the plug motion (
 $2T=4~\text{s}$
). In addition, this time grows rapidly (
 $\propto 1/h^{3}$
) when the thickness of the layer is decreased (
 $\unicode[STIX]{x1D70F}_{RP}=58~\text{s}$
for
 $h/R=3\,\%$
) and thick films are only deposited close to the plug rupture in the pressure driven experiments so that the destabilisation of the trailing film is expected to play a minor role in the following experiments.
Values of the key parameters associated with the maximal velocity
 $U_{m}$
.

2.3 Model: pressure driven forcing
In the above context, the liquid plug dynamics can be predicted from a quasi-static pressure balance and a mass balance. We thus adapted a visco-capillary quasi-static model previously introduced by Magniez et al. (Reference Magniez, Baudoin, Liu and Zoueshtiagh2016) to include the motion on both dry and prewetted portions of the tube and also the memory effects resulting from a trailing liquid film deposition. Assuming that the pressure losses in the gas phase are negligible compared to that induced by the liquid plug, the total pressure jump
 $\unicode[STIX]{x0394}P_{t}$
across a liquid plug can be decomposed into the sum of the pressure jump induced by the presence of the rear interface
 $\unicode[STIX]{x0394}P_{rear}^{int}$
, the front interface
 $\unicode[STIX]{x0394}P_{front}^{int}$
and the flow in the bulk of the plug
 $\unicode[STIX]{x0394}P_{visc}^{bulk}$
:
 $$\begin{eqnarray}\unicode[STIX]{x0394}P_{t}=\unicode[STIX]{x0394}P_{visc}^{bulk}+\unicode[STIX]{x0394}P_{rear}^{int}+\unicode[STIX]{x0394}P_{front}^{int}.\end{eqnarray}$$
In the experiments,
 $\unicode[STIX]{x0394}P_{t}$
corresponds to the driving pressure head.
Since the flow is laminar, the viscous pressure drop in the bulk of the plug can be estimated from Poiseuille’s law:
 $$\begin{eqnarray}\unicode[STIX]{x0394}P_{visc}^{bulk}=\frac{8\unicode[STIX]{x1D707}L_{p}U}{R^{2}},\end{eqnarray}$$
with
 $L_{p}$
, the plug length, that is to say the distance between the front and rear meniscus
 $L_{p}(t)=X_{f}(t)-X_{r}(t)$
as described in figure 1 and
 $U=\text{d}X_{r}/\text{d}t$
the liquid plug velocity. This expression relies on two approximations: (i) it assumes a Poiseuille flow structure and thus neglects the fluid recirculation occurring close to the menisci and (ii) it assumes the same speed for the rear and front interfaces. The validity of the first approximation has been tested with direct numerical simulations performed with a volume of fluid (VOF) method (see appendix B). As expected, the accuracy of this approximated formula decreases with the size of the plug. Nevertheless, the difference between approximated and computed values remains below 4.5 % for plugs larger than the tube diameter and below 25 % for plugs larger than
 $1/4$
of the tube diameter. The approximation is therefore consistent for a large plug. The larger discrepancy observed for smaller plugs is not critical since in this case the interfacial pressure drops at the rear and front interfaces are largely dominant over the viscous one. We verified the consistency of the second approximation experimentally by measuring the difference between the front and rear interface speeds. These measurements show that the speed of the two menisci only differ by a few per cent. The reason is that the evolution of the plug size
 $\text{d}L_{p}/\text{d}t$
remains much smaller than the plug velocity
 $\text{d}X_{r}/\text{d}t$
for the essential part of the plug dynamics. In the following, we keep this assumption (front and rear interfaces velocities approximatively equal) to evaluate the interfacial pressure jump).
Since the capillary, Bond and Reynolds numbers are small and the flow is quasi-static (see § 2.2), the pressure drop across the rear interface of the moving liquid plug can be estimated from Bretherton’s formula (Bretherton 1961):
 $$\begin{eqnarray}\unicode[STIX]{x0394}P_{rear}^{int}=\frac{2\unicode[STIX]{x1D70E}}{R}(1+1.79(3Ca)^{2/3}).\end{eqnarray}$$
Finally, the Laplace pressure drop across the front meniscus depends on the apparent dynamic contact angle
 $\unicode[STIX]{x1D703}_{d}^{a}$
according to the formula (in the limit of low capillary number and thus
 $\unicode[STIX]{x1D703}_{d}^{a}$
):
 $$\begin{eqnarray}\unicode[STIX]{x0394}P_{front}^{int}=-\frac{2\unicode[STIX]{x1D70E}\cos \unicode[STIX]{x1D703}_{d}^{a}}{R}\approx -\frac{2\unicode[STIX]{x1D70E}(1-{\unicode[STIX]{x1D703}_{d}^{a}}^{2}/2)}{R}.\end{eqnarray}$$
Choosing the Laplace pressure jump
 $2\unicode[STIX]{x1D70E}/R$
as the characteristic pressure scale, and the tube radius
 $R$
as the characteristic length scale, the dimensionless pressure jump across the liquid plug becomes
 $$\begin{eqnarray}\unicode[STIX]{x0394}\tilde{P_{t}}=4\tilde{L_{p}}Ca+1.79(3Ca)^{2/3}+\frac{{\unicode[STIX]{x1D703}_{d}^{a}}^{2}}{2}.\end{eqnarray}$$
A tilde indicates dimensionless functions.
In order to achieve a closed set of equation, two additional equations must be derived. They are (i) the relation between the apparent dynamic contact angle of the front meniscus
 $\unicode[STIX]{x1D703}_{d}^{a}$
and the capillary number
 $Ca$
and (ii) an equation determining the evolution of the plug length
 $\tilde{L_{p}}$
. The first relation depends on the wetting state of the tube walls ahead of the liquid plug, as follows.
When the liquid plug moves on a dry substrate, this relation is given by Hoffman–Tanner’s law valid at low capillary numbers:
 $$\begin{eqnarray}\unicode[STIX]{x1D703}_{d}^{a}=ECa^{1/3},\end{eqnarray}$$
with
 $E$
a numerical constant of the order of 4–5 for a dry cylindrical capillary tube as reported by Hoffman (Reference Hoffman1975) and Tanner (Reference Tanner1979). For a liquid plug moving on a prewetted substrate,
 $\unicode[STIX]{x1D703}_{d}^{a}$
can be calculated from Chebbi’s law (Chebbi Reference Chebbi2003), which can be simplified at low capillary number through a second-order Taylor expansion (Magniez et al.
Reference Magniez, Baudoin, Liu and Zoueshtiagh2016):
 $$\begin{eqnarray}\unicode[STIX]{x1D703}_{d}^{a}=\frac{-1+\sqrt{1+4CD}}{2C},\end{eqnarray}$$
with
 $$\begin{eqnarray}\displaystyle & \displaystyle A=(3Ca)^{-2/3}\tilde{h_{f}}, & \displaystyle\end{eqnarray}$$
 $$\begin{eqnarray}\displaystyle & \displaystyle B=(3Ca)^{1/3}, & \displaystyle\end{eqnarray}$$
 $$\begin{eqnarray}\displaystyle & \displaystyle C=\frac{1}{\log (10)}\left(\frac{b_{1}}{2}+b_{2}\log _{10}(A)+\frac{3b_{3}}{2}[\log _{10}A]^{2}\right)B, & \displaystyle\end{eqnarray}$$
 $$\begin{eqnarray}\displaystyle & \displaystyle D=(b_{0}+b_{1}\log _{10}(A)+b_{2}[\log _{10}(A)]^{2}+b_{3}[\log _{10}(A)]^{3})B, & \displaystyle\end{eqnarray}$$
 $$\begin{eqnarray}\displaystyle b_{0}\approx 1.4,\quad b_{1}\approx -0.59,\quad b_{2}\approx -3.2\times 10^{-2}\quad \text{and}\quad b_{3}\approx 3.1\times 10^{-3}. & & \displaystyle\end{eqnarray}$$
Since
 $CD\ll 1$
at low capillary number (in the present experiments
 $CD<5\times 10^{-2}$
), this equation can further be simplified into
 $$\begin{eqnarray}\unicode[STIX]{x1D703}_{a}^{d}=D=FCa^{1/3},\end{eqnarray}$$
with
 $F=3^{1/3}(b_{0}+b_{1}\log _{10}(A)+b_{2}[\log _{10}(A)]^{2}+b_{3}[\log _{10}(A)]^{3})$
.
The next step is to determine the dimensionless plug length
 $\tilde{L_{p}}$
. A simple mass balance between the fluid collected from the fluid layer lying ahead the plug (of thickness
 $h_{f}$
) and the trailing liquid film (of thickness
 $h_{r}$
) deposited behind the plug gives
 $$\begin{eqnarray}\text{d}V=(\unicode[STIX]{x03C0}R^{2}-\unicode[STIX]{x03C0}(R-h_{f})^{2})\,\text{d}X_{f}-(\unicode[STIX]{x03C0}R^{2}-\unicode[STIX]{x03C0}(R-h_{r})^{2})\,\text{d}X_{r},\end{eqnarray}$$
with
 $V=\unicode[STIX]{x03C0}R^{2}L_{p}$
the volume of the plug. Finally, with
 $\text{d}X_{r}=U\,\text{d}t$
and
 $\text{d}X_{f}=((R-h_{r})^{2}/(R-h_{f})^{2})\,\text{d}X_{r}$
, we obtain
 $$\begin{eqnarray}\frac{\text{d}L_{p}}{\text{d}t}=\left[\frac{(R-h_{r})^{2}}{(R-h_{f})^{2}}-1\right]U.\end{eqnarray}$$
Using the capillary time scale,
 $\unicode[STIX]{x1D707}R/\unicode[STIX]{x1D70E}$
, as the characteristic time scale, this equation can be rewritten in the dimensionless form
 $$\begin{eqnarray}\frac{\text{d}\tilde{L_{p}}}{\text{d}\tilde{t}}=\left[\frac{(1-\tilde{h_{r}})^{2}}{(1-\tilde{h_{f}})^{2}}-1\right]Ca.\end{eqnarray}$$
The last essential point is to determine the thicknesses of the liquid film lying in front of and left behind the liquid plug
 $h_{r}$
and
 $h_{f}$
respectively. The thickness of the trailing film can be calculated from an extension of Bretherthon’s law introduced by Aussillous & Quéré (Reference Aussillous and Quéré2000). This thickness only depends on the velocity of the plug
 $U$
, that is to say in dimensionless form only on the capillary number
 $Ca$
:
 $$\begin{eqnarray}\tilde{h_{r}}=\frac{1.34Ca^{2/3}}{1+2.5\times 1.34Ca^{2/3}}.\end{eqnarray}$$
Finally, the thickness
 $\tilde{h_{f}}$
depends on the history of the plug motion. Indeed, the capillary tube is initially dry. Thus, for a cyclic motion, the liquid film lying ahead of the plug at position
 $X_{f}^{N}$
during the half-cycle
 $N$
comes from the deposition of a trailing film behind the plug at the same position
 $X_{r}^{N-1}=X_{f}^{N}$
during the half-cycle
 $N-1$
. In order to determine
 $\tilde{h_{f}}$
, the thickness of the liquid film deposited on the walls must therefore be kept in memory and then taken as an entry when the plug moves back to the same location. If the plug moves to a location never visited before, then the tube is dry,
 $\tilde{h_{f}}=0$
, and the pressure jump for the front interface corresponds to the dry version. This analysis shows that the liquid film acts as a memory of the liquid plug motion. Nevertheless, each back and forth motion of the liquid plug prescribes new values of the liquid film thickness. This means that this memory is a short term memory whose lifetime is a half-cycle.
To summarise, the complete nonlinear system of equations that need to be solved to determine the evolution of the plug is
 $$\begin{eqnarray}\displaystyle & \displaystyle \unicode[STIX]{x0394}\tilde{P_{t}}=\left\{\begin{array}{@{}ll@{}}4\tilde{L_{p}}Ca+\left(3.72+\displaystyle \frac{E^{2}}{2}\right)Ca^{2/3},\quad & \text{if dry},\\ 4\tilde{L_{p}}Ca+\left(3.72+\displaystyle \frac{F^{2}}{2}\right)Ca^{2/3},\quad & \text{if prewetted},\end{array}\right. & \displaystyle\end{eqnarray}$$
 $$\begin{eqnarray}\displaystyle & \displaystyle F=3^{1/3}(b_{0}+b_{1}\log _{10}(A)+b_{2}[\log _{10}(A)]^{2}+b_{3}[\log _{10}(A)]^{3}), & \displaystyle\end{eqnarray}$$
 $$\begin{eqnarray}\displaystyle & \displaystyle A=(3Ca)^{-2/3}\tilde{h_{f}}, & \displaystyle\end{eqnarray}$$
 $$\begin{eqnarray}\displaystyle \frac{\text{d}\tilde{X_{r}}}{\text{d}\tilde{t}}=Ca,\quad \tilde{X_{f}}=\tilde{X_{r}}+\tilde{L_{p}}, & & \displaystyle\end{eqnarray}$$
 $$\begin{eqnarray}\displaystyle & \displaystyle \frac{\text{d}\tilde{L_{p}}}{\text{d}\tilde{t}}=\left[\frac{(1-\tilde{h_{r}})^{2}}{(1-\tilde{h_{f}})^{2}}-1\right]Ca, & \displaystyle\end{eqnarray}$$
 $$\begin{eqnarray}\displaystyle & \displaystyle \tilde{h_{r}}=\frac{1.34Ca^{2/3}}{1+2.5\times 1.34Ca^{2/3}}, & \displaystyle\end{eqnarray}$$
 $$\begin{eqnarray}\displaystyle & \displaystyle \tilde{h_{f}}(\tilde{X_{f}})\text{ is obtained from the memory of the liquid film deposition}. & \displaystyle\end{eqnarray}$$
At each change of flow direction, the front meniscus becomes the rear meniscus and vice versa. The pressure balance in the dry and prewetted tubes share a relatively similar expression, but the coefficient
 $E$
remains constant while
 $F$
depends both on
 $Ca$
and
 $\tilde{h_{r}}$
. This system of equations is solved numerically with a first-order Euler explicit method. Since the dynamics is accelerative, an adaptive time step refinement is used. It consists in keeping the spatial displacement over a time step constant:
 $\unicode[STIX]{x0394}\tilde{t}=\unicode[STIX]{x0394}\tilde{x}/Ca$
with
 $\unicode[STIX]{x0394}\tilde{x}$
constant. Convergence analysis on
 $\unicode[STIX]{x0394}\tilde{x}$
was performed for the calculations presented in this paper.
2.4 Validation of the model for unidirectional pressure forcing in a dry capillary tube
Unidirectional pressure forcing imposed by the pressure controller. Blue solid line: pressure magnitude measured with an integrated pressure sensor. Red dashed line: approximation of the pressure driving by the so-called Gompertz function
 $\unicode[STIX]{x0394}P_{t}=78\exp (-6\exp (-3t))$
used in the simulations as the driving pressure head since it fits well with the experimental signal. Black dash-dotted line: asymptote
 $\unicode[STIX]{x0394}P_{t}=80~\text{Pa}$
when
 $t\rightarrow \infty$
.
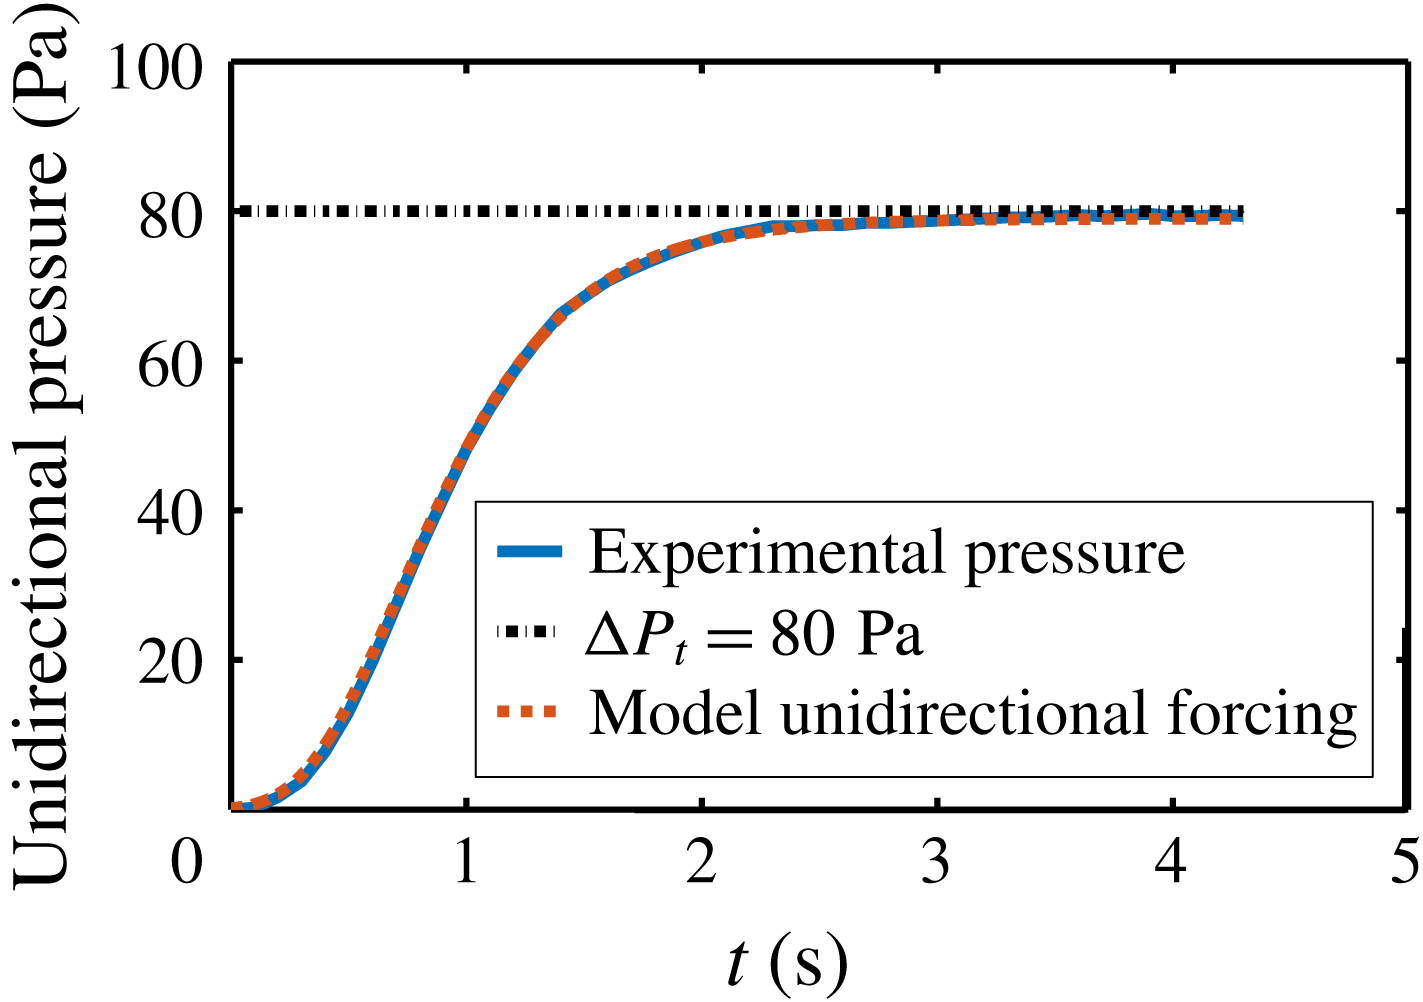
Magniez et al. (Reference Magniez, Baudoin, Liu and Zoueshtiagh2016) validated the constitutive laws summarised in the previous section through careful comparison with experiments of the motion of liquid plugs in prewetted capillary tubes driven by a constant pressure head. This section is dedicated to the validation of the constitutive laws for the motion of liquid plugs in dry capillary tubes driven by an unidirectional pressure driving (represented in figure 2) and in particular the determination of the Hoffman–Tanner constant
 $E$
(an essential parameter in the analytical model).
In such configuration (figure 3), the deposition of a trailing film behind the plug leads to the reduction of the plug length (figure 3
b) and eventually its rupture when the front and rear interfaces meet (see figure 3
a at time
 $t=3~\text{s}$
). This process is unsteady and highly accelerative as seen in figure 3(c). From
 $t=0$
to
 $t=2~\text{s}$
this acceleration is mostly related to the increase in the pressure head (see figure 2). After
 $t=2~\text{s}$
, the acceleration goes on and is even exacerbated close to the plug rupture, while the pressure head reaches a plateau. This behaviour can be understood by rewriting (2.19) in a form reminiscent of Ohm’s law,
 $\unicode[STIX]{x0394}\tilde{P_{t}}=\tilde{R_{t}}Ca$
, with
 $\tilde{R_{t}}=(\tilde{R_{v}}+\tilde{R}_{i}^{r}+\tilde{R}_{i}^{f})$
the dimensionless global resistance to the flow,
 $\tilde{R_{v}}=4\tilde{L_{p}}$
,
 $\tilde{R}_{i}^{f}=E^{2}/2Ca^{-1/3}$
and
 $\tilde{R}_{i}^{r}=3.72Ca^{-1/3}$
the viscous, front and rear interface resistances respectively. From this form of the pressure balance, we see that the reduction of the plug length
 $\tilde{L_{p}}$
leads to a reduction of the viscous resistance
 $\tilde{R_{v}}$
and thus, at constant pressure driving
 $\unicode[STIX]{x0394}\tilde{P_{t}}$
, to an increase of the capillary number. This increase in the capillary number is strengthened by a decrease of the interfacial resistance
 $\tilde{R}_{i}=\tilde{R}_{i}^{f}+\tilde{R}_{i}^{r}$
, since
 $\tilde{R}_{i}$
is proportional to
 $Ca^{-1/3}$
. Finally, the increase of the trailing film thickness with the capillary number (2.24) implies that the whole process (fluid deposition and plug motion) accelerates progressively as can be seen in figure 3. It is important to note that in these experiments the acceleration of the plug does not rely on inertial effects (which can be neglected according to the dimensional analysis provided in § 2.2) but rather on the intimate relation between the plug size and velocity.
Temporal evolution of a liquid plug of initial length
 $L_{0}=2.5~\text{mm}$
pushed with a unidirectional driving pressure (represented in figure 2) in a dry capillary tube. (a) Position of the rear and front meniscus. (b) Evolution of the plug length. (c) Evolution of the plug dimensionless speed, i.e. the capillary number
 $Ca$
. Blue curves correspond to experiments and the black dashed curves are obtained from simulations of (2.19) to (2.25).

Many experiments have been performed for different initial plug lengths and compared with the numerical solutions of (2.19) to (2.25) (dry version with
 $\tilde{h_{f}}=0$
). In the simulations, a Gompertz function
 $\unicode[STIX]{x0394}P_{t}=78\exp (-6\exp (-3t))$
was used as the driving pressure head due to its excellent match with the pressure head measured experimentally at the exit of the the pressure controller with an integrated pressure sensor (see figure 2 where the blue line corresponds to experimental signal and the red line to best fit with Gompertz function). The complex shape of the pressure head is the result of the pressure controller response time (the command is a constant pressure
 $P_{o}=80~\text{Pa}$
starting at
 $t=0$
). The only adjustable parameter in the model is the Hoffman–Tanner constant
 $E$
appearing in (2.19). The best fit between experiments and theory was achieved for
 $E=4.4$
, a value close to the coefficient
 $4.3$
obtained by Bico & Quéré (Reference Bico and Quéré2001) in their experiments on falling of liquid slugs in vertical dry capillary tubes. With this value, an excellent prediction of the plug dynamics is achieved for all experiments (see e.g. figure 3 where blue solid lines correspond to experiments and red dashed lines to simulations). In particular, this model enables a quantitative prediction of the rupture length, defined as the portion of the tube
 $L_{d}=\max (X_{f})-\min (X_{r})$
visited by the liquid plug before its rupture (figure 4
a), and the rupture time, which is the total time elapsed between the beginning of the experiment and the plug rupture (figure 4
b).
Evolution of (a) the rupture length and (b) the rupture time of a liquid plug pushed with a unidirectional pressure head of the form
 $\unicode[STIX]{x0394}P_{t}=60\exp (-6\exp (-3.5t))$
in a dry capillary tube as a function of the initial plug length
 $L_{0}$
. The blue stars represent experiments. The red curve is obtained numerically by simulating the evolution for 107 initial plug lengths.

3 Cyclic forcing of liquid plugs
This section is dedicated to the dynamics of liquid plugs under cyclic forcing. In § 3.1, the influence of the forcing configuration (pressure of flow rate) is examined; § 3.2 elucidates the fundamental role played by hysteretic effects resulting from fluid deposition on the walls.
3.1 Influence of the driving condition: pressure head versus flow rate
(a) Flow rate and (b) pressure cyclic forcing imposed experimentally with a syringe pump and a pressure controller respectively. Blue solid line: experimental values measured with sensors. Red dashed line: fit of the pressure cyclic forcing measured experimentally with the analytical expression
 $\unicode[STIX]{x0394}P_{t}=78\exp (-6\exp (-3t))$
for
 $t\in [0,T]$
,
 $\unicode[STIX]{x0394}P_{t}=(-1)^{n}(P_{c}-P_{d})$
for
 $t\in [nT,(n+1)T]$
with
 $P_{c}=78\exp (-3\exp (-3(t-nT)))$
and
 $P_{d}=78\exp (-1.4(t-nT))\exp (-0.02\exp (-1.4\ast (t-nT)))$
,
 $T=2.15$
s the half-period and
 $n\in \mathbb{N}^{\ast }$
.

In this first subsection, the responses of liquid plugs to two types of forcing are compared: (i) a cyclic flow rate imposed by a syringe pump (represented in figure 5 a, blue line) and (ii) a pressure cycle imposed by a pressure controller (represented in figure 5 b, blue line). These forcings have a complex temporal shape owing to the response time of the syringe pump and pressure controller. In appendix A, we describe precisely how these forcing conditions are obtained. The pressure forcing is well approximated by the following analytical expression, which is a combination of Gompertz functions (see figure 5 b, red dashed line):
 $$\begin{eqnarray}\left.\begin{array}{@{}c@{}}\unicode[STIX]{x0394}P_{t}=78\exp (-6\exp (-3t))\quad \text{for }t\in [0,T],\\ \unicode[STIX]{x0394}P_{t}=(-1)^{n}(P_{c}-P_{d})\quad \text{for }t\in [n,(n+1)T],\\ P_{c}=78\exp (-3\exp (-3(t-nT))),\\ P_{d}=78\exp (-1.4(t-nT))\exp (-0.02\ast \exp (-1.4\ast (t-nT))),\end{array}\right\}\end{eqnarray}$$
with
 $T=2.15$
s the half-period and
 $n\in \mathbb{N}^{\ast }$
for cyclic forcing.
Two extremely different behaviours are evidenced in these two cases: for a cyclic flow rate forcing (figure 6
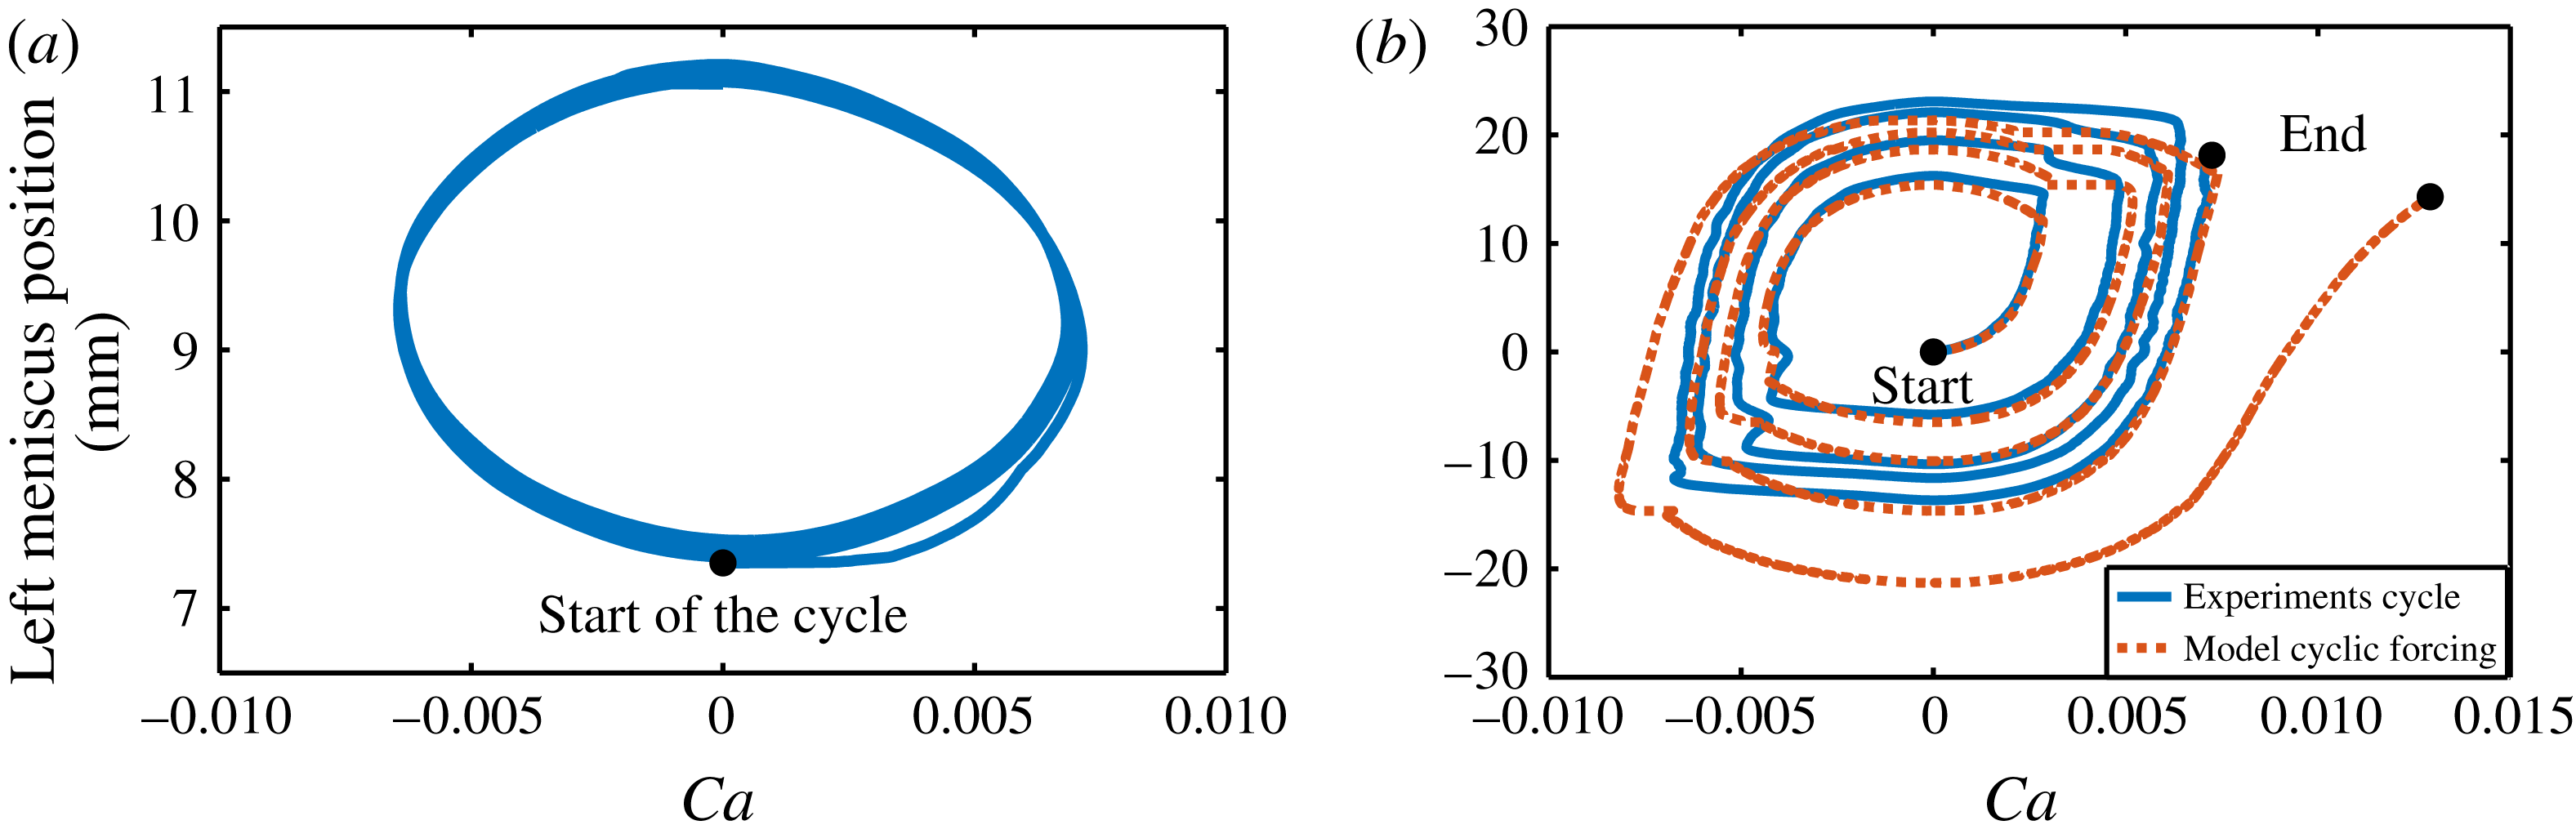
a–c and supplementary movie S1, available at https://doi.org/10.1017/jfm.2017.828), the liquid plug dynamics is periodic and stable (see phase portrait in figure 7
a). Indeed, the plug velocity and positions are directly imposed by the motion of the syringe pump, thus
 $U(t+2T)=U(t)$
(figure 6
b) and
 $X_{r}(t+2T)=X_{r}(t)$
(figure 6
a). Moreover, since (i) the film deposition process solely depends on the plug velocity and (ii) the fluid recovery at half-cycle
 $N$
depends on the fluid deposition at half-cycle
 $N-1$
, the mass balance is null over each cycle and the evolution of the plug size is also periodic:
 $L_{p}(t+2T)=L_{p}(t)$
(figure 6
c). It is interesting to note that the initial wall wetting condition plays little role in this process; it only affects the mass balance during the first half-cycle and thus determines the plug size
 $L_{p}((2n+1)T)$
with
 $n\in \mathbb{N}$
. This wetting condition is indeed erased by the backward motion during the second half-cycle and the plug evolution is then only dictated by the temporal shape of the flow rate cycle.
(a–c) Temporal evolution of a single liquid plug of initial length
 $L_{0}=1.05~\text{mm}$
pushed with the cyclic flow rate forcing represented in figure 5(a); see also supplementary movie S1. (a) Positions of the menisci. (b) Evolution of the dimensionless velocity of the left meniscus (capillary number). (c) Evolution of the plug length. (d–f) Temporal evolution of a single liquid plug of initial length
 $L_{0}=3.3~\text{mm}$
pushed with the pressure cyclic forcing represented in figure 5(b); see also supplementary movie S2. (d) Position of the menisci. (e) Evolution of the dimensionless velocity of the left meniscus (capillary number). (f) Evolution of the plug length. In all these figures blue lines represent experiments and red dashed lines simulations obtained from (2.19) to (2.25).
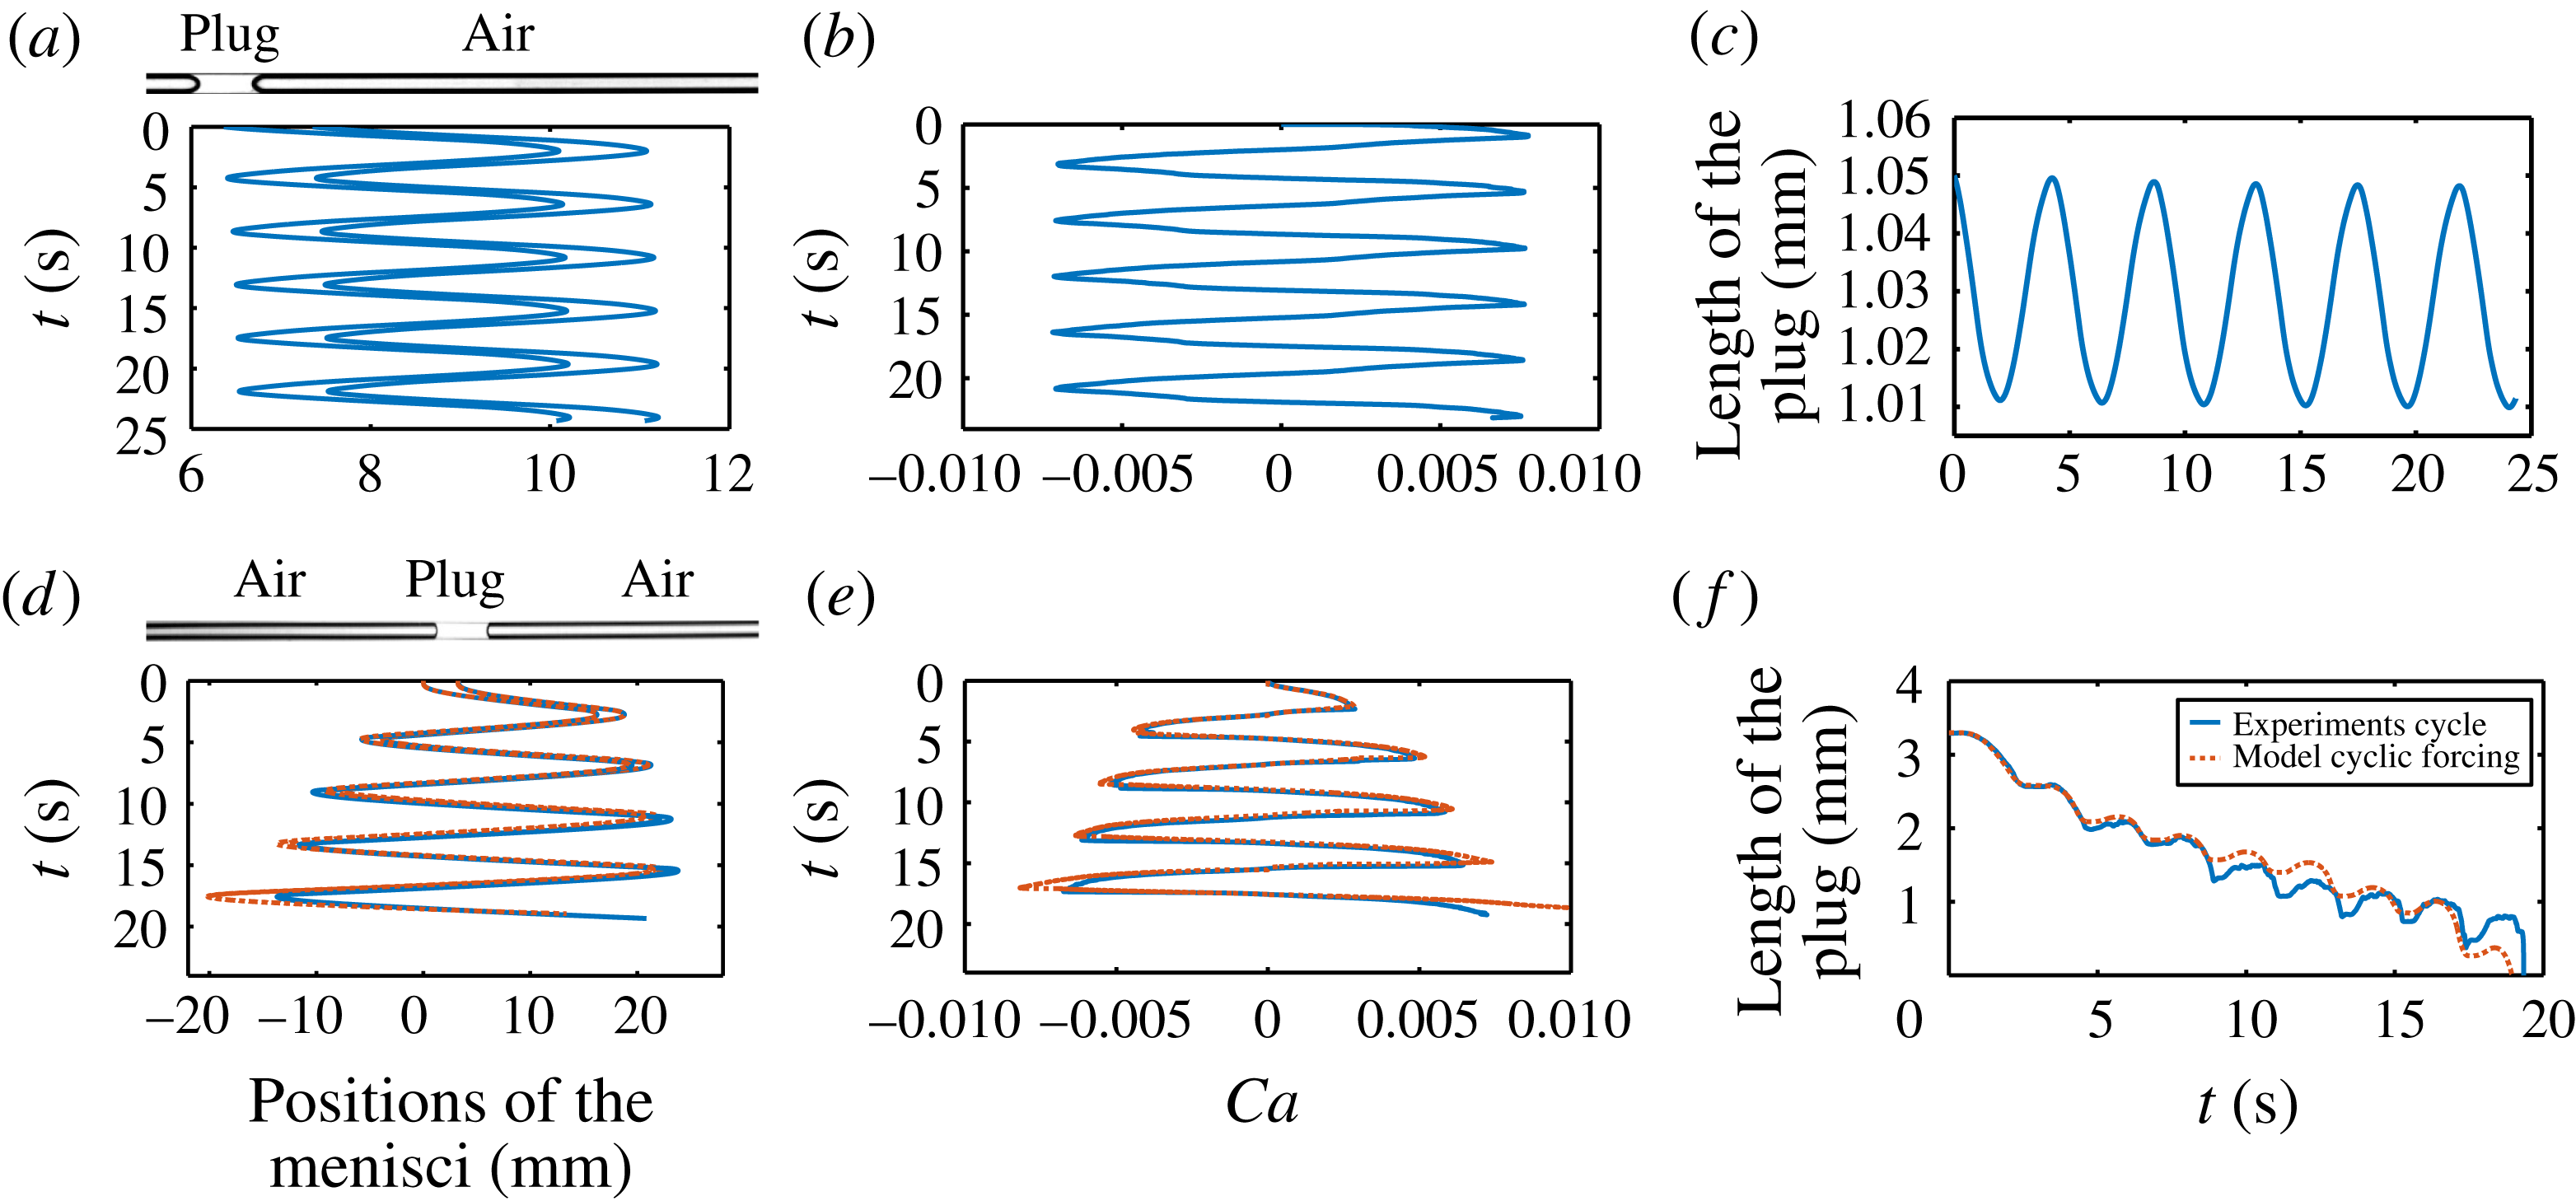
The liquid plug undergoes a very different evolution for a periodic pressure forcing (figure 6
d–f and supplementary movie S2). In this case, the plug velocity and position are no longer enforced by the driving condition and depend only on the evolution of the resistance of the plug to motion. For the forcing condition represented in figure 5(b), it is observed that (i) the plug travels on a longer portion of the tube at each cycle (figure 6
d), (ii) the dimensionless velocity of the plug (the capillary number) is no longer cyclic but increases progressively at each cycle,
 $U(t+2T)>U(t)$
(figure 6
e), and (iii) the size of the plug diminishes (
 $L_{p}(t+2T)<L_{p}(t)$
), eventually leading to its rupture (figure 6
f). These phenomena are of course related since a larger plug velocity leads to more liquid deposition and thus a diminution of the plug size. Conversely, the cyclic diminution of the plug size leads to a decrease in the viscous resistance (the same process as described in § 2.4). Nevertheless this sole mechanism is not sufficient to explain the cyclic acceleration of the plug evidenced in the phase portrait (figure 7
b) as demonstrated in the next sections.
Phase portrait showing the evolution of the position of the left meniscus as a function of the capillary number
 $Ca$
. (a) Cyclic flow rate forcing and (b) cyclic pressure forcing. The blue curves correspond to experiments and the red dashed line to simulations.
3.2 Memory effects and hysteretic behaviour
In this section, the model introduced in § 2.3 (2.19) to (2.25) is used to analyse the origin of the departure from a periodic evolution for a pressure forcing and in particular analyse the contributions of the different terms. Indeed, this model quantitatively reproduces the liquid plug dynamics (see figure 6 d,f, red dashed lines, and figures 13 and 21 for comparisons of the simulations and experiments for a large set of initial conditions).
The response of a liquid plug to a cyclic forcing is periodic since (i) the plug velocity is enforced and does not rely on the evolution of the plug resistance to motion, and (ii) the liquid deposition on the walls, and thus the size of the plug, solely depends on the plug velocity. This leads to a zero mass balance at each cycle.
For pressure driven cyclic forcing, the departure from this periodic behaviour thus relies on the evolution of the plug resistance at each cycle due to the existence of flow memories since the flow is quasi-static. A first memory, which is already at hand in unidirectional pressure forcing, is simply the evolution of the plug length. Indeed, the plug size at a given time
 $t$
depends on the history of the plug velocity at times
 $t^{\ast }<t$
. In turn, the plug length modifies the viscous resistance
 $\tilde{R_{v}}=4\tilde{L_{p}}$
and thus the plug velocity. The mass balance, which is relatively simple for a unidirectional driving in a dry tube (the liquid left at time
 $t$
on the walls only depends on the velocity of the plug at time
 $t$
), becomes much more complex for a cyclic forcing. Indeed, at each back and forth motion, the liquid plug leaves on the walls a film layer whose thickness keeps a memory of the plug velocity during the corresponding half-cycle (since
 $\tilde{h_{r}}$
depends on
 $Ca$
). Thus, the mass balance depends on both the velocity of the plug at time
 $t$
and its velocity at the same position in the previous cycle. The progressive transfer of mass from the liquid plug to the liquid film is clearly evidenced in figure 9. This graph shows that both the portion of the tube covered by the liquid film and the film thickness increase at each cycle. This graph also exhibits the complexity of the mass transfer observed in supplementary movie S2: while the size of the plug gradually decreases at each cycle, its evolution is not monotonic during a half-cycle. Indeed, when the flow direction is changed the plug moves at first slowly (due to the response time of the pressure controller) and thus the thickness of the liquid film deposited on the walls behind the plug is smaller than that in front of the plug, leading to growth of the liquid plug. Then the plug accelerates and progressively the tendency is inverted leading to a reduction of the plug size. The transition between the growing and decreasing phases correspond on the graph to the times when the thickness (colour) on each side of the plug is the same.
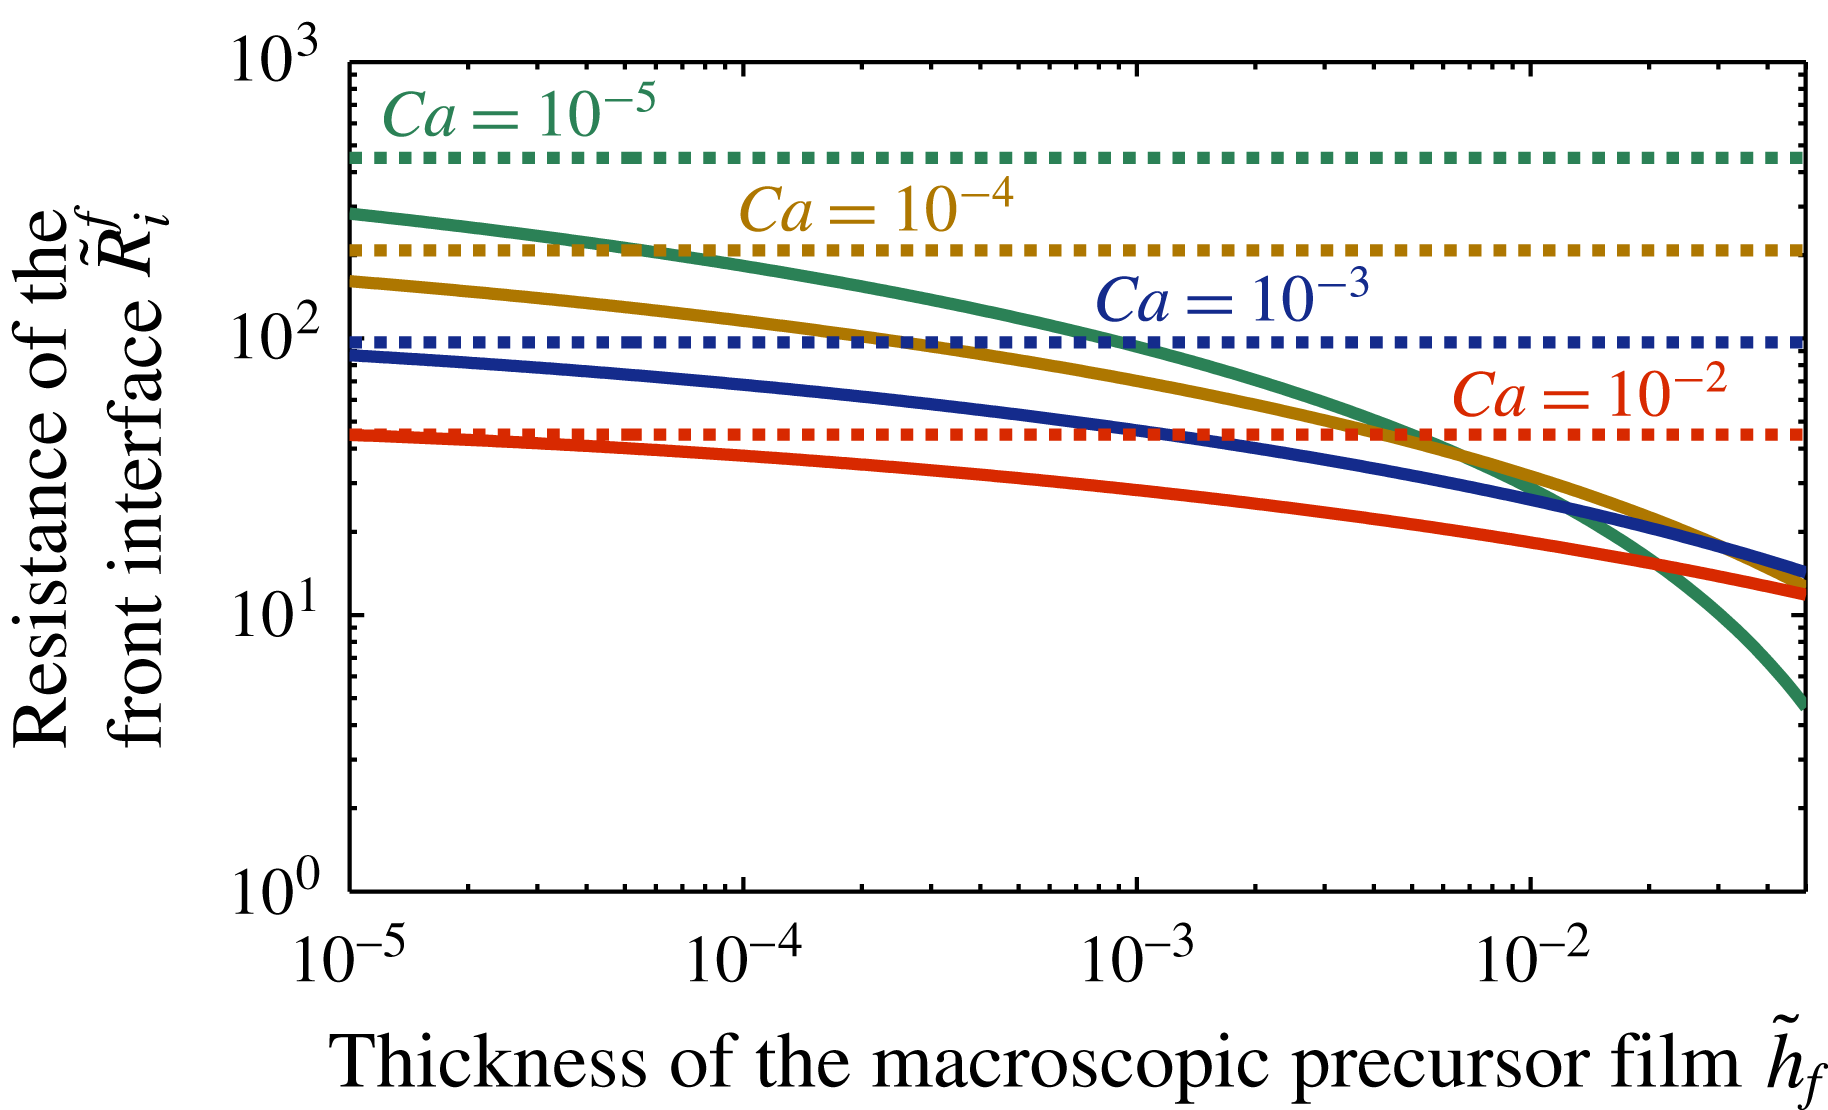
Solid lines: dimensionless front interface resistance
 $\tilde{R}_{i}^{f}$
at different capillary numbers
 $Ca$
as a function of the prewetting film thickness
 $\tilde{h}_{f}$
. Dashed lines: dimensionless front interface resistance for dry capillary tubes. These curves show (i) that the interfacial resistance is systematically lower for prewetted capillary tubes than for dry capillary tubes and (ii) that for prewetted capillary tubes, the interfacial resistance decreases with the thickness of the prewetting film
 $\tilde{h}_{f}$
.
Spatio-temporal diagram showing the evolution of the thickness of the liquid film deposited on the walls obtained from simulations of (2.19) to (2.25) with the same initial and forcing conditions as figure 6. The dimensionless film thickness
 $\tilde{h}=h/R$
is represented in colour at each time and position in the tube.

A second memory originates from the lubrication of the plug motion by the liquid film, i.e. the reduction of the front interface resistance
 $\tilde{R}_{i}^{f}=(F^{2}/2)Ca^{-1/3}$
as the thickness of the prewetting film
 $\tilde{h_{f}}$
is increased (see (2.21) and (figure 8)). Indeed, during the first half-cycle the liquid plug moves on a dry capillary tube and leaves a liquid film behind it on the walls whose thickness increases with the speed of the liquid plug (see figure 9). This liquid film lubricates the passage of the plug during the back motion, leading to a drastic reduction of the front interface resistance (figure 8) and thus, a higher plug speed. Then the same mechanism is reproduced during the following cycles: since the speed is increased at each cycle, the plug leaves more liquid on the walls, leading again to a reduction of the interfacial resistance through a lubrication effect.
Simulations with (2.19) to (2.25) of the positions of the menisci of a liquid plug of initial of size
 $L_{0}=3.3~\text{mm}$
pushed with the cyclic pressure driving represented in figure 5(b). (a) Complete models (2.20) and (2.21). (b) The viscous resistance interface is kept constant,
 $\tilde{R}_{v}=\text{const}$
. (c) The front interface resistance is kept constant
 $(F=E)$
.
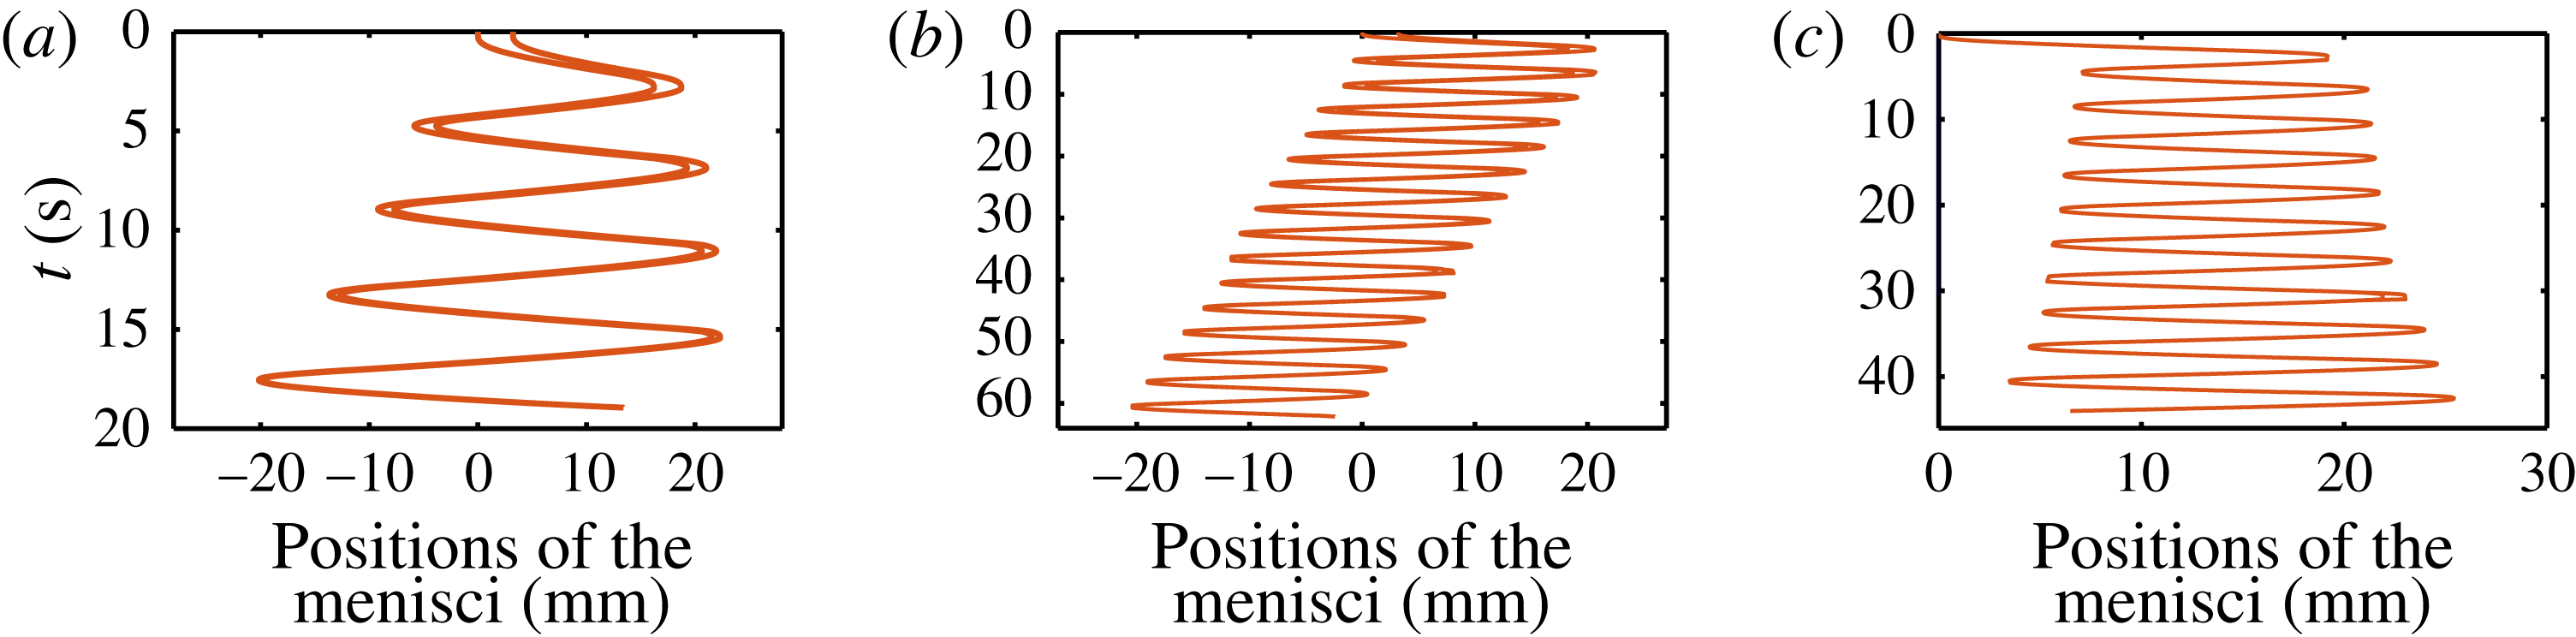
Of course, these two memory effects are coupled. To quantify the relative contribution of these two effects, we simulated the plug behaviour when the viscous resistance
 $\tilde{R}_{v}$
is kept constant (figure 10
b) and when the front interface resistance
 $\tilde{R}_{i}^{f}$
is kept constant (figure 10
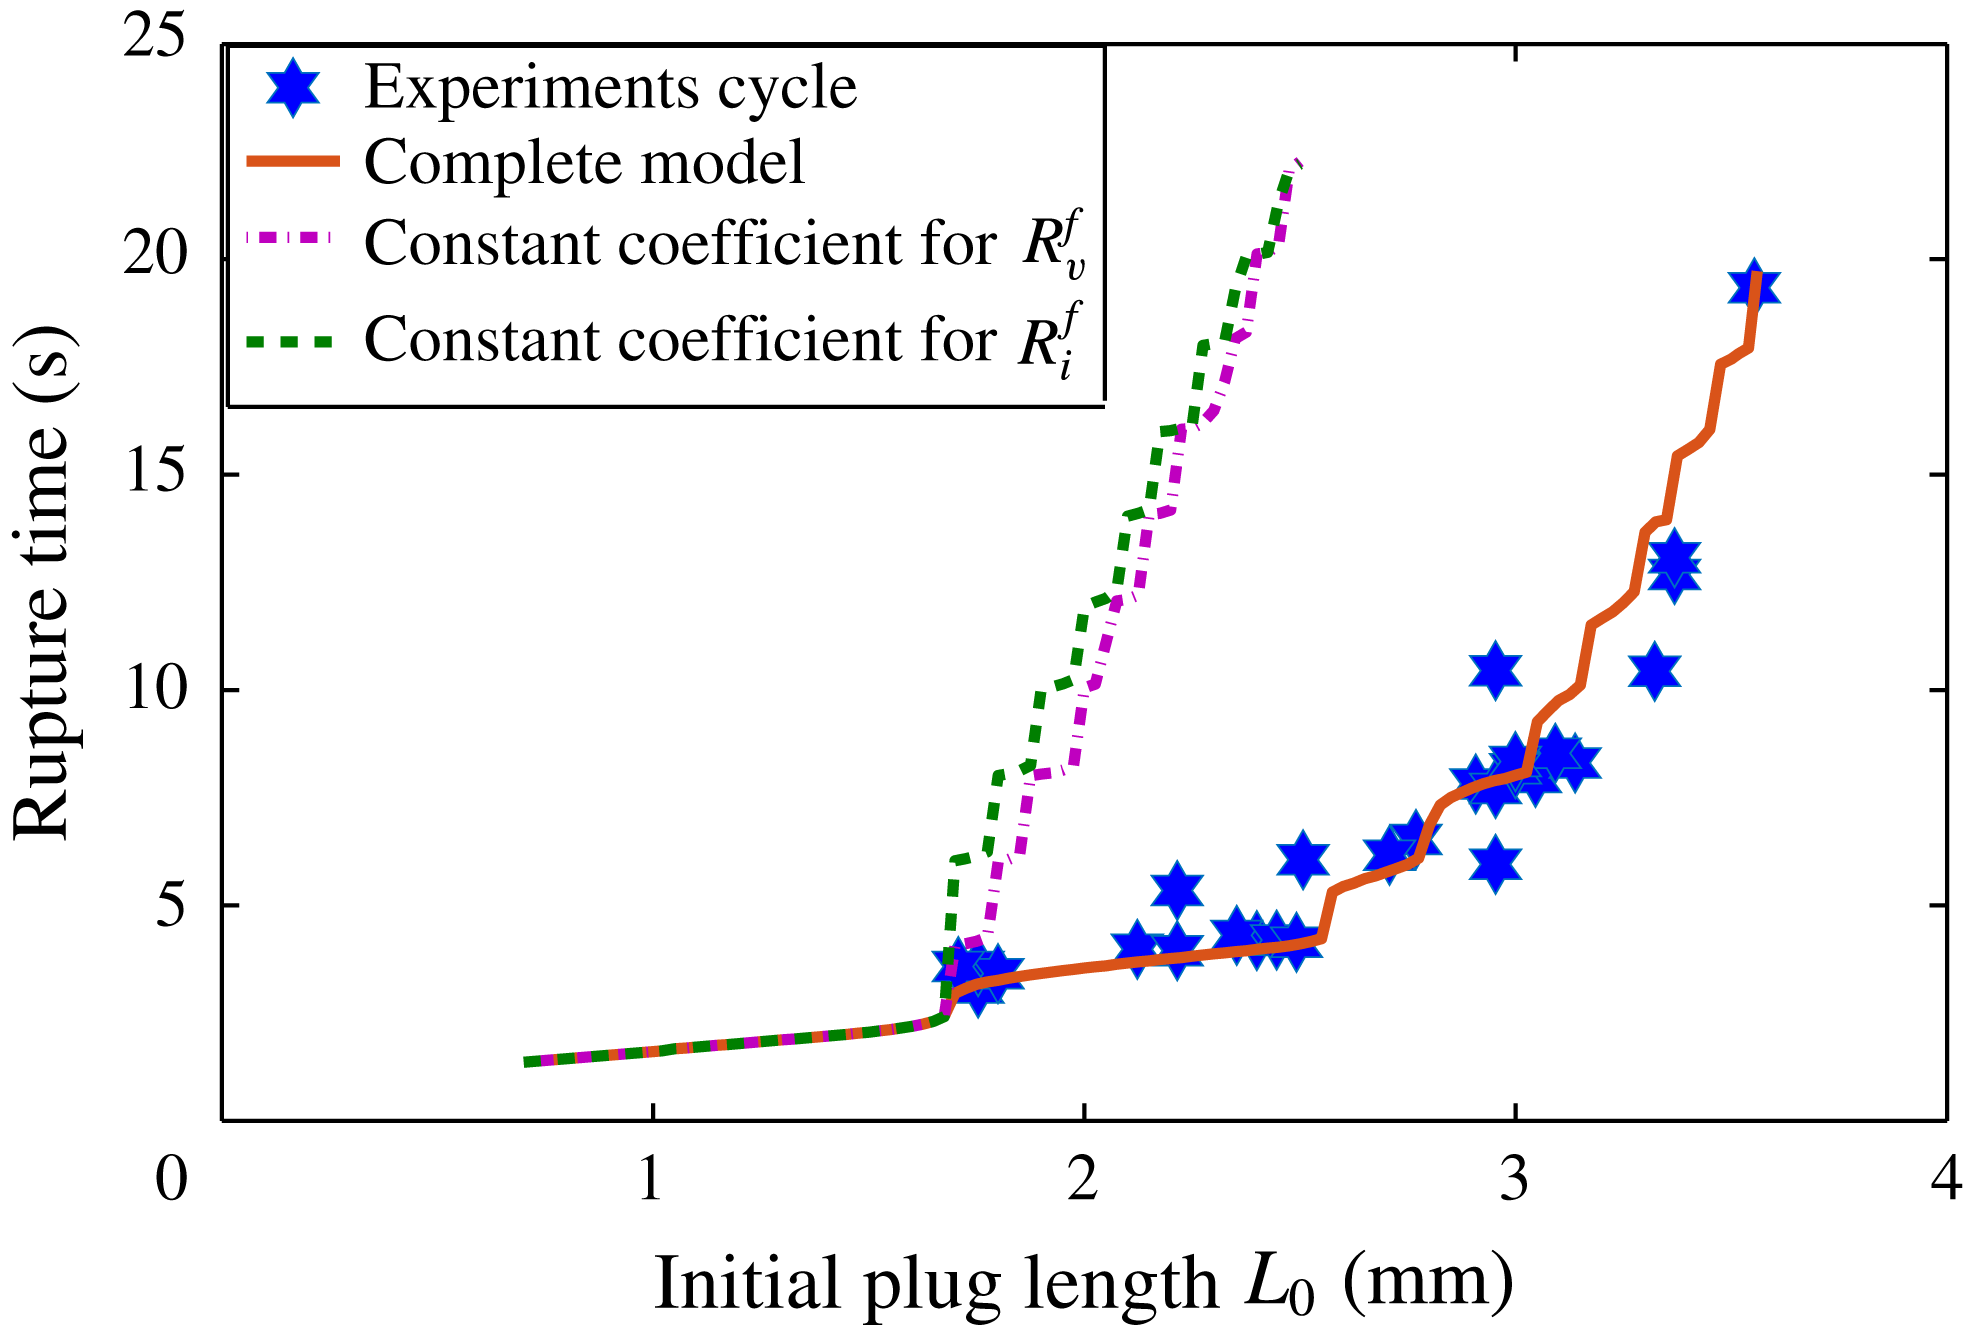
c). The simulations show that in these two cases the plug acceleration and rupture still occur but that the rupture time is substantially increased. This tendency is confirmed in figure 11 where we compared the time necessary for the plug to rupture (called the ‘rupture time’) to simulations for a large number of initial plug sizes when the whole model is considered (red solid line), when the first memory effect (length effect) is discarded (purple dashed line) and when the second memory effect (lubrication effect) is discarded (green dash-dotted line). While the complete model quantitatively reproduces the tendencies, the other two simulations largely overestimate the rupture time.
Rupture time of liquid plugs pushed with a cyclic pressure driving given by (3.1) as a function of their initial lengths
 $L_{0}$
. Blue stars correspond to experiments, the red solid curve to simulations with the complete model, the purple dash-dotted line to simulations when the viscous resistance
 $\tilde{R}_{v}$
is kept constant and the green dash-dotted line to simulations when the front interface resistance
 $\tilde{R}_{i}^{f}$
is kept constant and thus lubrication effects are discarded.
This analysis also shows the central role played by the initial wetting condition: the successive accelerations at each half-cycle all originate from the transition between a dry and a prewetted capillary tube during the first cycle, which led to a massive acceleration of the plug in the back motion. In theory, the opposite behaviour (plug cyclic slowdown and growth) might be observed in a prewetted capillary tube depending on the thickness of the prewetting film and the amplitude of the pressure driving, as was already observed by Magniez et al. (Reference Magniez, Baudoin, Liu and Zoueshtiagh2016) for unidirectional constant pressure forcing.
4 Cyclic motion vs direct rupture of the plug under pressure forcing
Spatio-temporal evolution of plugs of initial lengths
 $L_{1}=2.2~\text{mm}$
(a,b),
 $L_{2}=2.8~\text{mm}$
(c,d) and
 $L_{3}=3.2~\text{mm}$
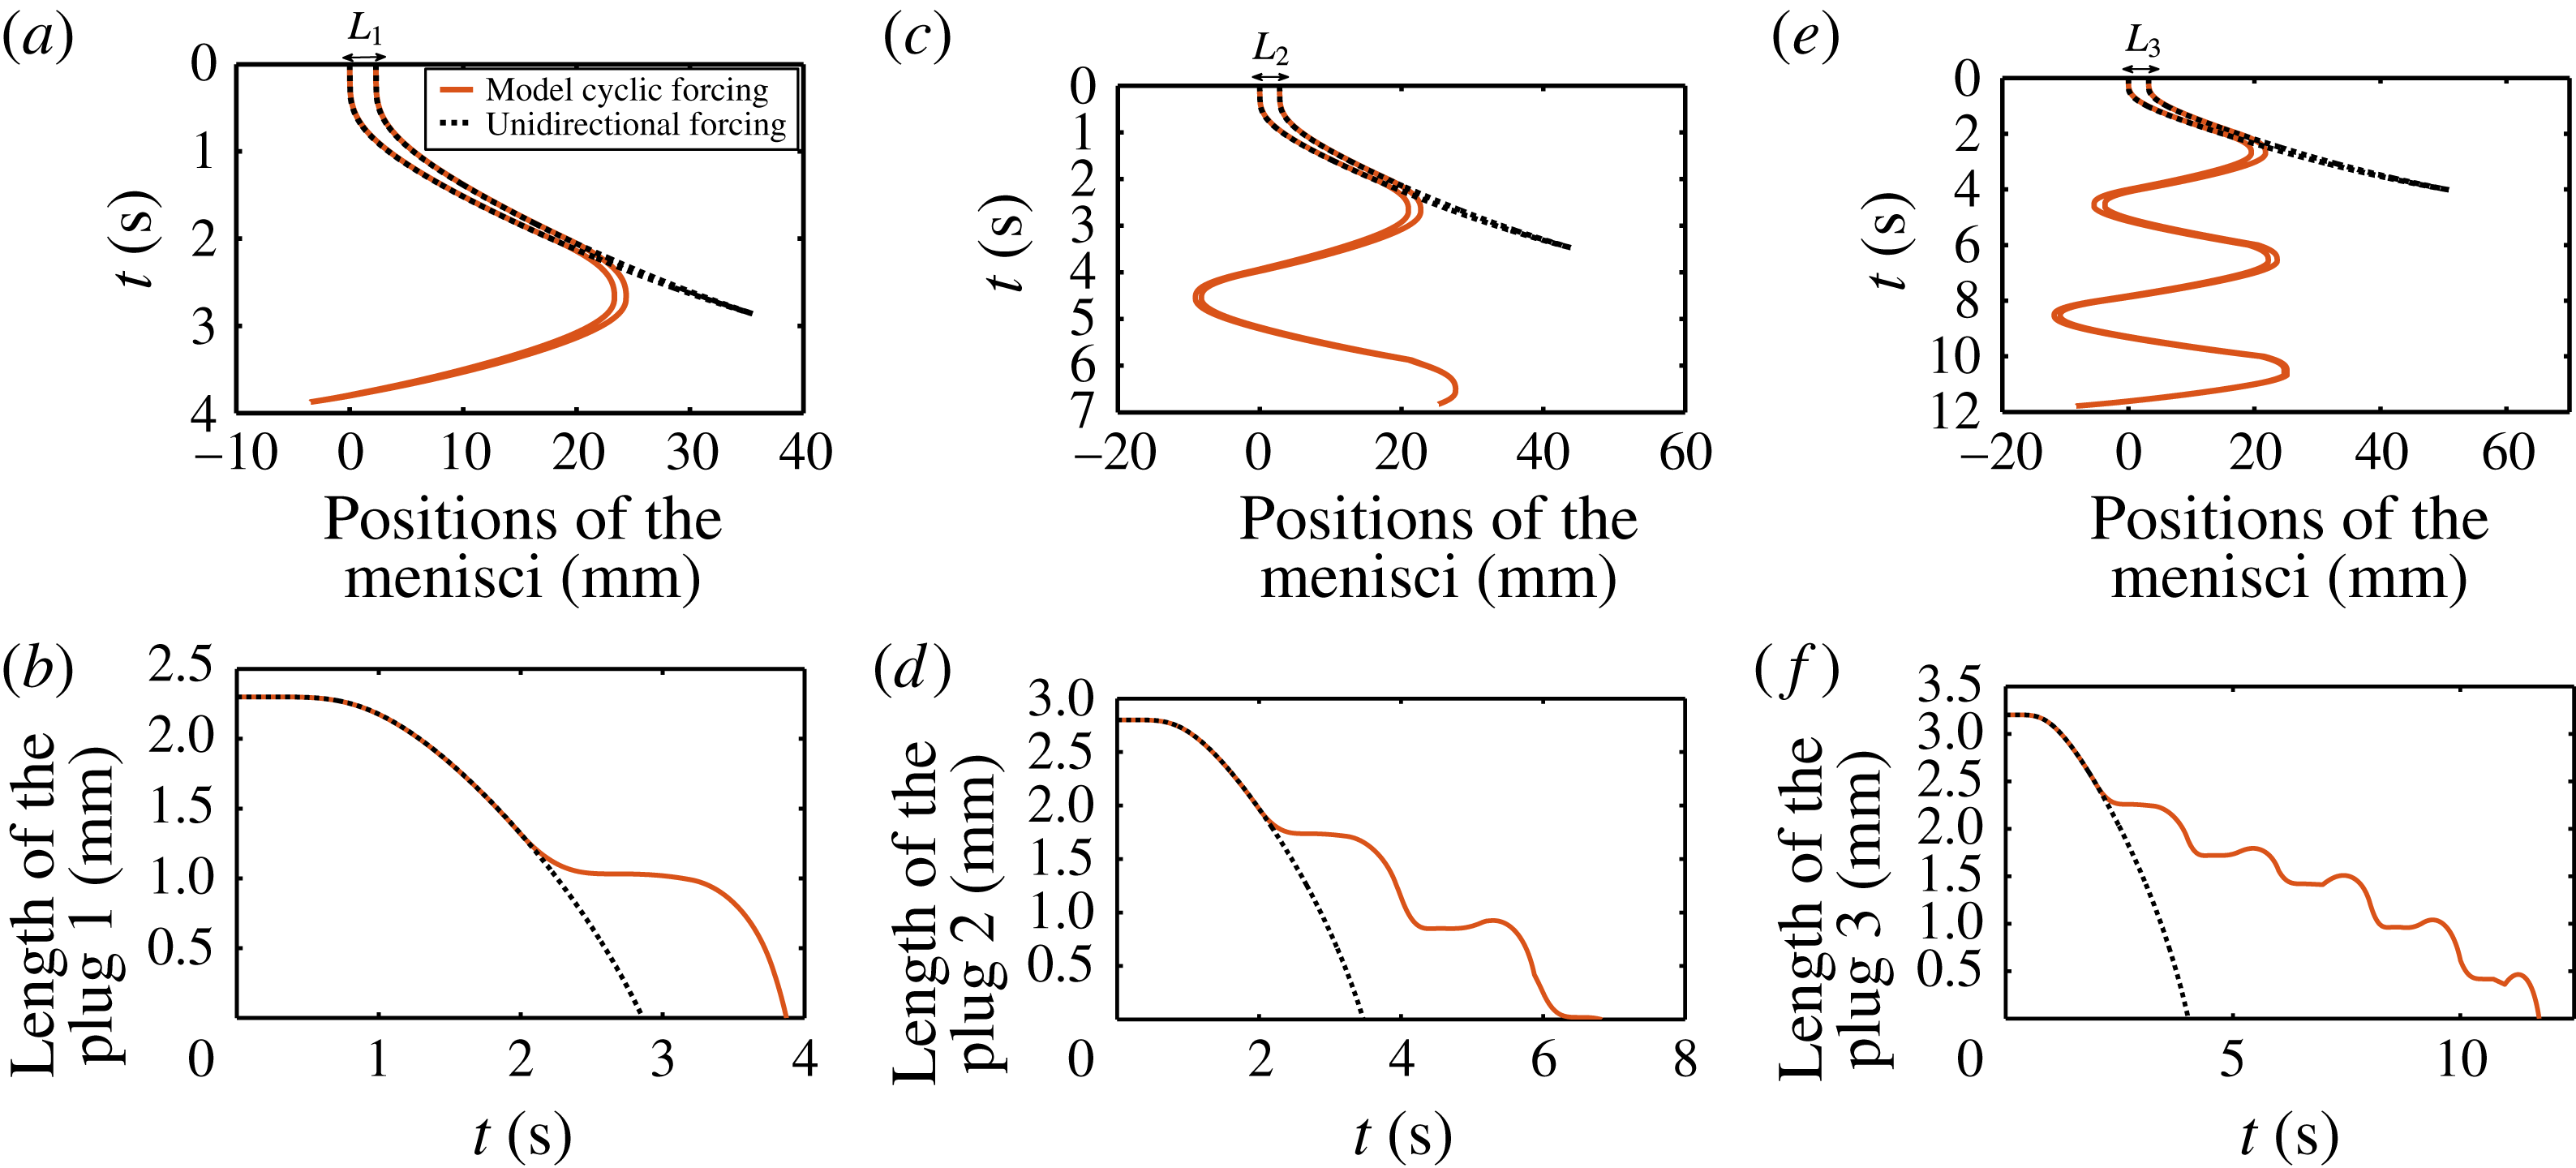
(e,f) pushed either with a unidirectional pressure driving (black dotted line) or with a cyclic pressure driving (red solid line). (a,c,e) Position of the rear and front menisci. (b,d,f) Evolution of the plug size.
In this last section, we compare experimentally and theoretically the time and space required to break a liquid plug with either a unidirectional or a cyclic pressure forcing with the same magnitude. The two driving conditions used for this comparison are represented respectively in figure 2 and figure 5(b). As previously mentioned, their temporal evolution can be approximated respectively by the Gompertz function
 $\unicode[STIX]{x0394}P_{t}=78\exp (-6\exp (-3t))$
and (3.1).
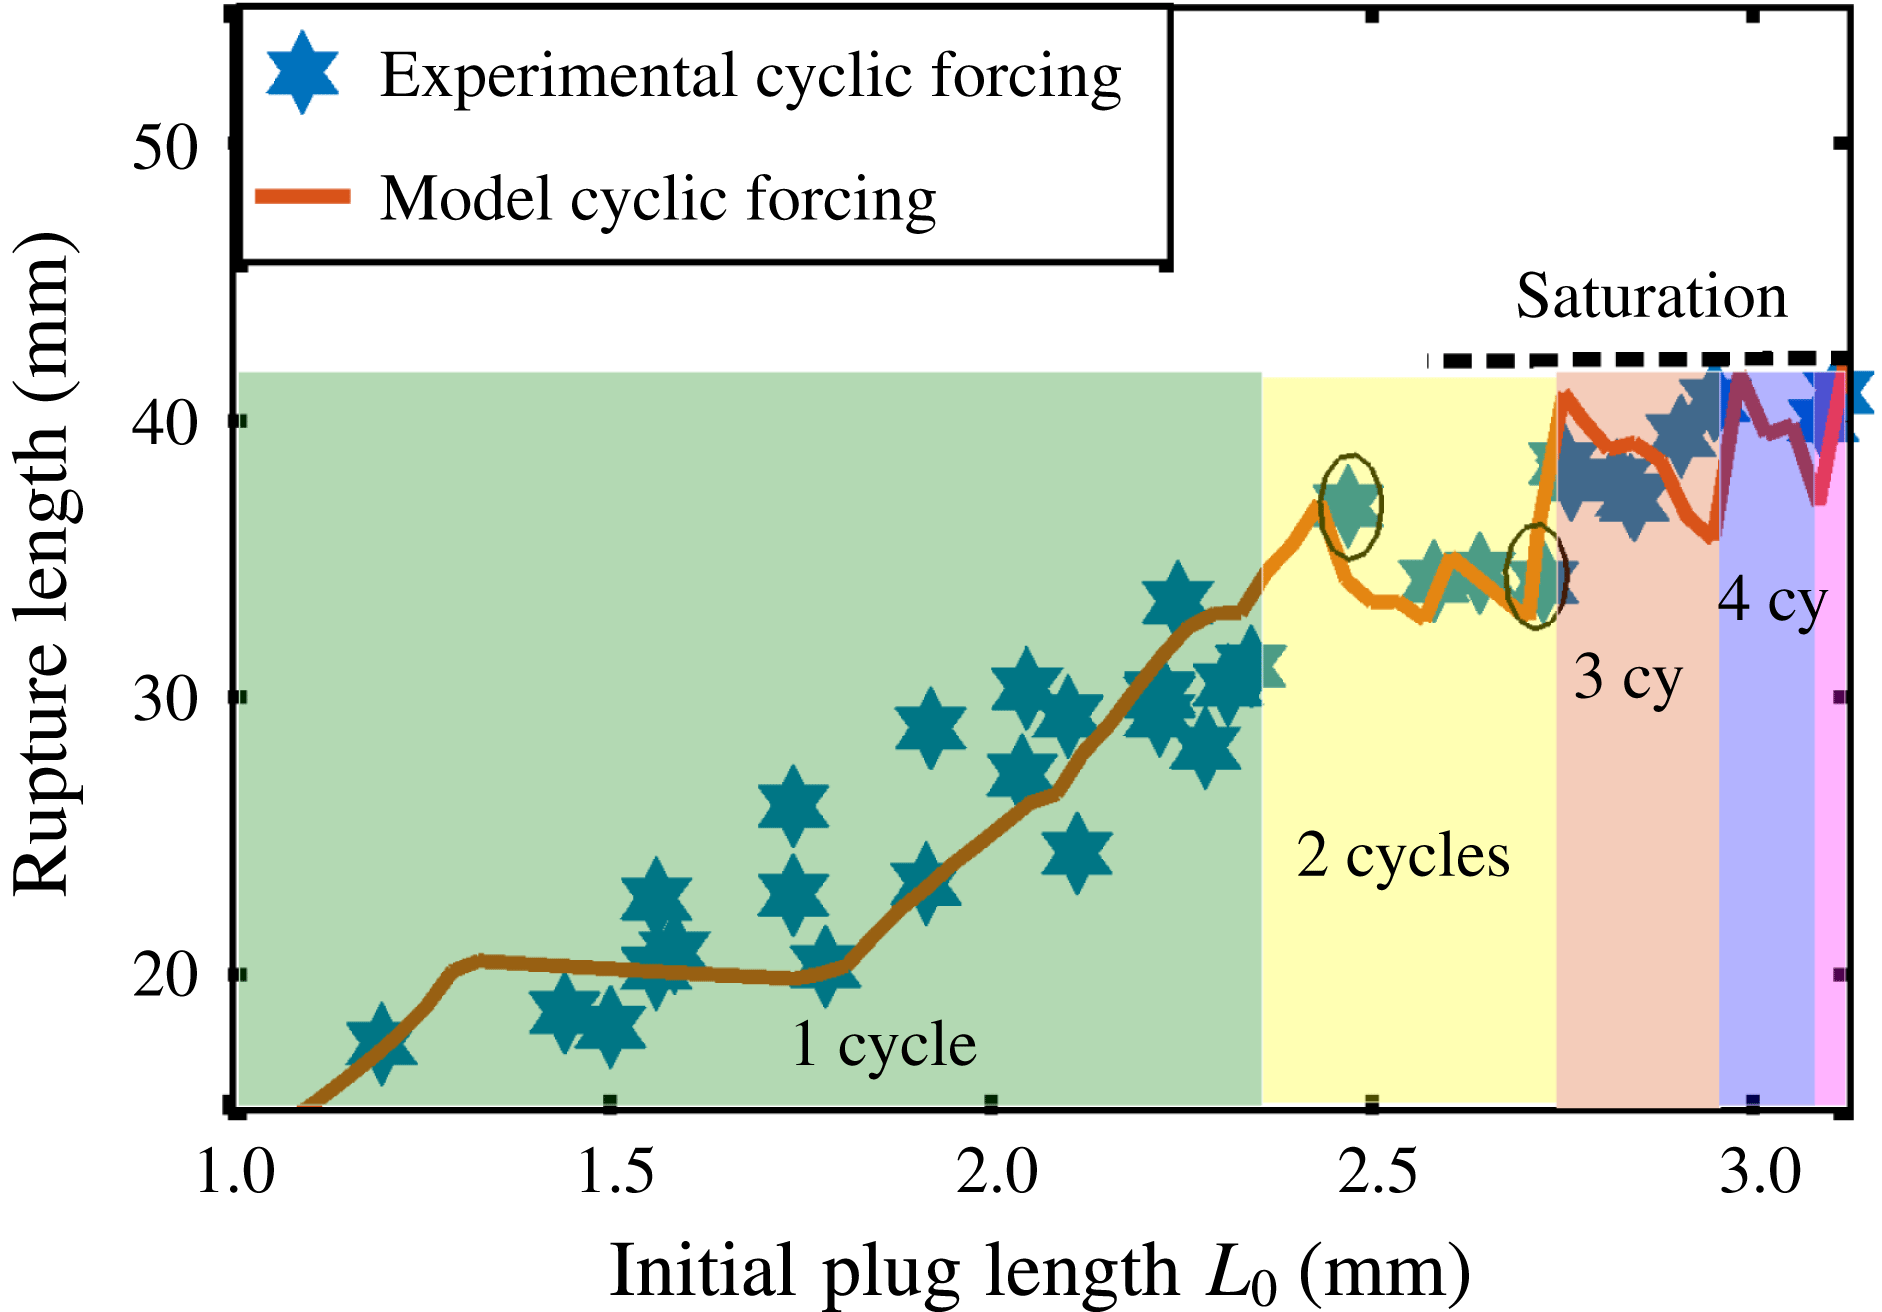
Figure 12 compares theoretically the dynamics of liquid plugs of increasing sizes for unidirectional and cyclic pressure driving. This figure shows (i) that plug rupture and thus reopening of airways is obtained in a longer time but in a more confined space with a cyclic forcing compared to a unidirectional pressure forcing, and (ii) that the difference between these two driving conditions increases with the number of cycles and hence with the initial size of the liquid plug. This tendency has been verified experimentally and theoretically on a large number of initial plug lengths. The results are summarised in figure 13. Figure 13(a,b) shows respectively the rupture length (the portion of the tube visited by the liquid plug before its rupture) and the rupture time (the time required for the plug to rupture) as a function of the plug’s initial length,
 $L_{0}$
. In these two figures, the blue stars and the solid red line correspond respectively to experiments and simulations for a cyclic pressure driving, while the black dots correspond to simulations with a unidirectional pressure driving. The successive cycles are highlighted with different colours. This figure again shows excellent agreement between experimental data and numerical predictions for up to five cycles (figure 13), confirming that the model summarised in (2.19) to (2.25) captures the main physics.
(a) Rupture length and (b) rupture time of liquid plugs pushed with a cyclic pressure driving given by (3.1) as a function of their initial lengths
 $L_{0}$
. Blue stars correspond to cyclic experiments and the red solid curve to simulations. The black dashed line and the blue square dots correspond respectively to simulations and experiments for a unidirectional pressure driving.
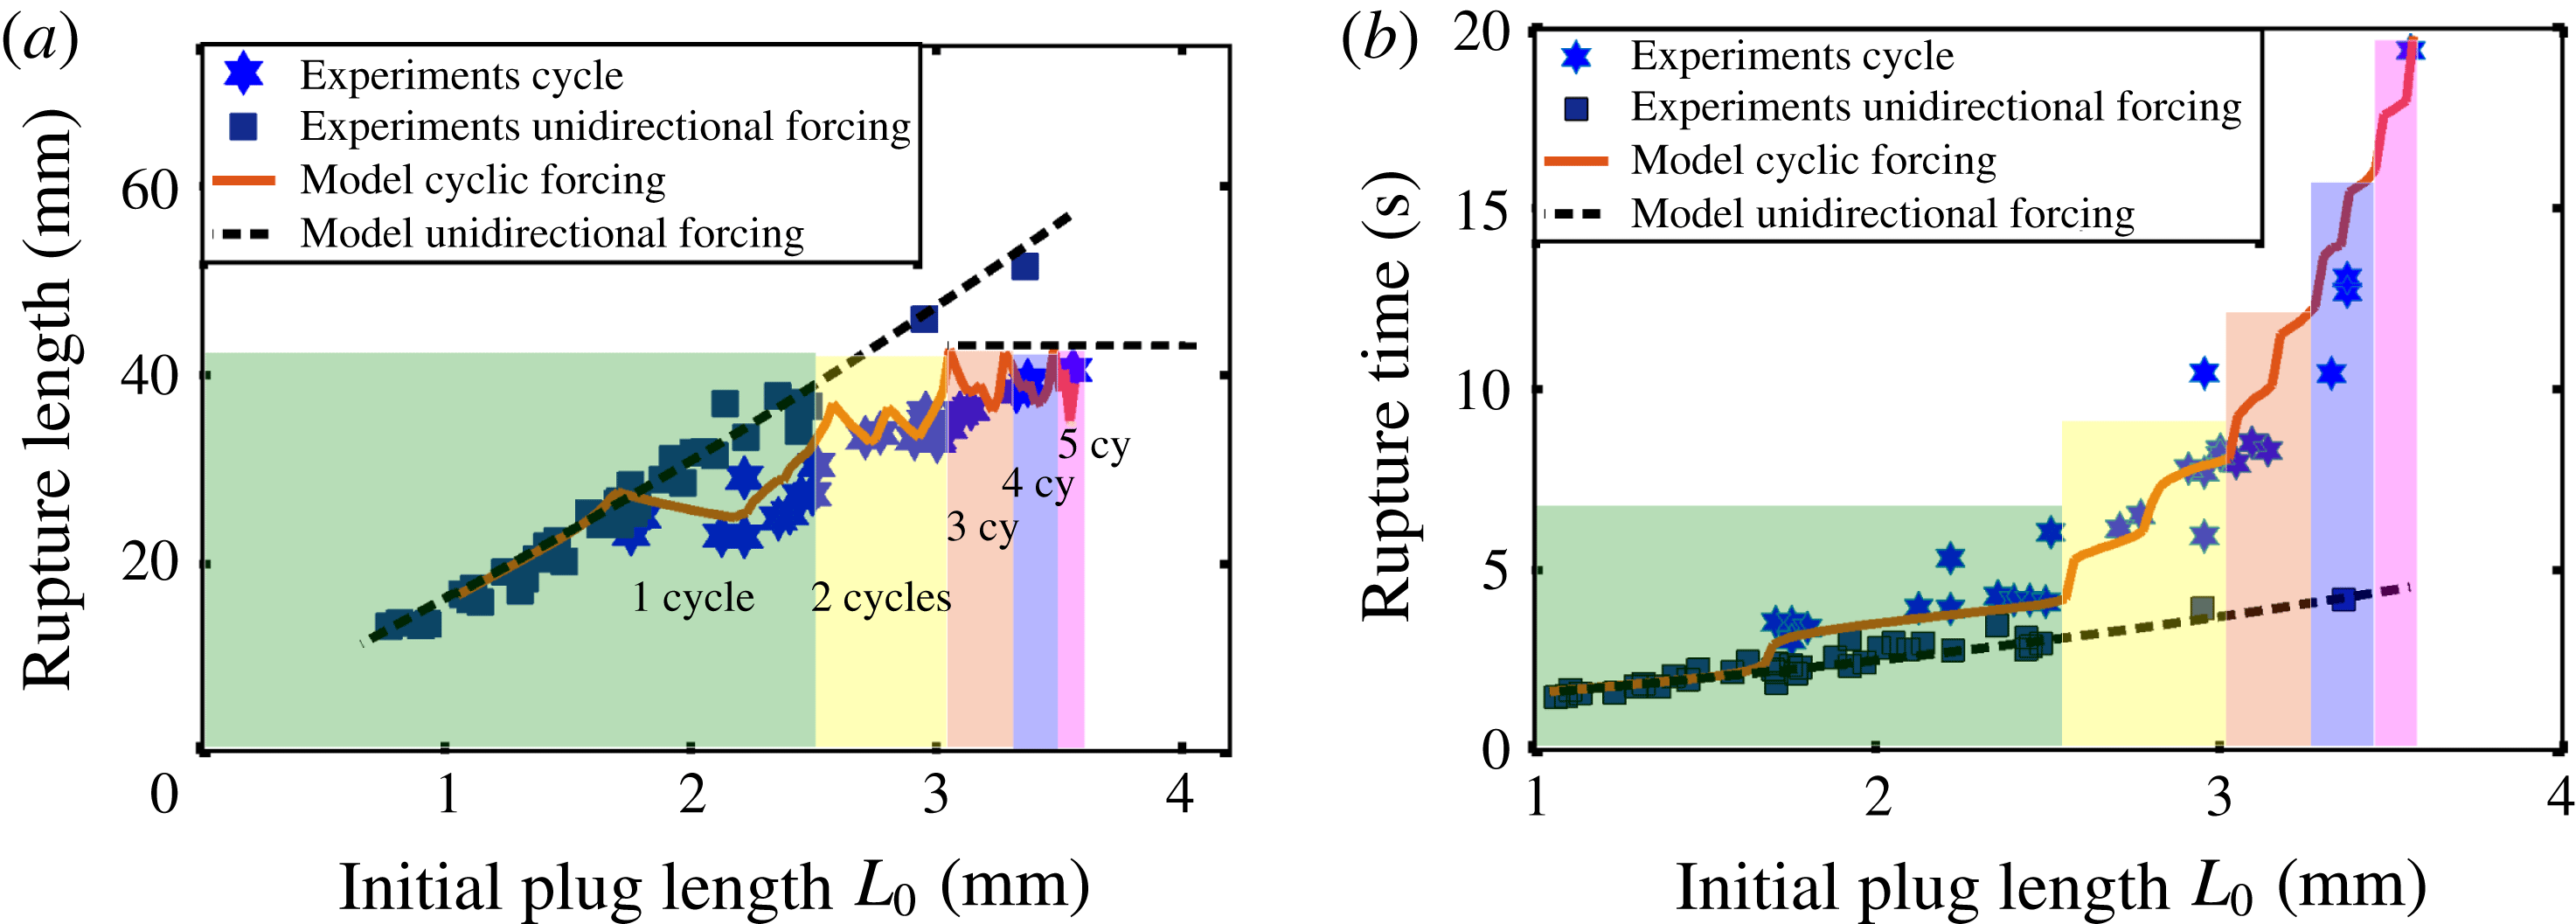
As long as the liquid plug breaks during the first half-cycle, the cyclic forcing (red solid line) and the unidirectional forcing (black dotted line) are of course equivalent. When the plug starts going back (for initial length
 $L_{0}\approx 1.7~\text{mm}$
), brutal changes in the tendencies are observed: the rupture length starts decreasing (figure 13
a), while the increase in the rupture time is on the contrary exacerbated (figure 13
b). For larger plug lengths, the number of cycles required to achieve plug rupture increases rapidly. Since each change in the plug flow direction is associated with some sharp fluctuations of the rupture length, this increase in the number of cycles leads to a saturation of the rupture length (figure 13
a). This is very different from the relatively linear trend predicted by our simulations (black dots) and observed experimentally in figure 4 for a unidirectional forcing. This saturation means that there is a maximal distance that a liquid plug can travel regardless of its size for a prescribed pressure cycle. An interesting point is that, despite this confinement, the plug rupture remains possible due to the hysteretic effects that enable a progressive acceleration of the liquid plug at each cycle, even if the liquid plug moves on the same portion of the tube.
(a) Experimental investigation and (b) numerical investigation of the rupture length of two liquid plugs of close initial lengths. The initial length of the plug in dashed lines,
 $L_{1}=2.5~\text{mm}$
, is smaller than the initial length of the plug in solid line,
 $L_{2}=2.85~\text{mm}$
, but nevertheless travels on a larger distance,
 $L_{d1}>L_{d2}$
, before its rupture. The evolution of these two plugs can also be seen in supplementary movies S3 and S4.
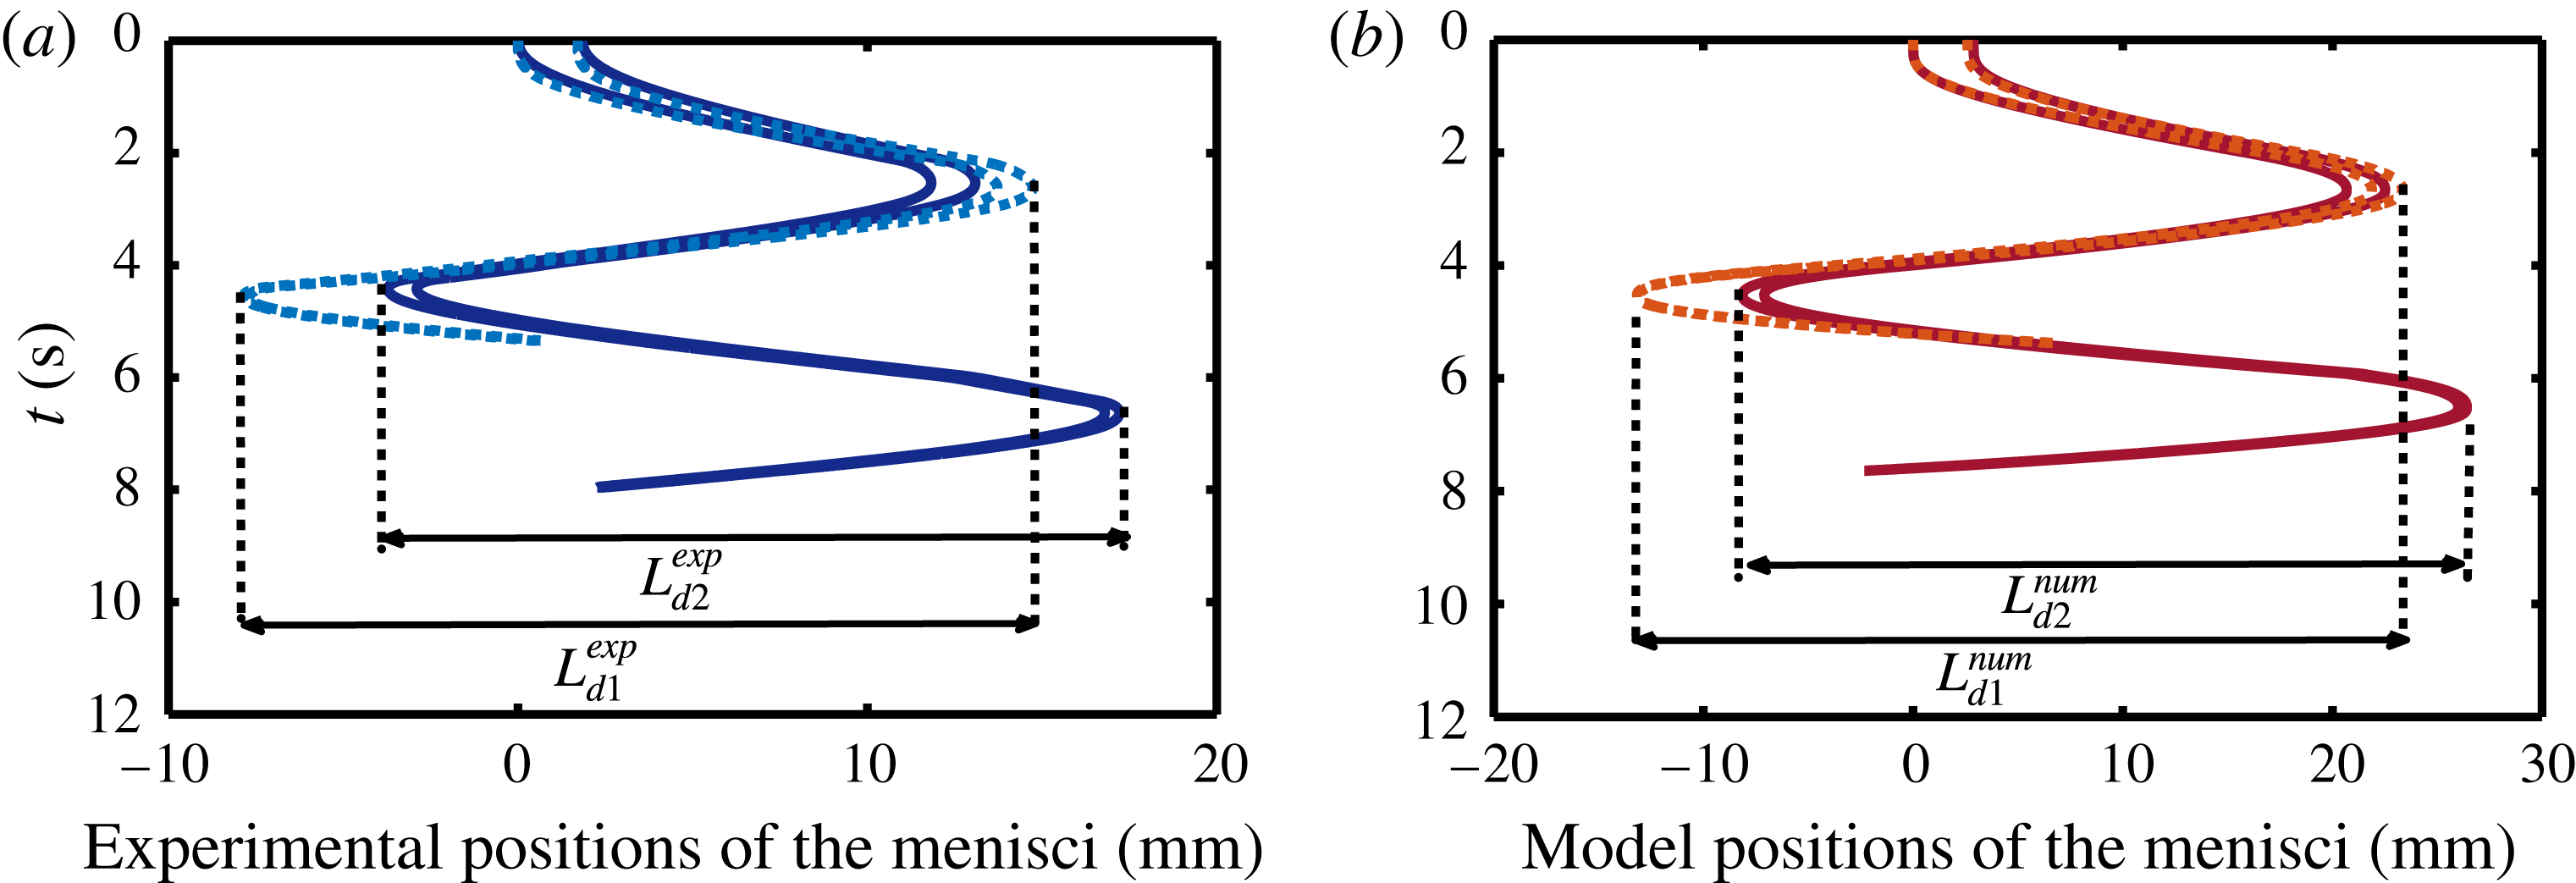
To understand the decrease in the rupture length observed when the flow direction is changed, we plotted the experimentally observed (figure 14
a) and numerically predicted (figure 14
b) spatio-temporal diagrams of the evolution of two plugs with initial lengths
 $L1=2.5$
mm (supplementary movie S3) and
 $L2=2.85$
mm (supplementary movie S4) in a region where the rupture length is decreasing when the initial plug length is increased. The experiments were performed with a pressure driving magnitude
 $P_{o}=60~\text{Pa}$
different from that for figure 13. So the positions of these two points in the rupture length graph are represented in figure 21 in appendix C (circled points). In figure 14 the dashed lines corresponds to
 $L1=2.5~\text{mm}$
and the solid lines to
 $L2=2.85~\text{mm}$
. The experimental (figure 14
a, blue line) and numerical trends (figure 14
b, red line) are similar. These figures show that the largest plug requires less space to break than the smallest plug
 $L_{d1}>L_{d2}$
. The origin of this rather counterintuitive behaviour again lies in memory effects. Since these two plugs are pushed with the same pressure head, the smallest plug with the lowest bulk resistance moves faster, leaves more liquid on the walls than the bigger one and thus goes further during the first half-cycle. When the sign of the pressure head is inverted, the smallest liquid plug will move on a more prewetted channel and thus (i) it will travel faster (since lubrication effects reduce its resistance to motion) and (ii) it will recover more liquid, thus slowing down the plug size decrease through the mass balance. The combination of these two effects enables the plug to reach a deeper location in the tube.
On the other hand, a comparison between unidirectional and cyclic forcing indicates that more time is required to break liquid plugs for cyclic motion than straight motion (figure 13 b). This is simply the result of the mass balance. As the liquid plug moves back and forth on prewetted capillary tubes it recovers some liquid, whereas it does not when it moves only on a dry capillary tube. This slows down the plug size evolution.
(a) Rupture length and (b) rupture time of liquid plugs pushed with a cyclic pressure driving given by (3.1) as a function of their initial lengths
 $L_{0}$
for three different time periods,
 $T=2$
, 4 and 6 s.

Finally, a comparison of the evolution of the rupture time and rupture length in figure 13 shows that the rupture time undergoes an exponential-like growth when the rupture length approaches the saturation zone (for length
 $L_{o}>L_{s}$
) with
 $L_{s}\approx 2.4~\text{mm}$
. To confirm this trend, we performed numerical simulations of the rupture time and rupture length for three different time periods (see figure 15). For each period, the evolution is relatively similar and the semi-log graph (figure 15
b) indeed confirms that the rupture time follows an exponential growth (rupture time
 $\propto e^{x/L_{c}}$
) for initial plug lengths larger than a critical length
 $L_{s}$
. We calculated both the critical saturation length
 $L_{s}$
and the characteristic length
 $L_{c}$
for the three time periods
 $T=2$
, 4 and 6 s and found the following values:
 $$\begin{eqnarray}\displaystyle & \displaystyle \text{critical saturation lengths}\quad L_{s2}\approx 1.6~\text{mm},\quad L_{s4}\approx 2.4~\text{mm},\quad L_{s6}\approx 3.4~\text{mm}, & \displaystyle\end{eqnarray}$$
 $$\begin{eqnarray}\displaystyle & \displaystyle \text{characteristic lengths}\quad L_{c2}\approx 0.6~\text{mm},\quad L_{c4}\approx 0.7~\text{mm},\quad L_{c6}\approx 0.8~\text{mm}. & \displaystyle\end{eqnarray}$$
These two factors depend on the time period
 $T$
. This means that for each time period and pressure forcing, the rupture time becomes exponentially long when
 $L_{o}-L_{s}\gg L_{c}$
and the pressure driven plug dynamics asymptotes to a stable periodic propagation.
As a conclusion of this section, large liquid plug breaking is achieved in a more confined space but in longer time with a cyclic forcing than with a unidirectional pressure forcing. Moreover, the rupture times grow exponentially when the plug initial length exceeds a critical length
 $L_{s}$
, whose value depends on the cycle period. In this regime, the liquid plug dynamics becomes quasi-periodic.
5 Conclusion
Despite its occurrence in practical situations such as pulmonary flows in pathological conditions, the specificity of the response of liquid plugs to cyclic driving has not been studied so far experimentally and theoretically. The present results show that the dynamics and rupture of a liquid plug strongly depend on the type of forcing. A flow rate cyclic forcing results in periodic oscillations of the plug and no rupture. In contrast, a pressure cyclic forcing enables airway reopening through a progressive acceleration of the liquid plug dynamics and reduction of its size. This departure from a periodic response originates from two memory effects which decrease the resistance of the plug to motion at each cycle: (i) the cyclic reduction of the plug size which reduces the viscous resistance and (ii) a lubrication effect which reduces the front interface resistance. These two coupled effects are strongly connected to the thickness of the liquid film lying on the walls, which keeps a memory of previous plug displacements. In addition, this study shows that the rupture of a liquid plug with a prescribed pressure cycle is a spatially bounded phenomenon regardless of the initial plug length. In other words, large plug can be ruptured in a limited space with a cyclic forcing, while more and more space is required to break plugs of increasing size with a unidirectional forcing. The trade-off is that more time is nevertheless required and that this time grows exponentially above a critical length, which depends on the cycle period and the applied pressure.
The analysis of the underlying physics was achieved through a comparison of extensive experimental data to a reduced dimension model. This model quantitatively predicts the plug behaviour for the numerous pressure cycles studied in this paper. Moreover it is in principle valid for any pressure cycle in the visco-capillary regime (low capillary, Reynolds and Bond numbers). Combined with constitutive laws for the plug divisions at bifurcation, it might serve as a basis to simulate cyclic plug dynamics in more complex geometries, or even the dynamics of mucus plugs in distal pulmonary airways. In this last case, however, complementary elements such as the influence of wall elasticity, the non-Newtonian fluid properties of mucus or the presence of an initial mucus layer on the walls should be implemented to achieve realistic simulations. In particular, it is envisioned that the presence of a prewetting film on the walls might lead to either plug ruptures or persistent occlusions, as was demonstrated by Magniez et al. (Reference Magniez, Baudoin, Liu and Zoueshtiagh2016) for unidirectional driving. Complete models of plug dynamics would open tremendous perspectives, such as the ‘virtual testing’ of new strategies to improve airways clearance for patients suffering from chronic obstructive pulmonary disease or cystic fibrosis. But it might also open perspectives to design robust pressure controllers that enable stable control of liquid plugs. Indeed, the instability to breaking is a major drawback to manipulate plugs with pressure controllers.
Acknowledgements
The authors would like to express their profound gratitude to the four anonymous reviewers, for their extremely interesting suggestions that helped us substantially improve the quality of the manuscript. The author would also like to thank P. Favreau for performing the simulations of the viscous pressure drop in the liquid plug presented in appendix B, and S. V. Diwakar for his critical reading of the first version of the manuscript. The authors acknowledge the financial support from Université de Lille.
Supplementary movies
Supplementary movies are available at https://doi.org/10.1017/jfm.2017.828.
Appendix A. Method
In the two following sections, we describe how the flow rate and pressure cyclic drivings are enforced.
A.1 Flow rate cyclic driving
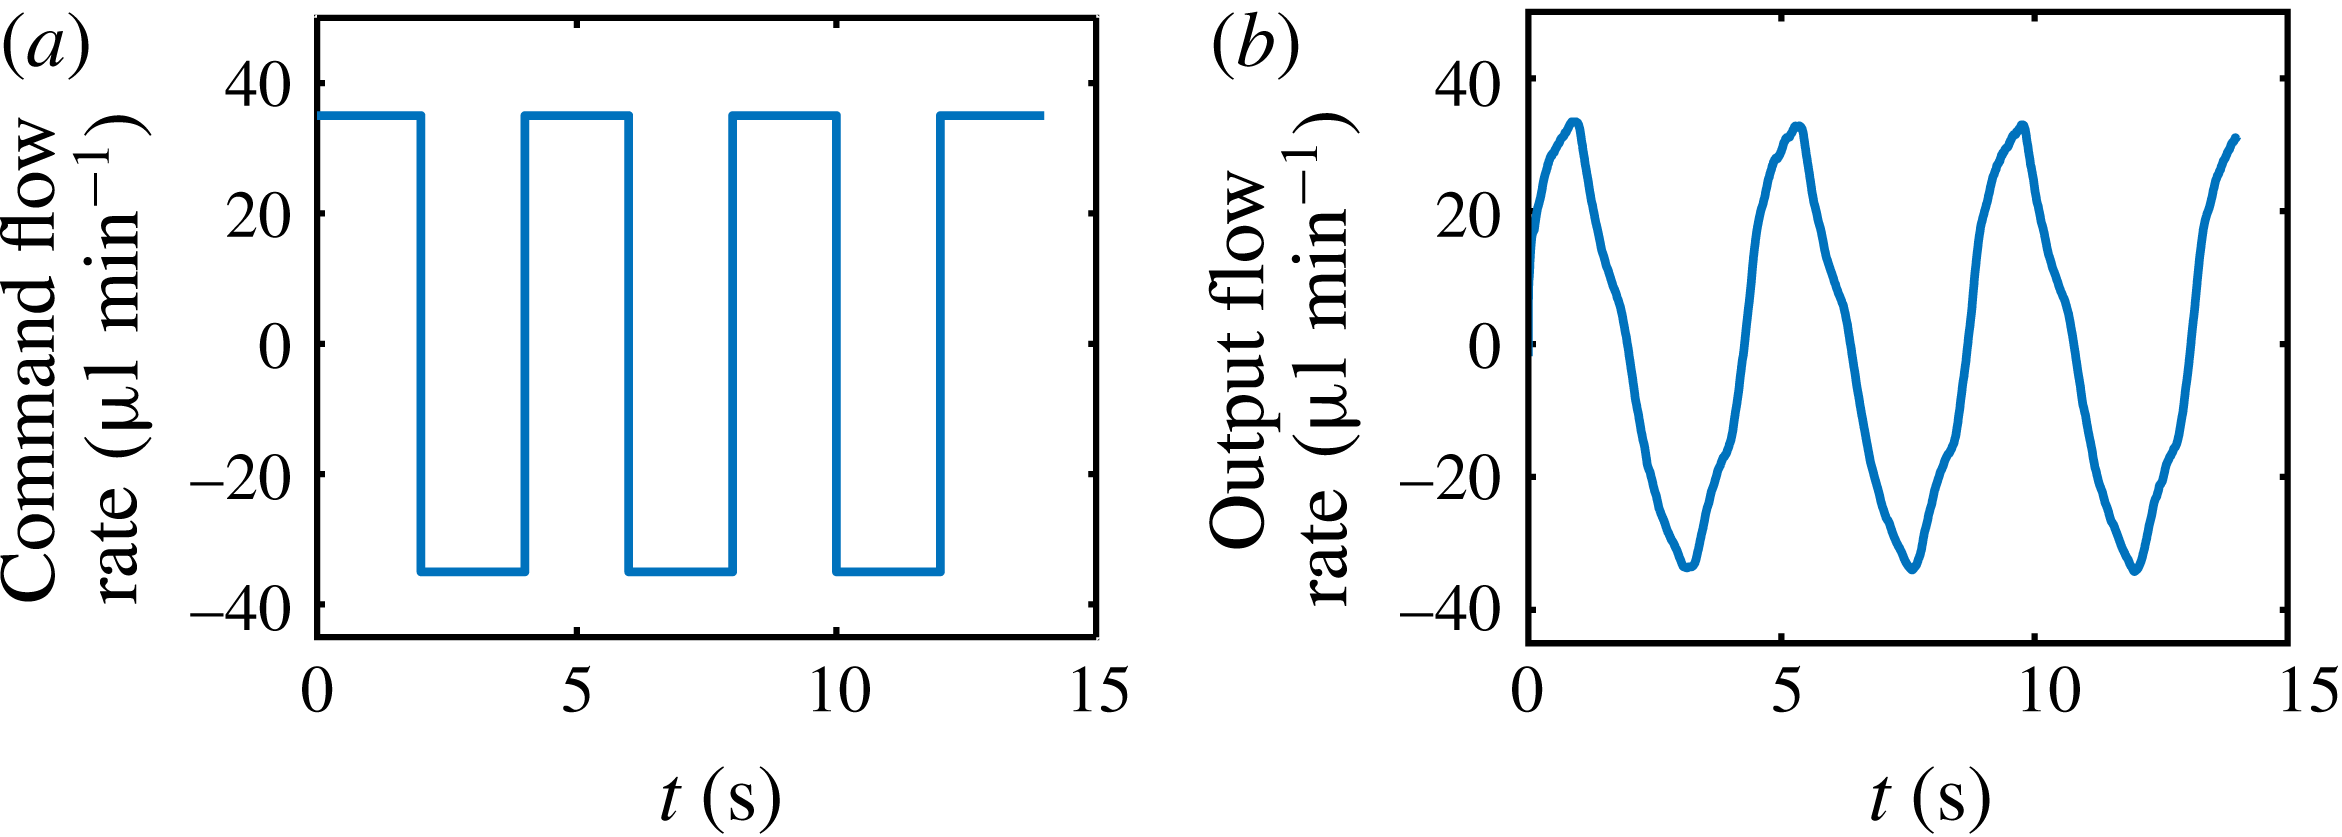
The flow rate forcing represented in figure 5(a) is obtained by connecting only one end (left side) of the capillary tube to a programmable syringe pump KdScientific 210. The command flow rate is a square signal with alternative motion in the right and left directions: see figure 16(a). Owing to the response time of the syringe pump and compressibility effects, the actual flow rate imposed on the liquid plug may differ strongly. Thus, the imposed flow rate is monitored directly by measuring the motion of the left interface of the liquid plug. This signal is represented in figure 16(b).
(a) Command flow rate ordered to the programmable syringe pump. Positive values correspond to a motion from left to right. (b) Actual flow rate forcing measured by monitoring the motion of the left interface of the plug.
A.2 Pressure cyclic driving
The pressure driving represented in figure 5(b) is obtained by connecting two channels of the MFCS programmable pressure controller to both ends of the capillary tube. This pressure controller based on valve and sensors enables automated control of the driving pressure. We impose alternatively a constant command overpressure (compared to atmospheric pressure)
 $P_{1}^{c}$
and
 $P_{2}^{c}$
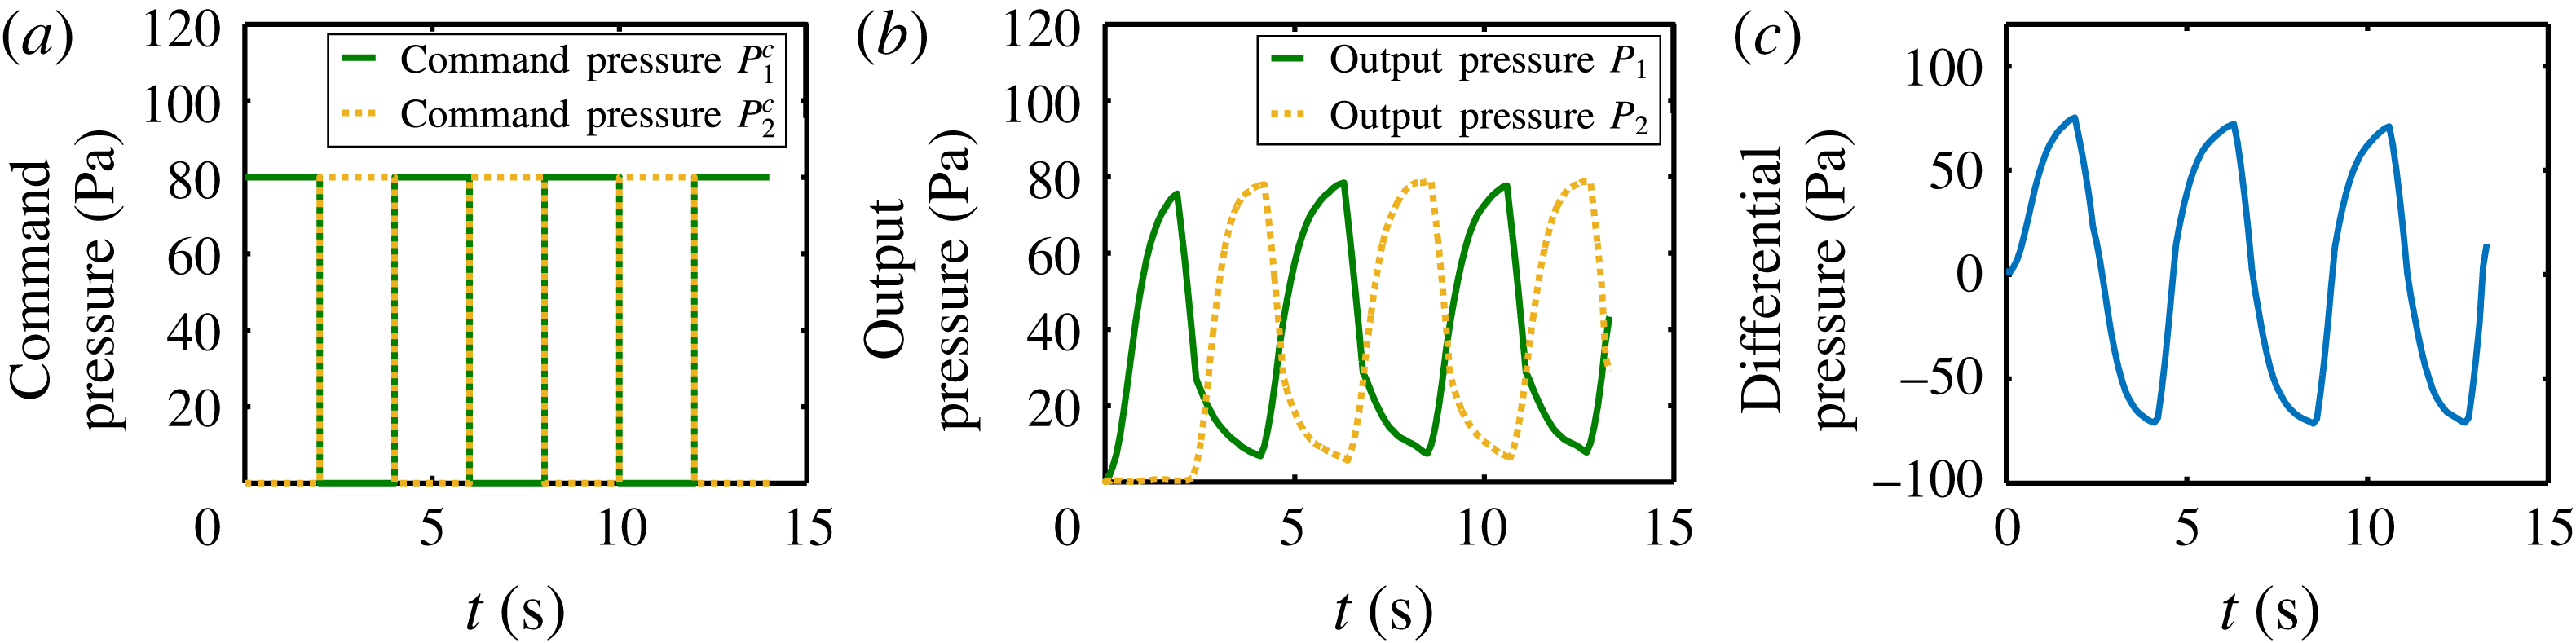
to each channel of the pressure controller while the pressure of the other channel goes down to atmospheric pressure, as represented in figure 17(a). Due to the response time of the pressure controller (resulting from the response time of the valve, and the feedback loop, the actual overpressure imposed on each side of the pressure controller, measured by an integrated pressure sensor, is represented in figure 17(b). The final pressure forcing thus corresponds to the difference of pressure
 $\unicode[STIX]{x0394}P_{t}=P_{1}^{c}-P_{2}^{c}$
between the two ends of the channel (see figure 17
c).
(a) Command pressures
 $P_{1}^{c}$
and
 $P_{2}^{c}$
imposed via the software Maesflow to each channel of the MFCS Fluigent pressure controller, connected respectively to each extremity of the capillary tube. (b) Resulting output pressure signals effectively imposed on each end of the capillary tube, measured with an integrated sensor. The pressure represented in these figures correspond to overpressures compared to atmospheric pressure. (c) Pressure driving
 $\unicode[STIX]{x0394}P_{t}=P_{1}-P_{2}$
imposed on the liquid plug.
A.3 Note on compressibility effects
Compressibility effects are critical for flow rate driven experiments since they increase the response time of the syringe pump (difference between the piston motion and the actual motion of the fluid in the capillary). To reduce this response time, the syringes are filled with water. Moreover, since the imposed flow rate is measured directly by monitoring the displacement of the left interface, compressibility effects are accounted for in the forcing condition represented in figure 5(a). For pressure driven experiments however, the pressure is homogenised at the speed of sound (extremely rapidly) and the response time is mainly due to the valve and sensor response time. Thus, the pressure measured at the exit of the pressure controller with integrated pressure sensors is almost identical to the pressure imposed at both sides of the capillary tube (if we neglect the pressure losses due to the air flow in the tubes compared to the pressure losses due to the presence of the liquid plug).
Appendix B. Direct numerical simulations of the viscous pressure drop inside the liquid plug
Configuration simulated with the VOF code Openfoam: a liquid plug is pushed at constant flow rate with an air finger inside a prewetted capillary tube. (a) Phase volume fraction
 $\unicode[STIX]{x1D6FC}$
. The air is represented in blue
 $(\unicode[STIX]{x1D6FC}=0)$
and the liquid in blue
 $(\unicode[STIX]{x1D6FC}=1)$
. (b) Zoom of the edge of the liquid plug to show the precision of the mesh.
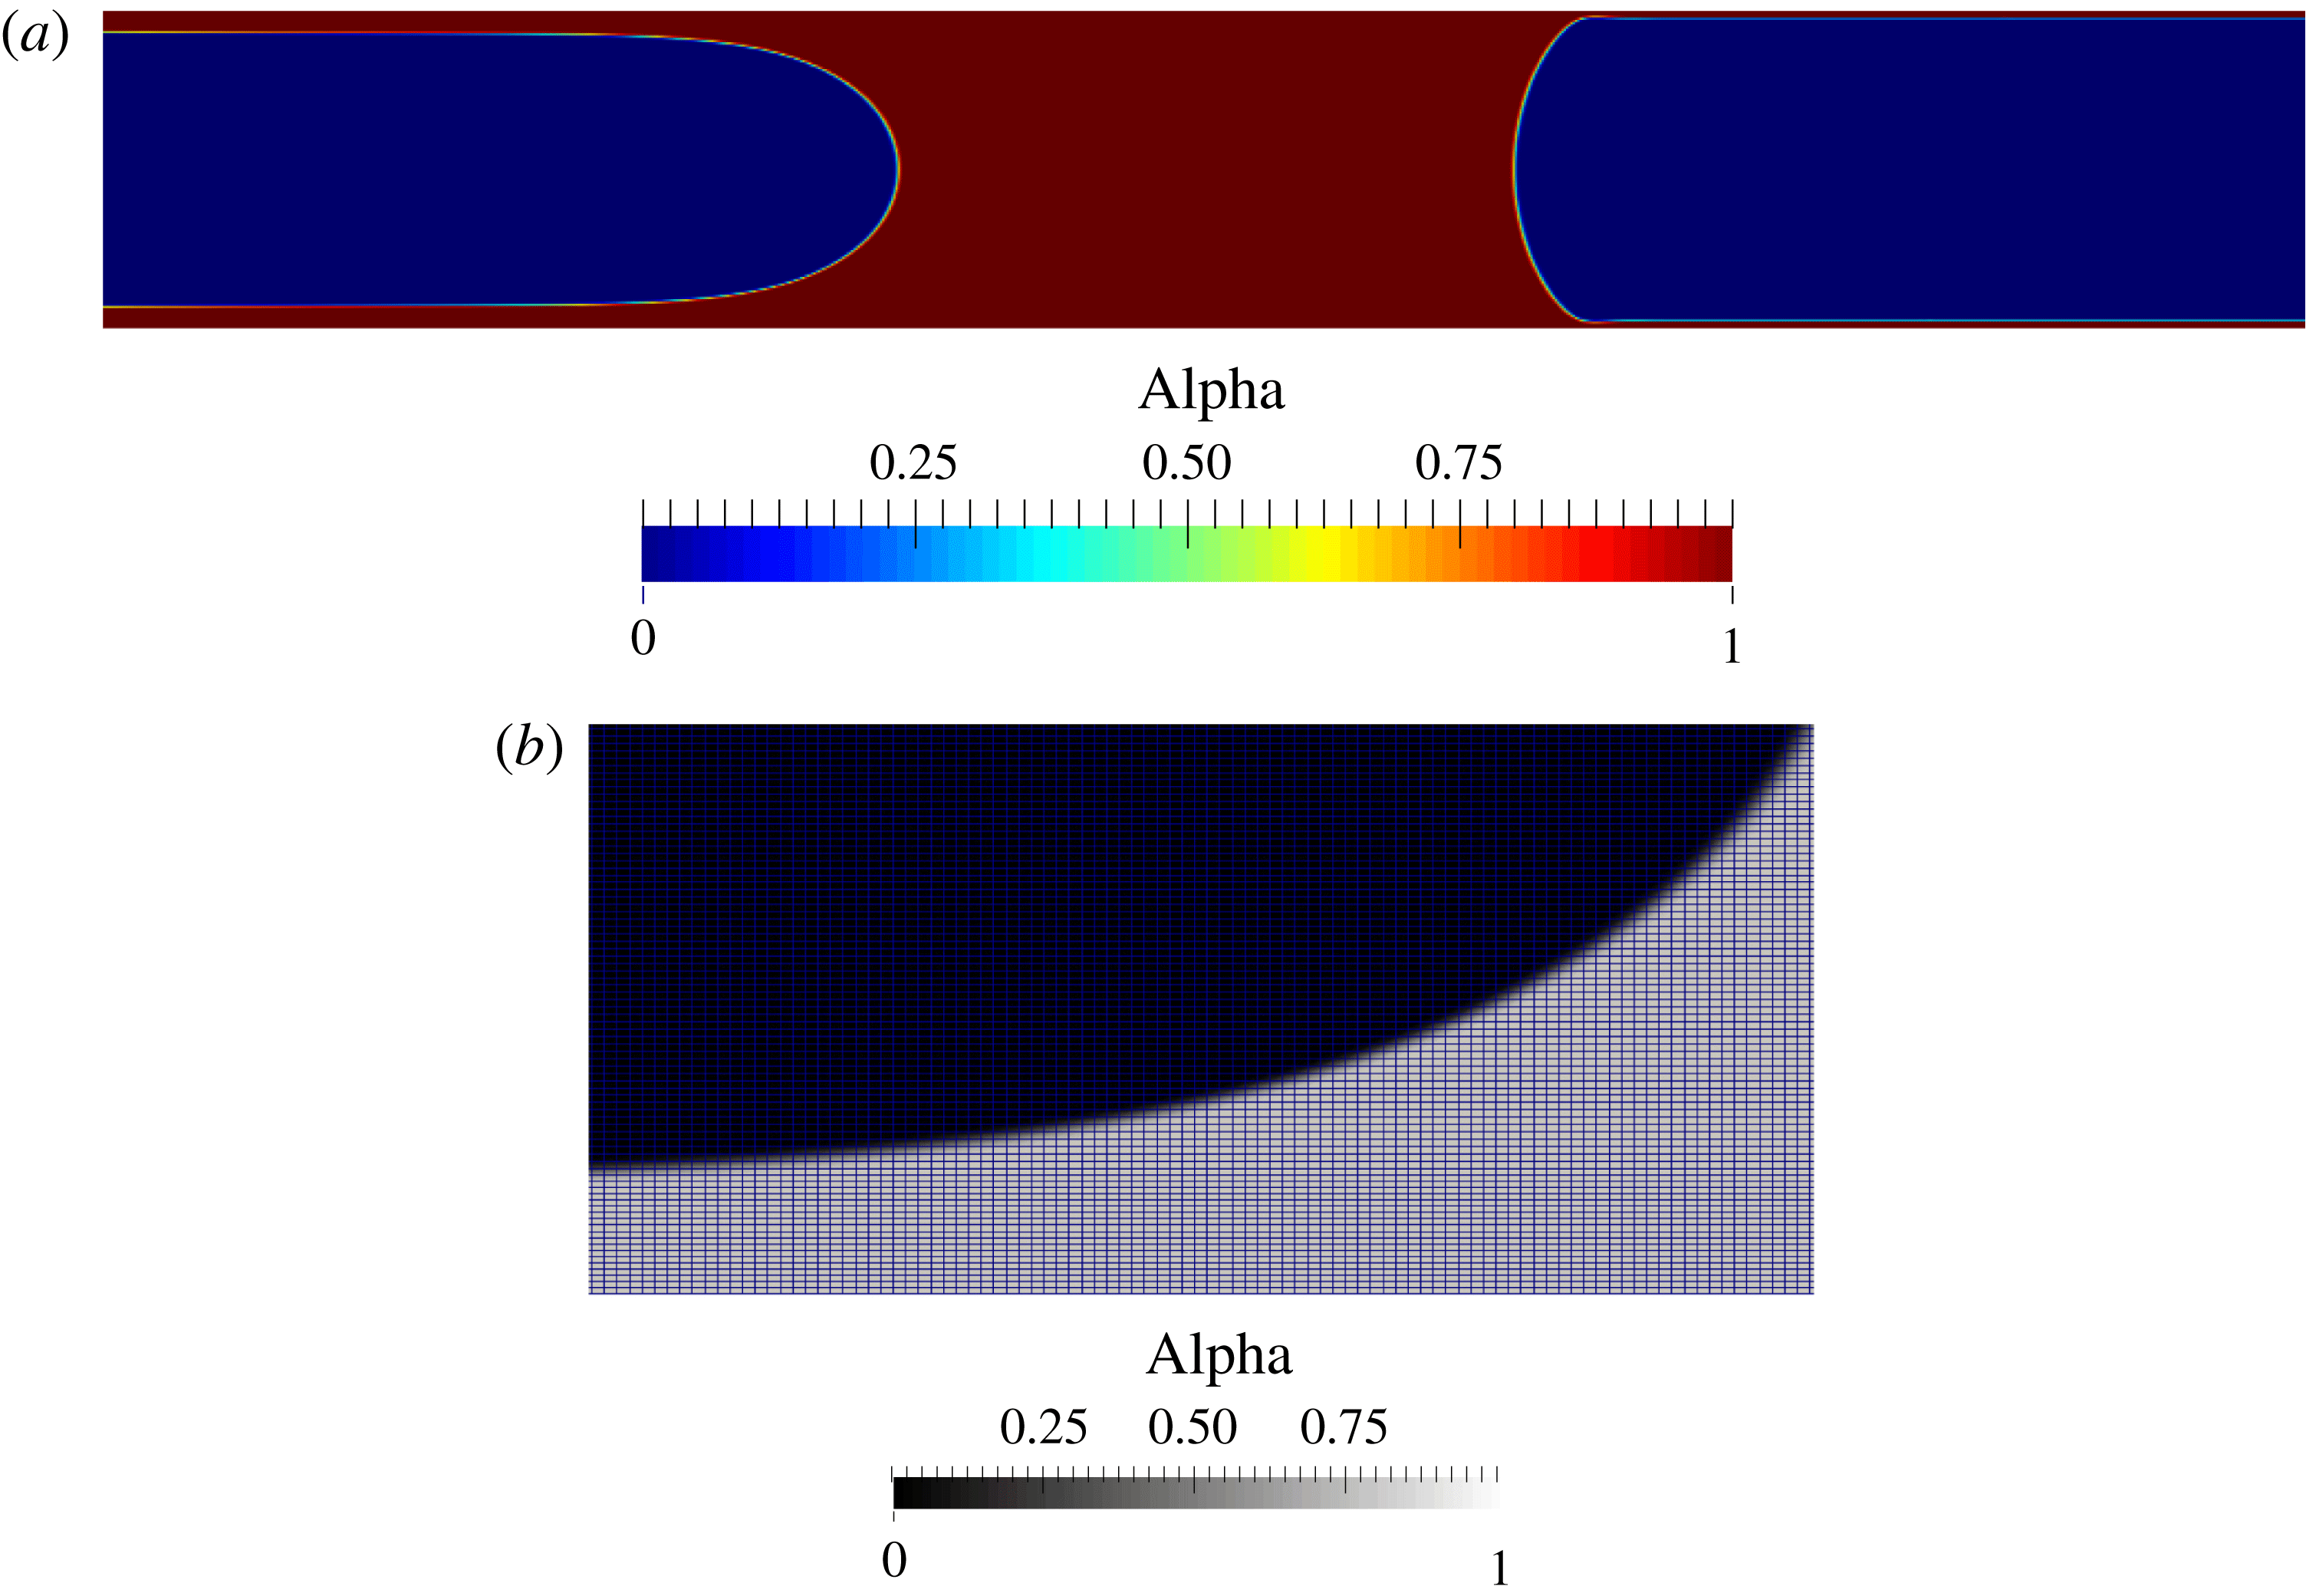
Equation (2.3) relies on the assumption that the flow inside the liquid plug is a Poiseuille flow. In a Poiseuille flow, the liquid velocity is maximum at the centre of the tube and decreases down to zero at the walls. This flow structure is not compatible with the boundary conditions imposed by the two menisci: a constant velocity all over the liquid/air interface (in the absence of interfacial deformation). Therefore, fluid recirculation will occur at the edges of the plug to match this boundary condition. For long plugs this recirculation is expected to play a minor role. Thus (2.3) should give a correct approximation of the pressure drop inside long plugs. However the accuracy of this approximation should decrease as the length of the plug drops. To test the validity of (2.3), we performed two-dimensional direct numerical simulations of a flow rate driven liquid plug in a capillary tube with the Openfoam VOF code (see figure 18). This code was modified to include a regularisation technique (Hoang et al.
Reference Hoang, Steijn, Portela, Kreutzer and Kleijn2013), which reduces parasitic currents. The evolution of the viscous pressure drop as a function of the plug size was evaluated by pushing a liquid plug at a constant flow rate corresponding to
 $Re=2$
and
 $Ca=5\times 10^{-2}$
in a prewetted tube (layer of thickness corresponding to 4 % of the tube width
 $w$
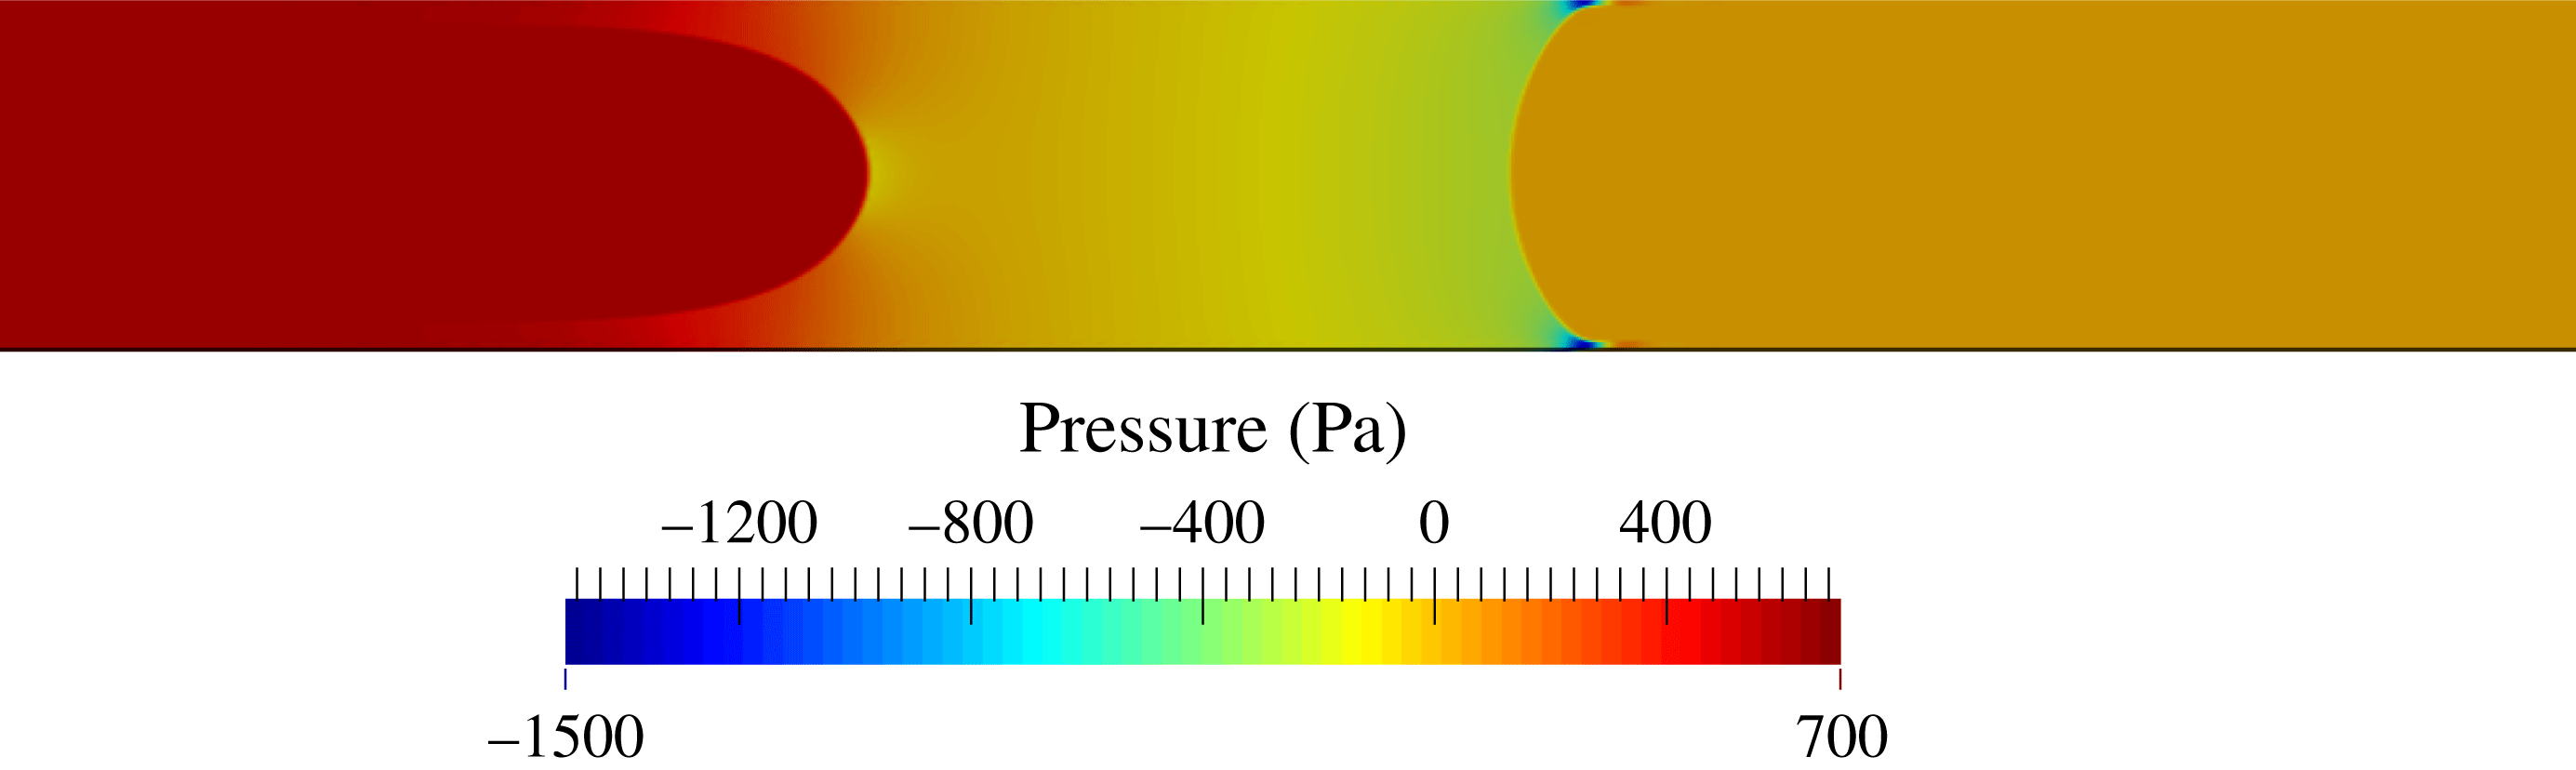
). The properties of the liquid are the same as those used in the experiments. A 825 000 point structured mesh was used with a refinement close to the walls (see figure 18). Figure 19 shows the computed pressure drop inside the liquid plug and the air. Since the input flow rate leads to a deposition of a trailing film thicker than the prewetting film, the length of the plug shrinks, which enables the evaluation of the pressure drop for various plug lengths with a single numerical simulation. The comparison between Poiseuille’s law
 $\unicode[STIX]{x0394}P_{visc}^{bulk}=(12\unicode[STIX]{x1D707}L_{p}/w^{2})U$
and simulations is shown in figure 20(a) with a zoom of small values of the plug length in figure 20(b). This comparison shows that the discrepancy between the formula remains weak (below 4.5 % for plugs with sizes
 $L_{p}>w$
) but increases up to 25 % for plugs whose size lies between
 $1/4w$
and
 $w$
. This larger discrepancy observed for small plugs is nevertheless not critical since, in this case, the viscous pressure drop is significantly smaller than the interfacial pressure drop. Thus this discrepancy will have a minor effect on the plug dynamics.
Pressure variation (in Pa) inside the plug and the air in the configuration represented in figure 18.
Comparison of the simulated pressure drop
 $\unicode[STIX]{x0394}P_{visc}^{bulk}$
(blue dots) and Poiseuille law (red dashed line) as a function of the dimensionless plug length
 $L_{p}/D$
, with
 $D$
the tube diameter. (a) Evolution for large plug. (b) Zoom for small plugs.

Appendix C. Supplementary figure
The additional figure 21 compares simulations and experiments of the rupture length for a different driving pressure from that used in figure 13.
Rupture length of a liquid plug pushed with a cyclic pressure driving given by the analytical function
 $\unicode[STIX]{x0394}P_{t}=59\exp (-6\exp (-3.5t))$
for
 $t\in [0,T]$
,
 $\unicode[STIX]{x0394}P_{t}=(-1)^{n}(P_{c}-P_{d})$
for
 $t\in [nT,(n+1)T]$
with
 $P_{c}=59\exp (-2.2\exp (-3.5(t-nT)))$
and
 $P_{d}=59\exp (-1.1(t-nT))\exp (-0.06\exp (-1.1\ast (t-nT)))$
,
 $T=2.1~\text{s}$
the half-period and
 $n\in \mathbb{N}^{\ast }$
. Blue stars correspond to experiments; the red curve is the result from our simulations. The circled experimental points correspond to plugs of initial lengths
 $L_{1}=2.5~\text{mm}$
and
 $L_{2}=2.85~\text{mm}$
, whose evolutions are compared in figure 14.