INTRODUCTION
In starfish, growth in size has been described as highly plastic (reviewed by Lawrence & Lane, Reference Lawrence, Lane, Jangoux and Lawrence1982) and the maximal size of a population is thought to be adjustable to the environmental fluctuations. Shrinkage in size has been reported (Vevers, Reference Vevers1949; Jangoux & Van Impe, Reference Jangoux and Van Impe1977; Siebers, Reference Siebers1979); it would allow the individuals to better fit to their environment (Ebert, Reference Ebert1996), as small individuals require fewer resources, and increase their chances of survival. This ‘indeterminate' growth, which is rapidly adjusted to the environment, is one of the asteroid characteristics that explains their important role in marine communities (Menge, Reference Menge, Jangoux and Lawrence1982).
The starfish Asterias rubens (Linnæus, 1758) form resilient populations in contrasted environments all along the east Atlantic coasts, from the White Sea and Iceland to Senegal (Hayward & Ryland, Reference Hayward and Ryland1990) and along the north-west Atlantic coast (synonymous with Asterias vulgaris, Verrill, 1866: see Clark & Downey, Reference Clark and Downey1992; Wares, Reference Wares2001). They succeed in the rocky intertidal as well as in subtidal environments down to 650 m (Hayward & Ryland, Reference Hayward and Ryland1990). If most of these populations live in marine water, A. rubens can also be found in the Baltic Sea at salinities as low as 8 (Kowalski, Reference Kowalski1955), fjords and estuaries (Binyon, Reference Binyon1976; Falk-Petersen, Reference Falk-Petersen1982) and is able to withstand the varying salinity of the White Sea (Sarantchova, Reference Sarantchova2001). As no growth lines or other structures allowing individual aging have been found in the genus Asterias (Smith Reference Smith1940; Feder, Reference Feder1956; Hatanaka & Kosaka, Reference Hatanaka and Kosaka1959; Crump, Reference Crump1971; Kvalvagnaes, Reference Kvalvagnaes1972), modal analysis of size–frequency distributions has been the only way to assess the demographic structure of A. rubens populations. The recruitment is generally annual and clearly defined in time (Smith, Reference Smith1940; Hancock, Reference Hancock1958; Guillou, Reference Guillou1983; Nichols & Barker, Reference Nichols and Barker1984). It results in a distinct cohort of juveniles that can be tracked by size–frequency analysis for at least one year. Growth is reported to begin immediately after recruitment. However, Nauen (Reference Nauen1978) thought that recruits could delay their growth for several months when food conditions are poor, a period she called ‘waiting stage'. According to most authors, growth is linear over several years, depending on the considered population (Guillou, Reference Guillou and Jangoux1980, Reference Guillou1983; Nichols & Barker, Reference Nichols and Barker1984). On the contrary, Nauen (Reference Nauen1978) reported that it follows the Von Bertalanffy's equation, 80% of the asymptotic size being reached after 1 year. Such discrepancies may result from differences in environmental factors but also in the methods used as most studies of A. rubens population dynamics have been conducted on one or two populations from the same geographical area and using a variety of methods, sometime arbitrary, for separating cohorts.
Some observations are however common to all studies. Namely, all size-classes show seasonal variations of growth with elevated growth in summer and reduced or negative growth in winter (Hancock, Reference Hancock1958; Guillou, Reference Guillou1983; Nichols & Barker, Reference Nichols and Barker1984). Growth is reduced in intertidal compared to subtidal populations. Many factors which affect growth have been suggested; the main one is considered to be food (Smith, Reference Smith1940; Hancock, Reference Hancock1958; Nauen, Reference Nauen1978; Guillou, Reference Guillou and Jangoux1980; Nichols & Barker, Reference Nichols and Barker1984; Guillou & Guillaumin, Reference Guillou, Guillaumin, Keegan and O'Connor1985) but low salinity which causes dwarfism (Kowalski, Reference Kowalski1955), temperature which controls feeding rates (Hancock, Reference Hancock1958), emersion, and wave exposure have also been involved (Vevers, Reference Vevers1949; Guillou, Reference Guillou1983). However, the actual role of these factors has never been tested experimentally except for some preliminary experiments on food supply (Vevers, Reference Vevers1949; Hancock, Reference Hancock1958).
The goal of the present study is to determine the main factors controlling juvenile growth and population structure of Asterias rubens in the intertidal zone. For that purpose, we compared, using the same methods, several intertidal populations of A. rubens from a wide geographical range and living under contrasting habitats. We also tested experimentally the effects of food supply, salinity, temperature and emersion on growth.
MATERIALS AND METHODS
Field study
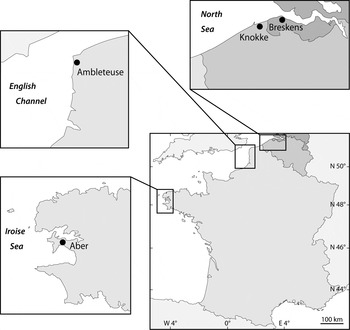
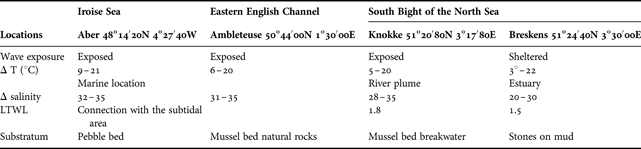
The study was carried out at 4 intertidal locations chosen to encompass a large range of environmental situations and a relatively broad geographical range (Figure 1; Table 1): Breskens (the Netherlands), Knokke (Belgium), Ambleteuse (Nord-Pas-de-Calais, France) and Aber (Brittany, France). All of these locations were known to have harboured stable starfish populations from more than 2 decades (Jangoux & Vloebergh, Reference Jangoux and Vloebergh1973; Guillou, Reference Guillou and Jangoux1980; Dubois, personal communication).
Location of the study sites on the north-west coast of Europe.

Characteristics of the environment at the four studied locations.
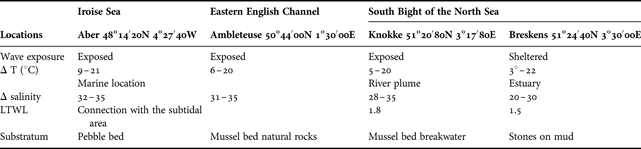
LTWL, low tide water level (m) at which the population is totally emerged; Substratum, area where starfish were found at low tide; Δ T (°C), seawater temperature range (from January to August); Δ salinity, annual salinity range. Salinity and temperature were established from measurements at low tide.
Each location was visited monthly. Knokke, Aber and Breskens were first visited in April 2000, Ambleteuse in January 2001. The Breskens population was followed until June 2002 and the 3 others until November 2002. Temperature and salinity were measured at low tide using an electronic thermometer (Ama-digit ad15th) and a hand refractometer (Atago S/Mill). As many starfish as possible were carefully collected at each visit (up to 500). Their ray was assessed by the length of the longer arm from mouth to tip, in millimetres, using Vernier calipers. Regenerating starfish were not considered. The measured starfish were thrown back far from the studied site to prevent the sampling of the same individuals subsequently.
For modal analysis of size–frequency distributions, the individuals were pooled in size-classes of 5 mm range. A sum of normal distributions (called below ‘cohorts') was adjusted to each monthly size–frequency distribution using MIX 3.0 (Macdonald & Pitcher, Reference Macdonald and Pitcher1979), which is based on the maximum likelihood determination. Samples with less than 150 individuals were discarded from the modal analysis. The recruits (sensu Ebert, Reference Ebert, Jangoux and Lawrence1983) were the smallest individuals forming a normal mode in a population. Growth of juveniles was determined using the mean size of these fitted modes. The proportion of starfish represented by these normal modes was used as an indicator of recruitment intensity. As part of the recruits could be cryptic or immersed and therefore undersampled, recruitment intensity was assessed after it ‘stabilized' in proportion, i.e. 2–3 months after first observation.
In February and August 2001, the area where the recruits first appeared was sampled, to determine the abundance and type of food available to juveniles. Three random samples of 400 cm2 of rocks were scraped. As this gathering is destructive, a quadrat cannot be sampled twice during the studied period. They were fixed in formaldehyde (7% in seawater) and then sorted in the laboratory. This was done in each location except Ambleteuse where recruits were detected deep in cracks, which were unsuitable for sampling. The fauna was determined to the genus level and then grouped in taxa for organic biomass determination. Taxon subsamples were first dried at 60°C for 48 hours and weighted and then burned at 450°C for 4 hours (Majeed, Reference Majeed1987) and weighted again allowing the determination of the organic weight.
Laboratory studies
The starfish were brought back to the laboratory in aerated seawater, maintained in aquaria in conditions closed to those of the field and starved for 24 hours for acclimation before experiments. The starfish were measured as described for the field study. Except where otherwise stated, the starfish were fed with mussels of suitable size according to the relation established by Sommer et al. (Reference Sommer, Meusel and Stielau1999) between the size of the starfish and the average size of eaten mussels (mussels of 2 to 50 mm shell length for starfish of 5 to 65 mm ray length). All experiments were performed on juvenile starfish (5 to 35 mm ray length at the beginning of the experiments), i.e. individuals that are below the size of maturity in these populations (Joly et al., Reference Joly, Guillou, Dubois, Féral and David2003).
INFLUENCE OF FOOD SUPPLY ON JUVENILE GROWTH
At Aber, despite the presence of an abundant mussel bed, most starfish, and particularly juveniles, are found in an accumulation of pebbles where prey abundance seemed to be low. Therefore, juveniles (collected in February 2001 at Aber, 9.8 ± 3.6 mm ray, mean ± standard deviation) were reared during 5 months and fed on three different diets: (1) mussels ad libitum; (2) mussels at a level corresponding to half of satiety; and (3) ‘Aber food supply' obtained by scraping an area of 0.28 m2 of pebbles from Aber. Starfish fed ad libitum were provided daily with an excess of mussels, the number of eaten mussels being regularly counted all through the experiment to adjust to half satiety food supply (providing half the number of eaten mussels in the ad libitum treatment). ‘Aber food supply' was renewed before complete prey disappearance. Juveniles were placed in an open system in six 30 l aerated aquaria (12 starfish per aquarium, 2 replicates for each diet). Starfish size was measured monthly. Salinity stayed at 34–35 and the temperature rose from 10°C in February to 16°C in late June.
EMERSION INFLUENCE ON JUVENILE GROWTH
To test the influence of tidal rhythm on juvenile starfish growth, juveniles (collected in October 2002 at Knokke, 23.2 ± 4.3 mm ray, mean ± standard deviation) were reared during about 3 months (from 18 November 2002 to 28 February 2003) in 2 closed systems using the same water stock. One was designed to allow emersion of the starfish; the emersion periods were adjusted to the predicted periods when the natural Knokke population was uncovered (i.e. each time the sea level was lower than 1.70 m in Knokke). In the second system, the starfish were kept immersed. Emersion was carried out in 15 minutes and re-emersion took 4 minutes.
In each system natural seawater (200 l) circulated continuously. Each system was composed of 3 aerated aquaria (20 starfish per aquarium), a filtering unit (gravel and activated charcoal), a stock water tank and a pump. In the emersion–immersion system the pump was switched on or off by a timer. Seawater temperature was adjusted to the field temperature: 10–12°C during the first 3 weeks, then 6°C until the end of the experiment. Salinity, pH and NO3− concentrations were measured every day. Salinity was adjusted to 34–35. When NO3− concentration levels rose above 0.3 mg/l the seawater content of both systems was renewed.
In both systems, the starfish were fed ad libitum with mussels and the number of eaten mussels was recorded every week. The size of the starfish was measured monthly. At the end of the experiment, the righting time of the starfish was measured as the time in seconds required by a starfish to turn back after being placed on its aboral face (righting time is a commonly used indicator of stress and well-being of asteroids; Lawrence & Cowell, Reference Lawrence and Cowell1996).
INFLUENCE OF SALINITY VARIATIONS ON JUVENILE GROWTH
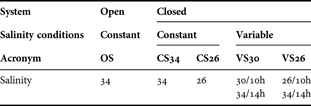
In Knokke and Breskens, populations are submitted to daily varying salinities due to the influence of the Scheldt River. To test the effect of such salinity variations, small starfish (collected in September 2003 at Aber, 24.5 ± 2.3 mm ray, mean ± standard deviation) were maintained in 5 experimental systems during 15 days (Table 2). The open system (control) was continuously supplied with water pumped in the Bay of Brest (France). The 4 closed systems (100 l) had a continuous flow of recycled natural seawater and a filtering unit of activated charcoal. At each salinity change in VS30 and VS26 systems (systems where starfish were exposed to varying salinity; see Table 2) the water content of all closed systems was renewed. Each system was aerated. Temperature of the systems was maintained at that of the open system, i.e. 18°C.
Influence of salinity variations: experimental conditions under which starfish were reared for 15 days.
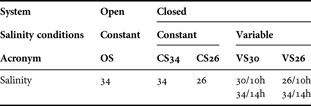
OS, open system; CS34 and CS26 systems with constant salinity of 34 and 26 respectively; VS30 and VS26 systems with varying salinity of 30–34 and 26–34 respectively.
At the beginning of the experiment, the mean ray length of each starfish was measured (mean of the 5 rays measured in mm) and the starfish were weighed (emersed wet weight). In each system, 20 starfish of similar ranges of size and weight were placed in a 30 l aquarium, where each starfish was individualized in a small separated tank (0.5 l) with drilled holes to ensure water circulation. They were each provided with 10 mussels. At every seawater change, the eaten mussels were counted and replaced by mussels of the same size. At the end of the experiment, the mean ray length and the weight of each starfish were measured. Their righting time was measured at the last salinity they were submitted to (i.e. 34 except for CS26 for which it was 26).
INFLUENCE OF SEAWATER TEMPERATURE ON JUVENILE GROWTH
To test the influence of seawater on juvenile starfish growth, juveniles (collected in October 2003 at Knokke, 25.2 ± 4.1 mm ray, mean ± standard deviation) were reared during 5 months (October 2003 to March 2004) at 3 temperatures, 8–9°C, 13°C and 16–17°C, in 3 closed systems (1500 l, continuous recycled water flow). In each system 60 starfish were placed in three 30 l aerated aquaria (20 starfish per aquarium). They were fed ad libitum with mussels. The salinity of each system was kept at 32. Water was filtered by a gravel and activated charcoal filtering unit. Salinity, pH and NO3− concentration levels were controlled and adjusted by renewing seawater with natural seawater or by adding tap water. Starfish size was measured monthly.
Statistical analysis
Available food in the different locations was compared using a two-way analysis of variance (ANOVA). Biomasses were log-transformed (X′ = log(X + 1)) to ensure homoscedasticity (Zar, Reference Zar1996). In field studies, growth of juveniles was modelled by linear regression of the cohort mean size against time (R2 went from 0.94 to 0.99 for 7 on the 8 tested regressions). As the individuals sampled on each temporal sampling period were different, slopes of the linear regression, i.e. growth rates of juveniles, were compared with analysis of covariance (Sokal & Rohlf, Reference Sokal and Rohlf1995).
In experimental studies, as no significant difference occurred in starfish size between the different conditions at the beginning of the experiment, differences in size or feeding rates at the end were tested using ANOVA. ‘Food’ and ‘emersion’ factors were tested using aquaria in an open system supplied by the same water so that the data can be considered as independent. For ‘salinity’ and ‘temperature’ where each condition (including several aquaria) used different closed systems, pseudoreplication can occur; differences in size or feeding rates were tested using a nested ANOVA with ‘experimental condition' and ‘aquaria nested within experimental condition' as factors. The nested factor allows to distinguish possible discrepancies between pseudo-replicates within each experimental condition (Zar, Reference Zar1996). Righting times were compared using non-parametric statistics (Kruskal–Wallis test) as the data did not fully fit the normality requirement.
RESULTS
Characterization of study sites
The study locations differed in terms of substratum, wave exposure, salinity conditions and emersion frequency for the starfish populations (Table 1). In Breskens, Scheldt estuary, the area is sheltered from wave action. The population was submitted to large daily and yearly salinity variations. Starfish were found under stones on mud, no mussel bed was present.
The Knokke population, first studied by Jangoux & Vloebergh (Reference Jangoux and Vloebergh1973), was situated in the Scheldt plume, where salinity variations were less pronounced than at Breskens. Starfish were found on a breakwater, covered by a mussel bed, on an exposed sandy beach. In these two locations, starfish were more often emerged than in Aber and Ambleteuse. In the latter, the populations were exposed to rather similar environmental conditions: they were living in a marine area on an exposed shore where an extended mussel bed that continues in the subtidal zone was present. However, in Aber, starfish were not found on the mussel bed but on a small accumulation of pebbles and small boulders at the rock–sediment limit. Only larger individuals were collected at the base of the mussel bed (few metres away). In both populations no starfish could be collected if the low tide water level was above 1 m.
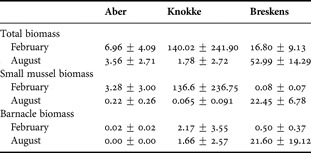
Food available to recruits in each location was highly variable at a small scale as evidenced by very high standard deviations assorted with most values (Table 3). Total biomasses of available food did not differ significantly among locations (ANOVA P = 0.074) and seasons (ANOVA P = 0.645). Biomasses of small mussels showed a slightly significant interaction term (ANOVA P = 0.021) but the Tukey multiple mean comparison test failed to detect significant pairwise comparison. The largest pairwise differences were noticed for the August sampling, small mussel biomasses being much higher at Breskens than at Aber and Knokke. Barnacle biomasses did significantly differ from location to location (ANOVA P = 0.022); the interaction term was marginally significant (ANOVA P = 0.049): the barnacle biomass at Breskens in August was significantly higher than that at Aber in both seasons.
Population dynamics
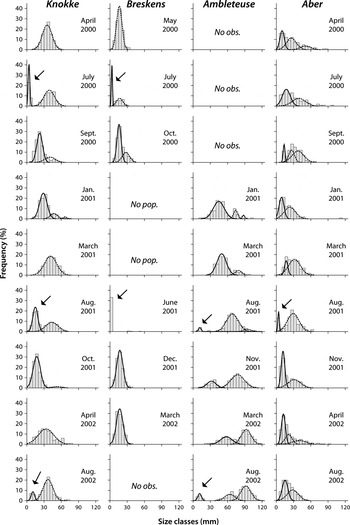
Size–frequency distributions and growth of juveniles strongly differed between the Aber population and the 3 northern populations (Figures 2 & 3). The 3 northern populations showed a well-defined annual recruitment which was first observed between June and August of each year. Recruitment intensity showed annual variations within each population (Table 4). In general, recruits were always found together with adults except in Knokke, where they first appeared on the lower boulders of the breakwater and then, within one or two months, migrated to the area with adults.
Size–frequency distributions of starfish from the 4 populations from April 2000 to August 2002. Size is indicated as ray length (mm). Recruitment events are indicated with arrows. Fitted Gaussian curves were obtained by modal analysis using Mix 3.0. No obs, no observation; No pop, no population present in the field.

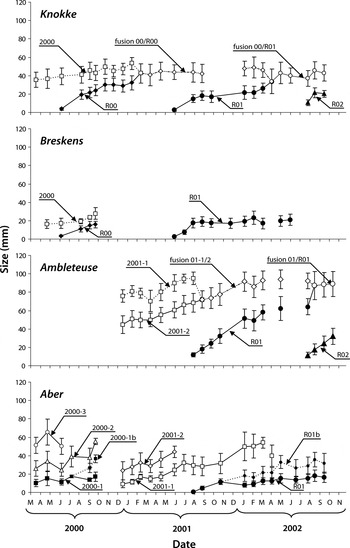
Temporal changes in the mean size (ray length in mm) of the different cohorts of starfish from April 2000 to November 2002 from fitted normal modes estimated by MIX3.0 (mean ± standard deviation). Cohorts are named either from the date of their first observation (e.g. Aber 2000–1 is the cohort of the smallest starfish collected in 2000) or from the year of observed recruitment (e.g. Knokke R00 is the cohort of starfish which recruited in 2000). When one cohort splits into 2 distinct normal modes, the second mode is named b (e.g. Aber 2000–1b is issued from 2000–1). If 2 cohorts merged into one normal mode, this normal mode is called ‘fusion' (e.g. in Knokke, fusion00/R00 is the result of the fusion of the cohorts 2000 and R00).

Food availability in the recruitment area.

Biomasses in g. m−2 DW (mean ± SD, N = 3). Total biomass was calculated without large bivalves (mussels—Mytilus edulis >15 mm in shell length; oysters—Ostrea gigas), slipper limpet (Crepidula fornicata) and starfish biomasses.
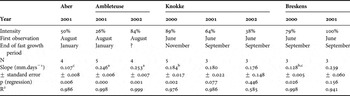
Characteristics of the recruitment and parameters of the fast growth period (modelled by linear regression of the mean size of the juvenile mode against time).

Intensity, proportion of juveniles in the population; N, number of points in the slope. Slopes sharing the same superscript are not significantly different (analysis of covariance comparison with α = 0.05), non-significant regressions were not ranked.
During the first 3–5 months after recruitment the growth rate was high (Figure 3). It differed in duration among populations and between years (Table 4). Generally, growth of juveniles in Ambleteuse was significantly higher than at Knokke and Breskens. This fast growth period was followed by a slow growth period, which varied in length and rate of growth between populations and years (Figure 3). In Breskens, after August 2001 no growth was observed. In Knokke, the growth stopped at the beginning of autumn (October 2000 and September 2001) and appeared to resume in January. A few months after growth resumed, cohorts of juveniles and of older starfish merged to form a single mode (Figure 2). The growth rate was not estimated during this second growth period due to its short duration (2–3 months, both years). In Ambleteuse, no cessation of growth was observed, rather growth continued at a low rate until the following summer (N = 5, P = 0.040, slope = 0.075 ± 0.021, R2 = 0.802). Juvenile and older starfish cohorts merged into a single mode about one year after recruitment (Figure 3). The larger starfish present in the field were most of the time represented by only one mode (Figure 2) even in Ambleteuse where this group could account for 70% of the population. The attempts made to decompose this group in more than one mode never succeeded in a logical pattern that could be followed during several months. The growth rates of the largest starfish were low and their average mean size was characteristic of each population: 85 ± 8 mm in Ambleteuse, 42 ± 5 mm in Knokke and 27 ± 6 mm in Breskens (Figure 3). During autumn 2000, the Breskens population declined and only a few individuals could be found before recruitment happened in June 2001.
In Aber, the population dynamics appeared different from those of the other studied populations. Small starfish, between 10 and 20 mm in ray length, were always present on the shore. The population structure was less stable through time (the small starfish mode split in late summer 2000 and the population structure changed during autumn 2000). A single recruitment was obvious (August 2001). It was composed of recruits, all measuring 0.4 mm in ray length that occurred under boulders. During winter 2001–2002, this juvenile mode split into 2 distinct modes: one of small starfish (R01 on Figure 3) that kept the same mean size throughout 2002 and one of starfish (R01b) that continued to grow. The growth rate of the 2001 recruits was assessed before the mode split into 2 (Table 4). It was not statistically different from that of 2000 recruits in Breskens, but was lower than that of Knokke recruits (2000) and Ambleteuse recruits (2001 and 2002). In Aber, the larger starfish modes (2000-2, 2000–3 and 2001–1) disappeared from the intertidal location after they reached a size greater than 50 mm ray (i.e. 56 ± 9, 56 ± 3 and 52 ± 2 respectively).
Laboratory experiments
INFLUENCE OF FOOD SUPPLY ON JUVENILE GROWTH
In half satiety fed starfish, high mortality levels were recorded starting in the second month; at the end of the experiment 54% of the starfish had died while 20% of starfish fed with ‘Aber food’ and 4% of ad libitum fed starfish had died. In the half satiety treatment, a few casualties were due to cannibalism.
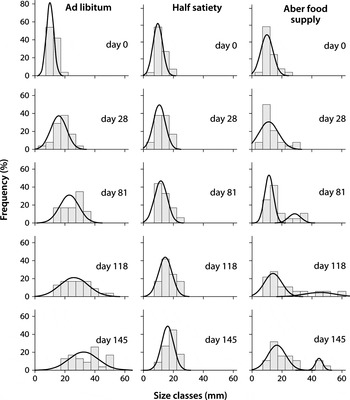
Starfish fed ad libitum consumed ½ mussel starfish−1 day−1 all through the experiment; ‘half satiety' diet was therefore set at ¼ mussel starfish−1 day−1. Starfish fed ad libitum showed a higher growth rate (Figure 4) ( ANOVA P < 10−4). Starfish provided with ‘Aber food supply’ (rock scraping from the collection site) split into 2 groups, which were tentatively demarcated by modal analysis: a small proportion (about 25%) showed a fast growth and a large one grew slowly. The growth rate of the former was not significantly different from that of starfish fed ad libitum with mussels. The growth rate of the latter was similar to that of starfish fed at ‘half satiety'.
Temporal changes in size–frequency distributions of starfish reared in different conditions of food supply: juveniles fed ad libitum with mussels, juveniles fed with mussels at a level corresponding to ‘half satiety' and juveniles fed with natural food supply from Aber.

INFLUENCE OF EMERSION ON JUVENILE GROWTH
During the 5th and 6th week of the experiment, 1 starfish died in emersion condition and 3 starfish presenting body wall necrosis were removed from the immersion condition. No further mortality took place.
No difference in size was observed between starfish submitted to emersion and individual always immersed at the end of the experiment (mean size was 33 ± 7 mm under tidal emersion and 36 ± 7 mm under continuous immersion conditions; ANOVA P= 0.070). Growth rates were 0.115 ± 0.010 mm.day−1 for starfish submitted to tidal emersion (N = 6, P < 10−3, R2 = 0.97) and 0.135 ± 0.012 mm.day−1 in immersion condition (N = 6, P < 10−3, R2 = 0.97). Feeding rate was greater in the immersion treatment (feeding rate was 1.79 ± 0.89 mussel starfish−1 day−1 under tidal emersion and 2.51 ± 0.80 mussel starfish−1 day−1 under continuous immersion conditions, ANOVA P < 10−3). Mean righting time was 167 ± 160 seconds for starfish submitted to emersion (N = 59) and 166 ± 158 seconds for starfish continuously immersed (N = 57). Emersion had no influence on the righting time (Kruskal–Wallis P = 0.57).
INFLUENCE OF SALINITY VARIATIONS ON JUVENILE GROWTH
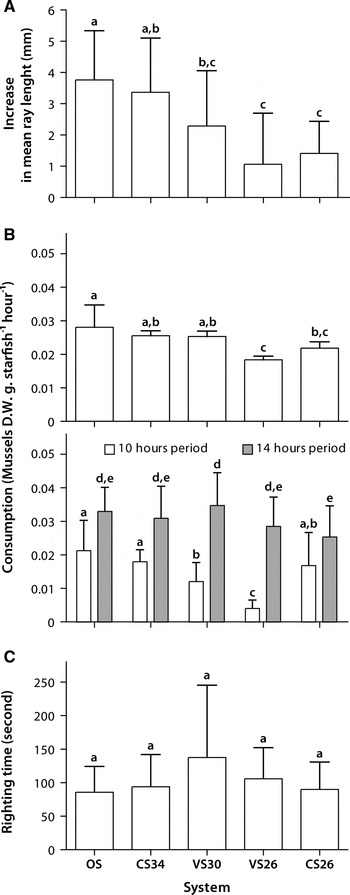
No mortality was recorded during this experiment. As the experiment duration was too short (15 days), the individual deltas of size (= mean size of the 5 arms at the end minus mean size of the 5 arms at the beginning) were compared (Figure 5). The highest increase in size (3.8 and 3.5 mm corresponding to 0.25 and 0.23 mm.day−1) took place for treatment with a constant salinity of 34 (OS and CS34) and the lowest (1.5 and 1.1 mm corresponding to 0.1 and 0.07 mm.day−1) for starfish exposed permanently or intermittently to a salinity of 26 (CS26 and VS26) (see Tukey test in Figure 5). Feeding rates calculated over 24 hours were lower for starfish exposed permanently or intermittently to a salinity of 26 (CS26 and VS26). Those calculated over 14 hours did not differ except that they were lower for starfish permanently kept at a salinity of 26 (CS26) compared to those exposed intermittently to a salinity of 30 (VS30). Those calculated over 10 hours were lower for starfish exposed intermittently at a salinity of 26 (VS26) and higher for starfish exposed to a constant salinity level (OS, CS34 and CS26) (see Tukey test in Figure 5). Pseudoreplication can occur in this experiment. But as there were no significant differences between the open system and the closed system with constant exposure to a salinity of 34 in terms of growth or feeding rates, and as the results between constant and variable salinities are coherent, no random bias did occur. Salinity had no influence on the righting time (N = 100, Kruskal–Wallis P = 0.38).
(A) Increase in mean ray length (mm) of starfish reared in different salinity conditions; (B) total consumption of mussels (g. mussel in dry wet. starfish−1.hour−1); the upper graph gives the consumption over 24 hours, the lower one separated the 10 first hours from the next 14 hours (during these two periods, the salinity did not vary for OS, CS34 and CS26 with values of 34, 34 and 26 respectively, it increased from 30 in the 1st period to 34 in the 2nd period for VS30 and from 26 to 34 for VS26°); (C) righting time in seconds. All values are means + standard deviations (N = 20). Histogram bars sharing the same superscript are not significantly different (Tukey test, α = 0.05). For abbreviations see Table 2.

INFLUENCE OF SEAWATER TEMPERATURE ON JUVENILE GROWTH
No difference in size was observed at the end of the experiment between starfish reared at the 3 temperatures (mean sizes were 41 mm ± 7 at 8–9°C, 44 mm ± 6 at 13°C and 42 mm ± 6 at 16–17°C; ANOVA P = 0.26, N = 9). Growth rates were 0.148 ± 0.018 mm.day−1 at 8–9°C (N = 5, P regression = 0.004, R2 = 0.96), 0.168 ± 0.018 mm.day−1 at 13°C (N = 5, P regression = 0.001, R2 = 0.97) and 0.151 ± 0.018 mm.day−1 at 16–17°C (N = 5, P regression = 0.004, R2 = 0.96). Absence of significant differences between aquaria indicates that very probably no bias linked to pseudoreplication did occur.
DISCUSSION
Such a study does not pretend to describe the Asterias rubens growth throughout its life cycle. The used method of modal analysis occasionally succeeded in decomposing size–frequency distributions into more than 2 modes. In most cases, the juvenile mode fused over time with an older mode, concomitantly with a decrease in the latter. Different cohorts cannot be distinguished in the second mode. If previous studies had attributed several cohorts to this adult mode (Nauen, Reference Nauen1978; Nichols & Barker, Reference Nichols and Barker1984; Guillou & Guillaumin, Reference Guillou, Guillaumin, Keegan and O'Connor1985) this can be explained more by the method used (Bhattacharya's method for example which tends to generate supernumerary modes: see Macdonald & Pitcher, Reference Macdonald and Pitcher1979; Grant et al., Reference Grant, Morgan and Olive1987) than by a biological basis. Asterias rubens individual growth rate is highly variable (see references in Introduction), and the results of the ‘food supply experiment' carried out in this study are a new evidence (Figure 4). This assertion is true for numerous echinoderms and was particularly well demonstrated in experimental conditions for sea urchins (Grosjean et al., Reference Grosjean, Spirlet and Jangoux1996). Consequently this study was focused on the growth pattern during the first year after recruitment. However, it is noteworthy that the maximal modal size reached by the adult mode differed between populations. It appeared to be stable through time in each population and therefore we considered it as characteristic of the population, as previously discussed by Guillou & Guillaumin (Reference Guillou, Guillaumin, Keegan and O'Connor1985).
Observations made on the 3 northern populations were consistent with the previously described life cycle of A. rubens in the North Atlantic. Spawning took place in April–May (Joly et al., Reference Joly, Guillou, Dubois, Féral and David2003) and recruitment occurred between June and August. In the Aber population, only one recruitment event could be clearly observed. It took place in August 2001. The delay of recruitment compared to the northern populations has to be related to the delay in spawning, which happens later in Aber (Joly et al., Reference Joly, Guillou, Dubois, Féral and David2003). Recruitment was followed first by a period of fast growth and second by a period of slow growth, or even cessation of growth. The duration of these periods varied between populations. If factors controlling starfish growth were previously suggested (Table 5), they were not concomitantly tested. The experimental approaches used in this study simulated different real ambient field conditions in order to better understand the variations in A. rubens growth in the different contrasted environments analysed in this study. Even if several factors do interact in field conditions, this analysis allowed us to distinguish different scenarios.
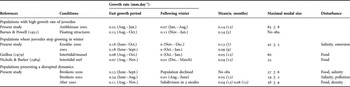
Growth of the juvenile cohort of Asterias rubens during the first year after recruitment and maximal modal size in different A. rubens intertidal populations.

Growth rates: increase of the ray (mm.day−1). Mean: daily growth rate over the observed period (in italics: the number of months).
When necessary, size data from previous authors were transformed to be comparable. No obs., no observation.
In Ambleteuse, juveniles showed the highest monthly growth rates ever reported for A. rubens and maximal modal size was elevated. In this location, environmental conditions (abundant food supply, marine salinities and low emersion frequency) allowed optimum growth.
In Knokke, growth just after recruitment was elevated but slower than at Ambleteuse. Growth stopped during winter months (Table 5) as previously observed in other intertidal populations (Guillou, Reference Guillou and Jangoux1980; Nichols & Barker, Reference Nichols and Barker1984) and maximal modal size was small. All this was likely due to less favourable conditions which were enhanced during winter months: high emersion frequency and related stress (desiccation, rainfall, etc) and salinity variations which can significantly reduce juvenile growth (see below). Migrations of starfish to a subtidal refuge appeared unlikely because of the lack of hard substrata in the vicinity of the breakwater. In our experiment, influence of salinity on juvenile growth was evident.
Constant or intermittent exposure to a lower salinity resulted in a decreased growth linked to a reduced food intake as compared to starfish constantly kept at a salinity of 34. This was also elicited, even if less pronounced, by intermittent exposure to a salinity of 30 as may happen in Knokke. On the other hand, emersion influence on juvenile growth was not obvious. Under emersion–immersion conditions, the feeding rate decreased; the starfish were not observed feeding during emersion periods, but the immersion periods were long enough to allow the growth rate to be equivalent to that of starfish reared under permanent immersion condition. However, our experimental design did not mimic the stresses to which starfish can be submitted when emerged in the field (high temperature, dessication or rainfall). Our data only allowed us to conclude that emersion alone, and its effect on foraging time, has no direct effect on juvenile growth when external temperature is low (i.e. 4°C) and close to seawater temperature (i.e. 6°C).
In Breskens juveniles showed a very short period of fast growth followed by a protracted period of very slow growth (2001) or population decline (2000) due to a severe food shortage (lack of mussel recruitment). Growth did not resume in spring and the starfish never reached the size of sexual maturity (35 mm; Joly et al., Reference Joly, Guillou, Dubois, Féral and David2003). Estuarine conditions with important salinity variations limited growth (as evidenced in the laboratory experiment). Moreover, dwarfism has already been reported for populations of A. rubens living in brackish water (Kowalski, Reference Kowalski1955).
In Aber, during their first winter, the majority of juveniles ceased to grow and remained below the size of sexual maturity for a protracted period, even if some juveniles went on growing. Nauen (Reference Nauen1978) has already observed such a permanent stock of small starfish said to be in ‘waiting stage' (i.e. ‘waiting for a free seat in the ecological niche'). Mortality or migration of the largest starfish allowed a few individuals to grow, which in return, monopolized the food supply and limited the growth of the remaining juveniles (waiting individuals). This ‘waiting stage' was also evidenced whilst testing the influence of food supply on juvenile growth. Indeed, most juveniles provided with ‘Aber food supply' showed a low growth rate while only a few of them were able to grow rapidly. Growth rate of the former was similar to that of juveniles fed at ‘half satiety'. Both were lower than that of individuals fed ad libitum with mussel indicating that they were food limited. In Aber, wave movements confined starfish in the boulder area where they are submitted to a considerable stress due to inadequate food supply. Disappearance of large individuals was likely due to migration to the subtidal zone as discussed by Guillou (Reference Guillou and Jangoux1980) and observed in the Menai Strait (UK) by Gallagher et al. (Reference Gallagher, Richardson, Seed and Jones2008).
This study confirmed the dominating role of the food availability in controlling Asterias rubens growth as previously suggested for many echinoderms (for a review see Lawrence & Lane, Reference Lawrence, Lane, Jangoux and Lawrence1982). The effect of the emersion has also been anticipated for this species which showed a faster growth in subtidal environments compared to intertidal populations (Guillou, Reference Guillou and Jangoux1980; Nichols & Barker, Reference Nichols and Barker1984), but it was never experimentally demonstrated. This study showed that emersion reduced growth by a reduction of food intake. The effect of temperature was unexpected in this study compared with previous controlled experiments showing decrease in starfish feeding when the temperature falls (for a review, see Sloan, Reference Sloan1980), or compared with the present field observations (in particular the winter growth rate decrease). No difference in growth rate was observed during the experiment. If the growth rate at 16–17°C (0.15 mm day−1) was lower than the maximal growth rate observed in Ambleteuse (0.25 mm day−1; Table 5), the growth rate at 8.5°C (0.15 mm day−1) was clearly higher than the winter growth rate observed in the field (close to zero). The experimental conditions do not reproduce exactly those of the natural environment. Even in optimal temperature conditions (16–17°C), the experimental set up can inhibit feeding activity (Sloan, Reference Sloan1980). On the other hand, in the natural winter environment with temperature close to 8°C, factors other than the temperature can act on the growth process such as either decreases in food availability, motility of the starfish and/or salinity or an increase of water motion. In our experiment, the starfish were fed ad libitum in a very restricted area resulting in an easier access to the mussel and thus a higher consumption rate than in the field. On the other hand the reduction of the metabolic cost under colder conditions balances a possible smaller consumption as demonstrated for Pisaster ochraceus (Brandt, 1835) by Sanford (Reference Sanford2002) and verified by Le Gal (Reference Le Gal2003) for Asterias rubens. In the tanks where the starfish do not fight for their survival, this bioenergetic cost is even more reduced. This process could explain why individuals maintained at different temperatures reached the same final size.
ACKNOWLEDGEMENTS
Ph. Dubois is a Senior Research Associate of the National Fund for Scientific Research (NFSR, Belgium). The research was supported by the Belgian federal research programme (SSTC, contracts MN/11/30 and EV/11/23A), a CGRI–FNRS–CNRS cooperation agreement and by the French Research Ministry grant for a PhD in co-supervision. Experiments conducted during this study comply with the current laws of France and Belgium.