Davida Teller used to say that the field of visual development can be much more than simply showing that babies do not see well and then get better as they age. Developmental research, when done rigorously, can reveal much about the neural mechanisms underlying visual perception, and Davida was a master at articulating the rules for these “linking propositions” (Teller, Reference Teller1982, Reference Teller1984). For example, Davida and others have pointed out that if different aspects of visual processing show different developmental trajectories, it is reasonable to conclude that those aspects of visual processing are subserved by different neural mechanisms. The converse, however, is not necessarily true; if different aspects of visual processing show similar developmental trajectories, those aspects of visual processing may or may not be subserved by different neural mechanisms. In a tribute to Davida and her contributions to the field of linking propositions, we present data from a study we conducted that investigated the developmental trajectories of face and nonface object processing between childhood and adulthood. Despite the fact that there are several studies showing developmental changes in face processing over the course of a lifetime (see Germine et al., Reference Germine, Duchaine and Nakayama2011, for review), we felt that some basic questions about face discrimination using carefully controlled stimuli were in need.
As a brief background to the topic of face development, the ability to process faces occurs very soon after birth, with newborns displaying looking preferences for faces over objects and mother’s over stranger’s face (reviewed in McKone et al., Reference McKone, Crookes, Kanwisher and Gazzaniga2009; Pascalis et al., Reference Pascalis, de Vivies, Anzures, Quinn, Slater, Tanaka and Lee2011). By preschool (∼age 3–4 years), children appear to engage the same processing mechanisms as adults and encode faces relative to a norm (Jeffery et al., Reference Jeffery, McKone, Haynes, Firth, Pellicano and Rhodes2010; Short et al., Reference Short, Hatry and Mondloch2011) in a framework that represents faces as points in a multi-dimensional psychological face space (Tanaka et al., Reference Tanaka, Meixner and Kantner2011). Despite this adult-like encoding at a relatively early age, many age-related improvements in face processing have been documented, including improvements in: (1) face recognition accuracy (age 6–10 years and 12–16 years: Diamond & Carey, Reference Diamond and Carey1977; age 7–14 years: Carey et al., Reference Carey, Diamond and Woods1980; age 7–16 and 18–35 years: Golarai et al., Reference Golarai, Ghahremani, Whitfield-Gabrieli, Reiss, Eberhardt, Gabrieli and Grill-Spector2007), (2) configural processing ability (i.e., facial feature distances) (age 3–4 years and adults: Macchi Cassia et al., Reference Macchi Cassia, Turati and Schwarzer2011; age 4–5 years: McKone & Boyer, Reference McKone and Boyer2006; age 4–5 years: Pellicano et al., Reference Pellicano, Rhodes and Peters2006; age 6–10 years: Mondloch et al., Reference Mondloch, Le Grand and Maurer2002; age 8 years: Mondloch et al., Reference Mondloch, Maurer and Ahola2006), (3) the complexity of holistic face percepts (i.e., integration of the facial features with their spatial arrangement and the external contour of the face, and more specifically, the amount of detail represented in this integrated face percept) (age 3–5 years: Macchi Cassia et al., Reference Macchi Cassia, Picozzi, Kuefner, Bricolo and Turati2009; age 3–5: Pellicano et al., Reference Pellicano, Rhodes and Peters2006; age 6: Mondloch et al., Reference Mondloch, Pathman, Maurer, Le Grand and de Schonen2007), and (4) selectivity for upright faces, as measured by the size of face inversion effects (age 2–6 years: Brace et al., Reference Brace, Hole, Kemp, Pike, Van Duuren and Norgate2001; age 3–5 years: Picozzi et al., Reference Picozzi, Cassia, Turati and Vescovo2009; age 3–5: Sangrigoli & de Schonen, Reference Sangrigoli and de Schonen2004; age 4–6 years: Pellicano & Rhodes, Reference Pellicano and Rhodes2003; age 6–8 years: Carey & Diamond, Reference Carey and Diamond1977; age 6–12 years: de Heering et al., Reference de Heering, Rossion and Maurer2012; but see Mondloch et al., Reference Mondloch, Maurer and Ahola2006). Results from neuroimaging studies corroborate these perceptual findings, showing that the neural regions mediating face recognition (i.e., the fusiform face area) continue to develop into adolescence (age 7–11, 12–16, and 18–35 years: Golarai et al., Reference Golarai, Ghahremani, Whitfield-Gabrieli, Reiss, Eberhardt, Gabrieli and Grill-Spector2007; age 7–17 and 20–32 years: Peelen et al., Reference Peelen, Glaser, Vuilleumier and Eliez2009; age 12–16 and 18–40 years: Golarai et al., Reference Golarai, Liberman, Yoon and Grill-Spector2010).
These age-related changes in face processing are in stark contrast to the development of object processing. Unlike faces, object recognition does not improve much across children (7–11 years), adolescents (12–16 years), and adults (18–35 years) (Carey et al., Reference Carey, Diamond and Woods1980; Golarai et al., Reference Golarai, Ghahremani, Whitfield-Gabrieli, Reiss, Eberhardt, Gabrieli and Grill-Spector2007). Similarly, the neural regions traditionally responsive to objects (e.g., lateral occipital complex) show little change from childhood to adulthood (age 5–8, 11–14, 20–23 years: Scherf et al., Reference Scherf, Behrmann, Humphreys and Luna2007; age 7–11, 12–16, and 18–35 years: Golarai et al., Reference Golarai, Ghahremani, Whitfield-Gabrieli, Reiss, Eberhardt, Gabrieli and Grill-Spector2007). In sum, research suggests that face processing development continues into adulthood, whereas object processing matures early in life.
Unfortunately, many of the above-mentioned studies contain methodological limitations that prevent a direct comparison of face and object processing development, thereby obscuring inferences made about the underlying neural mechanisms. The first issue concerns use of a proper control stimulus. Most studies investigating development of face processing do not include nonface controls, making it difficult to determine the extent to which age-related improvements are specific to faces. One notable exception to this are studies that compare processing of upright faces to inverted faces (e.g., de Heering et al., Reference de Heering, Rossion and Maurer2012), with the obvious advantage that upright and inverted faces (which are one type of control stimulus) are perfectly matched in low-level visual characteristics such as luminance, color, and contrast (discussed further in the section below). There is, however, a drawback to using inverted faces as the nonface control, which is that the extent to which upright and inverted faces are thought to engage separate mechanisms is uncertain; while some research in adults suggests that inverted faces are processed by separate nonface mechanisms such as the lateral occipital complex (e.g., Freire et al., Reference Freire, Lee and Symons2000; Goffaux & Rossion, Reference Goffaux and Rossion2007; reviewed in Rossion, Reference Rossion2008), other research in adults suggests that inverted faces are, in fact, processed by face-specific neural mechanisms (e.g., fusiform face area), albeit less efficiently than upright faces (e.g., Kanwisher et al., Reference Kanwisher, Tong and Nakayama1998; Sekuler et al., Reference Sekuler, Gaspar, Gold and Bennett2004; Richler et al., Reference Richler, Mack, Palmeri and Gauthier2011; reviewed in Valentine, Reference Valentine1988). Other studies sometimes use “scrambled faces” as the nonface control (e.g., Taylor et al., Reference Taylor, McCarthy, Saliba and Degiovanni1999; Passarotti et al., Reference Passarotti, Paul, Bussier, Buxton, Wong and Stiles2003), which, like inverted faces, have the advantage of controlling for low-level visual characteristics. However, here we would argue that because scrambled faces do not elicit a psychological “construct,” they are not the optimal control stimulus. As such, it is probably best to employ other objects, such as cars, toys or animals (e.g., Macchi Cassia et al., Reference Macchi Cassia, Picozzi, Kuefner, Bricolo and Turati2009, Reference Macchi Cassia, Turati and Schwarzer2011; Crookes & McKone, Reference Crookes and McKone2009) as nonface control stimuli.
Still, even when a single study employs both face and nonface control stimuli, there are other issues to consider carefully. As mentioned above, the face and nonface objects need to be equated for low-level visual characteristics (color, luminance, contrast, and spatial frequency), otherwise age-related differences between faces and objects could result from age-related changes in sensitivity to different aspects of low-level visual processing. For example, imagine that the face stimuli employed are composed of much lower spatial frequencies than the object stimuli employed. If we find a steeper developmental trajectory for faces than objects, this could be driven by either (1) accelerated development of a face processing mechanism and/or (2) accelerated development of mechanisms tuned for low spatial frequencies. To our knowledge, the field of face development tends not to consider this possibility. Another thing to consider is the “apples and oranges” problem, that is, making direct comparisons between face and object performance is problematic even if/when the two stimulus types are equated in their low-level visual characteristics. On a conceptual level, one can imagine differences in face versus object performance based on differences in experience with those stimuli, making the comparison difficult to interpret (Gauthier et al., Reference Gauthier, Behrmann and Tarr1999; Gauthier et al., Reference Gauthier, Behrmann and Tarr2004). On a practical level, the particular face and object stimuli chosen for a given study are likely to be inherently different in how difficult they are to discriminate/process in the task being tested. For example, imagine that the task is to discriminate featural changes in faces (e.g., eye color/shape) versus objects (e.g., the tires of a car). Performance on the tasks will depend on how different the face features are versus how different the car features are, making a comparison between the two impossibleFootnote 1. Another example, relevant to the current study, concerns discrimination thresholds obtained from morphed stimuli (e.g., Tanaka & Corneille, Reference Tanaka and Corneille2007; Pitcher et al., Reference Pitcher, Charles, Devlin, Walsh and Duchaine2009), which we return to further below. Despite the fact that the “apples versus oranges” problem disallows a direct comparison between face and object performance at any given age, a comparison between developmental trajectories for faces and objects is meaningful, since the “apples versus oranges” problem is present at all age levels and thus factors out. Consequently, the resulting relative measurements reflect age-based differences in face and object processing mechanisms that are independent of the inherent stimulus differences.
The second issue concerning the previous literature on the development of face processing is that most studies obtain percent correct data. This has two potential problems. One, children may end up at floor performance if the task is too difficult, and, analogously, adults may end up at ceiling, making it difficult to discern age-related changes (see Crookes & McKone, Reference Crookes and McKone2009; McKone et al., Reference McKone, Crookes, Kanwisher and Gazzaniga2009, Reference McKone, Crookes, Jeffery and Dilks2012 for discussion). Two, if the task is too difficult for children, they may become discouraged and disengage from the task, leading to an underestimation of their true performance ability. One study that controlled for difficulty (and included nonface stimuli) asked 5- to 10-year-olds and adults to perform a 2-AFC recognition task with faces and dogs (the entire body of a Labrador). Critically, differences in difficulty were controlled for by matching the face and dog performance in children to create an equal baseline for comparison with older age groups. When this was done, it was found that face recognition and dog recognition improve equally with age (Crookes & McKone, Reference Crookes and McKone2009). One drawback to this study, however, is that the two stimulus types (faces and dogs) were not equated in their low-level characteristics (color, luminance, contrast, and spatial frequency). Such low-level differences between the two conditions could have added unwanted variation in performance, which, in turn, could have masked differences in age-related improvement between the two conditions.
In the current study, we attempted to address the limitations of previous studies by comparing the development of face versus object (cars) processing over the time course of childhood, adolescence, and adulthood, using the same discrimination task for faces and objects, and equating the two stimulus sets in their low-level visual characteristics (i.e., color, luminance, contrast, and spatial frequency). The discrimination task used morphed faces (morphed between Face 1 and Face 2) and morphed objects (morphed between Object 1 and Object 2). Participants reported whether a given morph was more similar to Face 1 versus Face 2 (or Object 1 vs. Object 2). Because we obtained discrimination thresholds using a staircase design (homing in on 80% correct performance), the task was necessarily equated for difficulty across the different ages tested. In addition to obtaining face and object discrimination thresholds, we measured contrast sensitivity to luminance (light/dark) and chromatic (red/green) gratings, also using a staircase design. This provided us with a very basic measure of age-related changes in visual performance, since contrast sensitivity is known to develop into adolescence (Beazley et al., Reference Beazley, Illingworth, Jahn and Greer1980; Knoblauch et al., Reference Knoblauch, Vital-Durand and Barbur2001; Benedek et al., Reference Benedek, Benedek, Keri and Janaky2003). More specifically, we used the contrast sensitivity data to ask whether age-related changes in face (or object) processing might be secondary to age-related changes in luminance (light/dark) and chromatic (red/green) gratings, thought to be mediated predominantly by the magnocellular (M) and parvocellular (P) subcortical visual pathways, respectively. That is, we asked whether age-related changes in face (or object) processing may be linked to the development of one of the two subcortical pathways.
Methods
Participants
This study tested three different age groups: adults, adolescents, and young children. Twenty-four adult participants (mean age = 21.1 years, s.d. = 2.30) were recruited from the University of California, San Diego undergraduate subject pool and received course credit for participation. Twenty-four adolescents (mean age = 15.8 years, s.d. = 1.02) were recruited from the San Diego Unified School District and 23 young children (mean age = 5.24 years, s.d. = 0.58) were recruited from a database of young children who had previously participated in experiments in our laboratory. Young children received a toy in exchange for participation, and adolescents received $5. Parents received $5 for bringing their child/adolescent in for the study. Young children also received goldfish crackers or a sticker throughout the experiments as rewards. Table 1 displays the demographics for each age group.
Demographic data for participants

Note:
In the adult group, two participants were both Asian and Caucasian, which were counted as other.
Stimuli
Luminance and chromatic contrast sensitivity
Stimuli were the same as those described in Dobkins et al. (Reference Dobkins, Bosworth and McCleery2009). Briefly, luminance (light/dark) and chromatic (red/green) stimuli were presented on a 51 cm Iiyama Vision Master Pro 510 monitor (1024 × 768 pixels, 100 Hz) powered by a Dell Dimension computer with a 14-bit VSG2/3F graphics card. Stimuli were horizontally oriented sinusoidal gratings (moving upward or downward) with a spatial frequency of 0.27 cycles/degree and a temporal frequency of 4.2 Hz. The stimuli subtended 11 × 11 degrees. The contrast of the stimuli varied across trials (see below), with contrast described in terms of cone contrast, that is, the amount of response modulation produced in the long-wavelength-selective (L) and medium-wavelength-selective (M) cones in the eye (for methodological details, see Dobkins et al., Reference Dobkins, Anderson and Lia1999; Gunther & Dobkins, Reference Gunther and Dobkins2002). The mean luminance of the gratings (17.5 cd/m2) and the mean CIE coordinates (x = 0.486, y = 0.442) were the same as the background of the monitor, so that when their contrast was low enough (below detection threshold), they blended into the background and were not perceivable.
Obtaining isoluminance points
Before beginning the contrast sensitivity task, red/green isoluminance was determined for each adult and adolescent (but not child) participant using standard motion photometry (Lindsey & Teller, Reference Lindsey and Teller1990; Dobkins & Teller, 1996b). A red/green grating (of the same spatiotemporal frequency and size as that used in the main experiment) appeared on one side of the monitor or the other, randomized across trials. Participants fixated on a small dot in the center of the moving red/green grating and varied the relative intensity of the red and green stripes with keyboard presses, until the percept of motion was least salient. Each participant’s isoluminance point was determined from the mean of 10 trials. Because the isoluminance task was too difficult for young children, we used the mean red/green isoluminance point from 17 UC San Diego college students for our child participants (e.g., Dobkins & Teller, 1996a; Crognale, Reference Crognale2002; Till et al., Reference Till, Westall, Koren, Nulman and Rovet2005; Boon et al., Reference Boon, Suttle, Henry and Dain2009; Bosworth & Dobkins, Reference Bosworth and Dobkins2009). Similarly, if performance for an adult or adolescent participant on the isoluminance task was too variable (i.e., the standard deviation of their 10 trials exceeded two standard deviations beyond the mean s.d. of the 17 college students), that participant was tested using the mean isoluminance point of the 17 college students.
Face and object discrimination
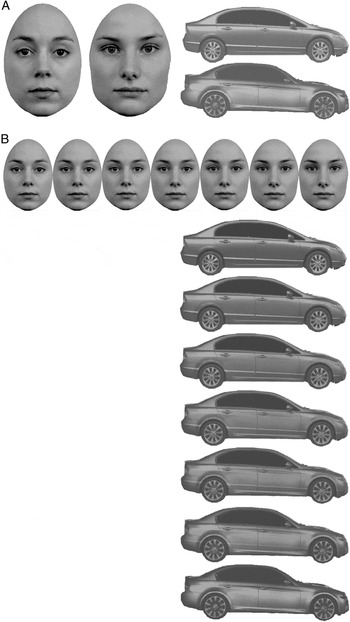
The stimuli consisted of grayscale images of faces and cars presented on a 51-cm high resolution RGB Sony CRT monitor (1280 × 1024 pixels, 75 Hz) using Matlab 7.3 and the Psychophysics Toolbox (Brainard, Reference Brainard1997; Pelli, Reference Pelli1997). The stimuli were created from two photographs of Caucasian females and two side profile photographs of cars, which we refer to as “template” stimuli (Fig. 1A). Faces were positioned within an oval frame that covered the top of the head only, which removed the hair while preserving the external contour below the ears. We chose cars as stimuli because like faces, cars are generally viewed in a single orientation (i.e., upright), and our exposure to cars from infancy onwards is extensive. Cars also make good control stimuli since they vary in both their features (e.g., type of wheels) and their configurations (e.g., aspect ratio). Like faces, it can also be necessary to identify a familiar car (i.e., your car) from a large “crowd” of cars (e.g., in a parking lot). There are very few other objects (biologically based or man-made) for which we have that experience. We chose side profiles for cars rather than frontal profiles, since the front of a car may be perceived as face-like (e.g., lights for eyes, etc.). Faces subtended 8.1 × 11.3 and cars subtended 19.8 × 6.7Footnote 2.
(A) Face templates (Face 1 and Face 2) and car templates (Car 1 and Car 2). (B) Examples of morphed test stimuli. 100 morphs were created between 100% Face1/0% Face 2 and 100% Face2/0% Face 1 (and likewise for cars). Seven morphed faces and seven morphed cars are shown here. Since we do not have permission to publish the faces from the experiment, as an example, we instead use faces from the Radboud Faces Database (Langner et al., Reference Langner, Dotsch, Bijlstra, Wigboldus, Hawk and van Knippenberg2010).

Template stimuli were normalized in Matlab to all have the same mean luminance (15.1 cd/m2) and root-mean-square contrast (48.9) and were not significantly different in spatial frequency content mean (slope in log-energy vs. log-SF space = −1.56, p > 0.05). Thus, any performance differences observed in the face versus car task are unlikely to reflect differences in low-level visual spatial characteristics. The template stimuli were then morphed to create a series of 100 “test” stimuli ranging from 100% Face 1/0% Face 2–0% Face 1/100% Face 2 (and likewise for cars; Fig. 1B). All images were placed on a rectangular white background (60.5 cd/m2 and the same size as the face/car) and were presented against a gray background (30.3 cd/m2).
Procedures
Participants were tested in a dimly lit room and viewed the display binocularly at a distance of 37.5 cm in the Contrast Sensitivity Task and 50.0 cm in the Face/Object Discrimination Task. In both experiments, the test stimulus varied across trials in a staircase design (see Staircase design, below).
Luminance and chromatic contrast sensitivity
Before beginning the experiment, young children were told that they would be playing a game where they had to find the “stripes monster” (i.e., the grating stimulus). The monster liked to sneak up on people, but if the child could find him first, then the monster would get scared and try to hide, making the monster harder to see (i.e., a decrease in contrast). Young children received 11 practice trials (10 trials of randomized contrasts and one easy, 100% contrast trial).
Each trial was initiated by pressing the space bar, after which a small fixation appeared at the center of the display for 200 ms. Then a grating (either luminance or chromatic) appeared on either the left or right side of the display (centered at 15°) and remained visible until the participant indicated its location (adolescents/adults: left or right arrow key; young children pointed with a “magic wand”). A beep accompanied a correct response, and no sound accompanied an incorrect response. For young children, the experimenter also provided verbal feedback. At the end of the experiment, young children additionally received goldfish crackers or a sticker for good participation. This task took about 10 min.
Face and object discrimination
Before beginning the experiment, young children were told that they would be playing a matching game and received a practice session using paper cards. Specifically, the experimenter presented the child with two cards containing the two “template” stimuli, e.g., displaying 100% Face 1 (“Sarah”) and 100% Face 2 (“Jessica”). The experimenter then showed the child a test card, which was identical to one of the two template cards, and asked the child to match the test card to one of the two template cards. This was repeated until the participant mastered the task, which was generally within 36 trials (18 trials for faces; 18 trials for cars). The child was rewarded with goldfish crackers or a sticker at the end of practice.
On each trial of the experiment, after pressing the space bar, three stimuli were presented simultaneously. Two “template” stimuli, Face 1 and Face 2 or Car 1 and Car 2, appeared in the upper left and right corners of the display, respectively (faces: centered 12.3° horizontally and 8.03° vertically from the middle of the monitor, cars: centered 9.53° horizontally and 8.63° vertically from the middle of the monitor). The test face (or car), which was a morph ranging from entirely Face 1 to entirely Face 2 (or Car 1 to Car 2), appeared simultaneously in the lower half of the display (centered 10° below the middle of the monitor). Stimuli remained visible until the participant selected the template stimulus most similar to the test stimulus (adolescents/adults: left or right arrow key; young children pointed with a “magic wand”). Young children viewed a happy animation when they were correct (e.g., Winnie the Pooh dancing), and a sad animation when they were incorrect (e.g., Eeyore crying). After every 10 correct trials, the child also earned goldfish crackers or a sticker, which were given to the participant at the end of the experiment. For adolescents and adults, after each trial, a beep accompanied a correct response, and no sound accompanied an incorrect response. This task took about 30 min.
Staircase design
Each experiment used staircases based on a modified PEST method (see Taylor & Creelman, Reference Taylor and Creelman1967). In the Contrast Sensitivity Task, two randomly interleaved staircases determined the 75% detection threshold for luminance and chromatic contrast, respectively, with a maximum step size of 0.99 log units (9.8-fold change in contrast). Thus, contrast was decreased by one step size after a correct response and was increased by three step sizes after an incorrect response. The first trial of each staircase displayed contrasts at roughly five-times the standard detection threshold (as determined from pilot studies) which were 1.93 and 2.30% cone contrast for the luminance and chromatic stimuli, respectively. In the Face/Object Discrimination Task, two randomly interleaved staircases determined the 80% “most similar to” thresholds for Face 1 and Face2, respectively, with a maximum step size of 20 morph units (and similarly for cars). (The contrast sensitivity task used a 1 down/3 up procedure rather than 1 down/4 up procedure because we collected contrast sensitivity data from some of our children as part of a larger project that already used the 1 down/3 up procedure. However, since the face/object portion of the experiment was completely new, we decided to use the more efficient 1 down/4 up design.) Thus, in the staircase isolating the threshold for Face 1, the test stimulus decreased in similarity to the template (e.g., Face 1) by one step size after a “Face 1” response and increased in similarity to the template by four step sizes following a “Face 2” response.
In both experiments, the value of the step size was determined by an acceleration factor of 1.2 and a reversal factor of power of 1.6. Following either two correct or two incorrect responses, the step size was multiplied by the acceleration factor. Following a reversal in correctness, the step size was multiplied by (1/acceleration factor)^reversal power. In addition, after every 10 trials, participants viewed an “easy trial” in which the stimulus was displayed at 100% contrast (Contrast Sensitivity Task) or was identical to one of the template stimuli (Face/Object Discrimination Task), which was included to keep participants interested in the task.
In the Contrast Sensitivity Task, participants viewed 50 trials per condition, resulting in 100 total test trials (and 10 additional easy trials). In the Face/Object Discrimination Task, stimuli were presented in four blocks of trials, two for faces and two for cars. Order was semirandomized such that each stimulus type was viewed once before repetition occurred. The condition viewed first was counterbalanced across participants. Adolescents and adults viewed 50 trials per block, for 200 total test trials (and 20 additional easy trials), while young children received 24 trials per block, resulting in 96 total test trials (and 9 additional easy trials). Young children received fewer trials due to their limited attention spans.
Data analyses
Thresholds were determined by fitting the proportion of correct responses (Contrast Sensitivity Task) and matches to a given template (Face/Object Discrimination Task) for each participant and each stimulus type to a logistic function. Specifically, psychometric functions were produced by using psignifit version 2.5.6 (see http://bootstrap-software.org/psignifit/), a software package that implements the maximum-likelihood method described by Wichmann and Hill (Reference Wichmann and Hill2001) and runs in Matlab. Face discrimination thresholds were calculated as the average of the 80% thresholds for Face 1 and Face 2 (and likewise for object discrimination thresholds).
Thresholds were logged to conform to normal distributions and then converted into sensitivity measures, which is the inverse of threshold (i.e., log sensitivity = −log threshold). Thus higher sensitivity values correspond with better performance. For each experiment, log sensitivity data were assessed in a 2-factor (stimulus type × age group) general linear model (GLM) in SPSS. In addition, face/object data were analyzed in a GLM with luminance and chromatic contrast sensitivity as covariates.
As discussed in the Introduction, it is important to point out that a comparison of face versus object discrimination cannot be made because of the “apples and oranges” problem. This is because thresholds for each (faces and objects) will depend on how similar/dissimilar the template stimuli are, i.e., Face 1 versus Face 2, and Object 1 versus Object 2. As is typically the case, these template stimuli are not chosen with this goal in mind, and thus the perceptual distance represented by a single morph unit is unlikely to be the same for the face and object morph sets. One could argue that pilot studies obtaining discrimination thresholds could be conducted for the sole purpose of equating the perceptual distance represented by a single morph unit. However, we see no reason to do this, as it would not inform us of anything particularly relevant to the current study. The goal of the current study was to investigate developmental trajectories for face versus object processing, and for this, a direct comparison between faces and objects is inconsequential.
Results
Luminance and chromatic contrast sensitivity
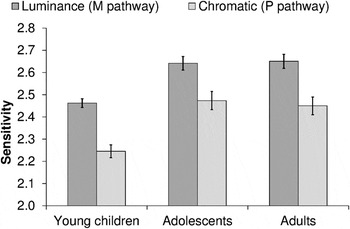
Group mean contrast sensitivities for luminance (light/dark) and chromatic (red/green) gratings are presented in Fig. 2, for each age group (young children, adolescents, and adults). The results of a 2-factor ANOVA (age group × stimulus type) revealed a main effect of age group on contrast sensitivity [F(2,68) = 19.2, P < 0.001]. Posthoc analyses showed that adults and adolescents significantly outperformed young children (both P < 0.001). Adolescents and adults had nearly identical contrast sensitivities (P > 0.99). Because there was no interaction between age group and stimulus type [F(2,68) = 0.40, P = 0.68], these findings suggest that the relative rate of development does not differ for luminance and chromatic contrast sensitivity, at least for the ages we tested.
Group mean sensitivity to luminance contrast (M pathway, dark gray bars) and chromatic contrast (P pathway, light gray bars), for young children (n = 23), adolescents (n = 24), and adults (n = 24). Children were less sensitive to luminance and chromatic contrast than both adolescents and adults (both P < 0.001). Adolescents and adults had nearly identical contrast sensitivities (P > 0.99). Error bars denote +/− standard errors of the means.

Face and object easy trial data
Young children (M = 85.9%, s.e. = 4.41%) were less accurate on the easy face trials than the adolescents (M = 97.5%, s.e. = 1.09) and adults [M = 95.0%, s.e. = 1.81%; F(2,68) = 4.87, p = 0.011], which is not entirely surprising since face recognition in young children is often less accurate than that in adolescents and adults (e.g., Sangrigoli & de Schonen, Reference Sangrigoli and de Schonen2004). However, there was a significant difference in variability between the three groups [Levene’s test: F(2,68) = 6.23, P = 0.003], driven primarily by the larger variability in accuracy with the young children, so caution must be taken when interpreting these results. Also, if a child appeared to be having difficulty on the task, and particularly when the easy trial response was incorrect, we paused the experiment and gave the participant more practice with the paper cards, until the participant again demonstrated the ability to distinguish the two original faces (and likewise for difficulty on the car task). In terms of easy trial car recognition, there were no significant differences in accuracy [F(2,68) = 1.85, P = 0.17; young children: M = 96.7%, s.e. = 1.80%; adolescents: M = 99.2%, s.e. = 0.58%; adults: M = 95.6%, s.e. = 1.46%], which is consistent with an early maturation of object processing ability.
Face and object discrimination
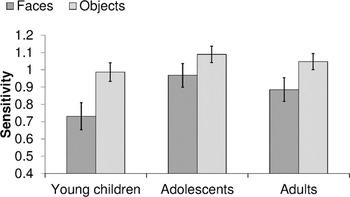
The results of a 2-factor ANOVA (age group × stimulus type) revealed a significant age group by stimulus type interaction [F(2,68) = 3.94, P = 0.024]. To better understand this interaction, we separately investigated the effects of age group on face and object discrimination, using two univariate GLMs. The results from these analyses indicated that age significantly influences face discrimination [F(2,68) = 7.50, P = 0.001], but not object discrimination [F(2,68) = 0.91, P = 0.41]. Posthoc comparisons on face discrimination showed that both adults and adolescents significantly outperformed young children (P = 0.017 and P = 0.001, respectively), with no significant differences between adults and adolescents (P > 0.99). Overall, these results suggest that face, but not object, processing improves between childhood and adulthood.
Group mean sensitivity to faces (dark gray bars) and cars (light gray bars), for young children (n = 23), adolescents (n = 24), and adults (n = 24) when accounting for the influence of luminance and chromatic contrast sensitivity. Error bars denote +/− standard errors of the means.

Face and object discrimination with contrast sensitivity as a covariate
It could be that the observed age-related changes in face discrimination are driven by (i.e., are secondary to) age-related changes in M and/or P subcortical pathways, whose integrity can be measured with luminance and chromatic contrast sensitivity, respectively (but see Discussion for a more complex view). To address this, we conducted a 2-factor GLM, with stimulus type (faces vs. objects) as a within-subjects variable, age group as a between-subjects variable, and luminance and chromatic contrast sensitivity as covariates. The covariates allowed us to ask whether age is predictive of face (or object) discrimination performance when accounting for the effects of age on low-level visual (contrast) sensitivity. Group mean sensitivities for faces and objects are presented in Fig. 3, corrected for luminance and chromatic sensitivity, for each age group (young children, adolescents, and adults). The results of this analysis showed a trend for effects of age group [F(2,66) = 2.55, P = 0.086], but no main effect of luminance contrast sensitivity or chromatic contrast sensitivity (luminance: P = 0.42, chromatic: P = 0.56). More importantly, there was no longer an interaction between age group and stimulus type (faces vs. objects) (P = 0.54; Fig. 3). Instead, the analysis revealed an interaction between luminance contrast sensitivity and stimulus type [F(1,66) = 5.42, P = 0.023, but not between chromatic contrast sensitivity and stimulus type: P = 0.98]. This result suggests that the interaction we observed between age group and stimulus type in our original analysis was driven, in part, by age-related changes in luminance contrast sensitivity (M pathway processing). Given the trend for effects of age, however, we think that age may also have a unique contribution to face discrimination, which is addressed below when we conducted separate 1-factor GLMs.
To examine the interaction between luminance contrast sensitivity and stimulus type, we separately investigated the effects of age and luminance contrast sensitivity on face and object discrimination, using two 1-factor GLMs (with luminance contrast sensitivity as a covariate). In the object GLM, there was no significant effect of age group [F(2,67) = 1.30, P = 0.28] or luminance contrast sensitivity [F(1,67) = 0.81, P = 0.37]. By contrast, in the face GLM, there was a marginally significant effect of age group [F(2,67) = 2.80, P = 0.068] and a nearly significant effect of luminance contrast sensitivity [F(1,67) = 3.96, P = 0.051]. Thus, these results suggest that even when luminance contrast sensitivity is taken into account, there remains a unique effect of age on face discrimination. However, the GLM could not truly examine the unique contribution of luminance contrast sensitivity to face sensitivity, while controlling for age, because age was a between-subjects factor and not a continuous within-subjects variable. Thus, the effect of individual differences in age, which may contribute to luminance contrast sensitivity and face sensitivity, are not accounted for. Therefore, if the GLM were to find a unique contribution of luminance contrast sensitivity to faces, it could be driven by the main effect of age on face sensitivity (although, it is unlikely that this is the case, since chromatic contrast sensitivity also improves with age but does not appear to influence face sensitivity). Alternatively, the observed effect of luminance contrast sensitivity on face discrimination could be direct, that is, driven by a real relationship between luminance contrast sensitivity and face discrimination within each age group, suggesting that M pathway processing (reflected in luminance contrast sensitivity) may play a unique role in face processing ability. To get at this, in our next analyses (below), we conducted multiple regressions and Pearson correlations separately for the different ages.
Multiple regressions and Pearson correlations
In these analyses, we start with the data for children. We ran a multiple regression model as well as Pearson correlations. For the regressions, we ran one with face sensitivity as the dependent variable and the other with car sensitivity as the dependent variable. Independent variables, that is, predictor factors, in both regressions included age in months, luminance contrast sensitivity and chromatic contrast sensitivity. The multiple regression for face sensitivity was completely nonsignificant (P = 0.47), suggesting that individual differences in age, luminance and chromatic contrast sensitivity could not account for individual differences in face sensitivity. The same results were also observed for car sensitivity, that is, a nonsignificant model fit (P = 0.138). However, Pearson correlation analyses between all the possible pairs of different variables (age, luminance contrast sensitivity, and chromatic contrast sensitivity) with face or object sensitivity revealed a significant negative correlation between object sensitivity and luminance contrast sensitivity (r = −0.48, P = 0.02), yet no correlation between luminance contrast sensitivity and face sensitivity (P = 0.85). One possible interpretation of the negative correlation found in young children is that it marks the start of a dissociation between object and M pathway processing that later becomes a positive association between face and M pathway processing. In other words, it reflects the early stages of forming a relationship between face sensitivity and luminance contrast sensitivity (i.e., M pathway processing).
Next, we turn to our analysis of adolescents and adults. Since our adolescents ranged from 13.6–17.3 years old and our adults ranged from 17.9–28.5 years old, and there were no significant differences between the adolescents and adults in any of our experiment measures, we decided to join the two groups for the multiple regression. This gave us a larger range of ages across which to assess a possible relationship between age (in months), luminance and chromatic contrast sensitivity, and face/object sensitivity. Accordingly, the multiple regression on face sensitivity for adolescents and adults accounted for a significant amount of the within-group variance in face sensitivity, [R 2 = 0.18, F(3,44) = 3.24, P = 0.031]. An examination of the individual coefficients revealed that luminance contrast sensitivity was the only significant predictor of face sensitivity [t(46) = 2.16, P = 0.036], as luminance contrast sensitivity improved, so did face sensitivity (β = 0.58). In contrast, the multiple regression on car sensitivity produced no significant results [F(3,44) = 0.28, P = 0.84]. The results of our Pearson correlations revealed a significant positive correlation between face sensitivity and luminance contrast sensitivity (r = 0.37, p = 0.011) and a significant positive correlation between face sensitivity and chromatic contrast sensitivity (r = 0.29, p = 0.045). In addition, there was a significant positive correlation between luminance contrast sensitivity and chromatic contrast sensitivity (r = 0.29, P = 0.049), which may, at least in part, account for the positive correlation between chromatic contrast sensitivity and face sensitivity. To test this possibility, we computed the partial correlation between luminance contrast sensitivity and face sensitivity, when the influence of chromatic contrast sensitivity is taken into account. Likewise, we also computed the partial correlation between chromatic contrast sensitivity and face sensitivity, when the influence of luminance contrast sensitivity is taken into account. Indeed, results showed a positive correlation between luminance contrast sensitivity and face sensitivity (r = 0.31, P = 0.036), but no significant correlation between chromatic contrast sensitivity and face sensitivity (P = 0.16). These results suggest that the original correlation observed between chromatic contrast sensitivity and face sensitivity was instead a reflection of the correlation between luminance contrast sensitivity and face sensitivity in adolescents and adults.
Discussion
The current study is the first to test the development of both face and object (car) discrimination, using stimuli that are equated in their low-level visual characteristics (luminance, contrast, and spatial frequency make-up) and using threshold methods that equate difficulty across ages. Our results show that between childhood and adulthood face, but not object, discrimination improves significantly. Importantly, we did not directly compare faces and objects in our experiment, since it would be as meaningful as comparing apples and oranges. This is because, although we equated the faces and cars in their low-level visual characteristics, the perceptual similarity between Face 1 and Face 2 is not necessarily the same as for Car 1 and Car 2. Thus, the amount of perceptual change represented in a single morph unit in the face continuum may not be the same as in the car continuum, which makes a direct comparison impossible to interpret. However, we can still assess the developmental trajectories of face and object processing by making comparisons across ages. In this context, the comparison is meaningful, since the “apples versus oranges” problem is present at all age levels and thus factors out. Consequently, the resulting relative measurements reflect age-based differences in face and object processing mechanisms that are independent of the inherent stimulus differences. The results from our simple face and object discrimination task add to the evidence for age-related improvements in face processing obtained in previous research (see Introduction).
Perhaps the most novel contribution of the current study is the inclusion of the luminance (light/dark) and chromatic (red/green) contrast sensitivity conditions, which we used as a proxy for measuring the integrity of the magnocellular (M) and parvocellular (P) subcortical visual pathways, respectively. This allowed us to address the possibility that age-related improvements in face discrimination may be driven by (i.e., are secondary to) age-related changes in M and/or P subcortical pathways. Before proceeding with this discussion, it is important to point out that there is some controversy about the link between luminance/chromatic sensitivity and M/P pathway processing (see Bosworth & Dobkins, Reference Bosworth and Dobkins2009 for discussion). Although the P pathway may be the sole mediator of chromatic contrast sensitivity, the M pathway is unlikely to be the sole mediator of luminance contrast sensitivity, for two main reasons (see Lennie & D’Zmura, Reference Lennie and D’Zmura1988; Merigan & Maunsell, Reference Merigan and Maunsell1993; Skottun, Reference Skottun2000 for reviews). First, there are about eight times more P than M neurons, and thus while each individual P neuron may have lower luminance contrast sensitivity than each M neuron, probability summation across neurons may give the P pathway the upper hand on luminance contrast sensitivity. Second, lesion studies have shown that both M and P pathway lesions impair luminance contrast sensitivity (e.g., Merigan & Eskin, Reference Merigan and Eskin1986; Merigan & Maunsell, Reference Merigan and Maunsell1990; Schiller et al., Reference Schiller, Logothetis and Charles1990; Merigan et al., Reference Merigan, Katz and Maunsell1991). In sum, while the P pathway probably largely mediates chromatic contrast sensitivity, both the M and P pathways are likely to mediate luminance contrast sensitivity.
Stated in a way that is most relevant to the interpretation of our results, the general consensus is that the M pathway contributes to luminance, but not chromatic, contrast sensitivity. Because the results of the current study revealed effects of luminance, but not chromatic, contrast sensitivity on face discrimination in adolescents and adults and on object discrimination in young children, the logical deduction is that the effects observed in the current study are mediated by the M, and not the P, pathway. We also acknowledge that since we could not measure isoluminance in young children, our measures of chromatic contrast sensitivity could have been contaminated with some luminance contrast, thus activating the M pathway. However, if this were true, we would have expected the relationship between chromatic contrast sensitivity and object sensitivity in young children to mirror that of luminance contrast sensitivity and object sensitivity. This did not happen. Instead, the results of our correlation analyses in young children suggest a negative relationship between luminance contrast sensitivity, but not chromatic contrast sensitivity, and object sensitivity. Accordingly, we suggest that these results may reflect the early stages of forming a relationship between face sensitivity and luminance contrast sensitivity. That is, as the M and P pathway develop and specialize, the visual information carried by the M pathway may first become less relevant to object processing (during early childhood), and then slowly increase in relevance to face processing (starting in adolescence). However, our current results, that is, a single correlation, are too weak to truly support this hypothesis. Instead, we suggest that more research may wish to explore this idea. In sum, our results suggest significant development of face processing between childhood and adulthood, which may be mediated, in part, by the development of the subcortical M pathway.
In terms of the broader developmental research on face processing, our results suggest that the face-specific developmental improvement reported in many studies is “face-specific” for two reasons, one resulting from low-level visual processing improvement and one high-level. That is, part of the face-specific development reflects low-level perceptual development, which merely extends to ancillary high-level tasks such as face processing rather than object processing. However, we believe the remaining face-specific processing development is truly face-specific, that is, results from a high-level improvement in the ability to process faces but not objects. It is not uncommon to suggest that face-specific development reflects basic cognitive development, with face processing tasks generally being more difficult than the object-based tasks (reviewed in McKone et al., Reference McKone, Crookes, Jeffery and Dilks2012). That is, the reason for observing “face-specific” improvements in face versus object processing experiments is because the face task is harder than the object task, and younger children have not yet developed the ability to handle the harder (face processing) task. Specifically, for each participant, we found the stimulus that corresponded with 80% correct responses. Thus, accuracy could not vary between participants or by age; instead the stimulus needed to produce 80% correct varied (i.e., threshold). Along these lines, thresholds for all participants were greater than 1 morph unit (ceiling and an ideal observer) and less than 50 morph units (floor). As a result, we can be confident that our thresholds truly reflect the stimulus required to perform with 80% accuracy.
Given that there is a relationship between luminance contrast sensitivity and face discrimination, we now discuss some possible neural mechanisms by which the M pathway might interact with face processing areas of the brain. There are three major lines of evidence that are consistent with this possibility. The first comes from perceptual studies showing that face processing is better under stimulus conditions that tap the M, more than the P, pathway. In addition to the use of luminance and chromatic stimuli (as in the current study), another way to bias activity in the M and P pathways is to use spatial frequency-filtered stimuli, with the notion that the M pathway is more sensitive to low-spatial frequency (LSF, i.e., coarse) images, while the P pathway is more sensitive to high spatial frequency (HSF, i.e., fine details) images (reviewed in Maunsell et al., Reference Maunsell, Nealey and DePriest1990; Bullier & Nowak, Reference Bullier and Nowak1995; Chen et al., Reference Chen, Lakatos, Shah, Mehta, Givre, Javitt and Schroeder2007; reviewed in Merigan & Maunsell, Reference Merigan and Maunsell1993; reviewed in Shapley, Reference Shapley1990). In studies that measure face discrimination for both LSF (M pathway biased) and HSF (P pathway biased) faces, it has been shown that both young children and adults perform better on the LSF faces, which is consistent with the notion of a stronger influence of the M pathway on face processing (Fiorentini et al., Reference Fiorentini, Maffei and Sandini1983; Deruelle et al., Reference Deruelle, Rondan, Gepner and Tardif2004). Even on first principles, one might suppose that the LSF M pathway system plays a significant role in face processing since face (but not object) recognition relies largely on holistic processing and configural processing, such as encoding the distance between the eyes relative to the width of the face, etc. (faces: Searcy & Bartlett, Reference Searcy and Bartlett1996; objects: Tanaka & Farah, Reference Tanaka and Farah1993), both of which are more likely served by a LSF (M pathway) mechanism.
The second line of evidence for a M pathway contribution to face processing comes from the notion of a fast subcortical pathway for face processing through the amygdala, a limbic system structure that receives input from the M pathway (see Farroni et al., Reference Farroni, Johnson, Menon, Zulian, Faraguna and Csibra2005 for a review). Specifically, several studies have shown that the amygdala responds selectively to different facial expressions of emotion (e.g., Whalen et al., Reference Whalen, Rauch, Etcoff, McInerney, Lee and Jenike1998; Adolphs et al., Reference Adolphs, Baron-Cohen and Tranel2002) and may play a role in drawing attention to the eyes in a face (Adolphs et al., Reference Adolphs, Gosselin, Buchanan, Tranel, Schyns and Damasio2005; reviewed in Johnson, Reference Johnson2005, Reference Johnson2011; reviewed in Pessoa & Adolphs, Reference Pessoa and Adolphs2010; Spezio et al., Reference Spezio, Huang, Castelli and Adolphs2007). That the amygdala face system may be independent from the cortical face processing system is evidenced by the finding that the amygdala may be very rapidly activated by faces (Krolak-Salmon et al., Reference Krolak-Salmon, Henaff, Vighetto, Bertrand and Mauguiere2004; Garrido et al., Reference Garrido, Barnes, Sahani and Dolan2012; but see Pessoa & Adolphs, Reference Pessoa and Adolphs2010) and that it can be activated in the absence of conscious input from visual cortex (Morris et al., Reference Morris, Ohman and Dolan1999; Morris et al., Reference Morris, DeGelder, Weiskrantz and Dolan2001; Pasley et al., Reference Pasley, Mayes and Schultz2004).
There are a couple of reasons to believe that the amygdala face processing system receives a strong M pathway input. First, there are fMRI studies showing that the amygdala (as well as the pulvinar and superior colliculus) responds to LSF faces and particularly fearful LSF faces (Winston et al., Reference Winston, Vuilleumier and Dolan2003). This subcortical route appears to be insensitive to HSF information about faces, although HSF faces activate cortical face processing areas, such as the fusiform face area, FFA (see below). Second, the amygdala is thought to get mainly input from the M pathway, by virtue of the fact that the M pathway provides the bulk of the input to the superior colliculus (Schiller et al., Reference Schiller, Malpeli and Schein1979), together with the fact that the superior colliculus provides input to the pulvinar, which in turn provides input to the amygdala (Jones & Burton, Reference Jones and Burton1976; Romanski et al., Reference Romanski, Giguere, Bates and Goldman-Rakic1997; Linke et al., Reference Linke, De Lima, Schwegler and Pape1999; see also Vuilleumier et al., Reference Vuilleumier, Armony, Driver and Dolan2003).
While the exact role of the amygdala in face processing, and its independence from cortical processing, is still rather controversial (Delorme & Thorpe, Reference Delorme and Thorpe2001; reviewed in Johnson, Reference Johnson2011; reviewed in Pessoa & Adolphs, Reference Pessoa and Adolphs2010), the general consensus from the literature supports the existence of a subcortical face processing system that is largely influenced by the M pathway. This is in contrast to what is thought to be the case for cortical face processing regions. Specifically, the FFA has been shown to be sensitive to both LSF and HSF faces (Winston et al., Reference Winston, Vuilleumier and Dolan2003; Rotshtein et al., Reference Rotshtein, Geng, Driver and Dolan2007). Given that LSF and HSF information is tied to configural processing (i.e., second-order spatial relations) and featural processing of faces, respectively (Sergent, 1985), it is perhaps not surprising that the FFA also responds to differences along these two dimensions (Rotshtein et al., Reference Rotshtein, Geng, Driver and Dolan2007). Although these results suggest a contribution of both M and P pathways to face responses in FFA, it is interesting to note that one fMRI study has shown that responses in the FFA to differences in second-order spatial relations, but not responses to differences in facial features, correlate with face recognition performance (Rotshtein et al., Reference Rotshtein, Geng, Driver and Dolan2007). Together, these results lend further support for the notion that, in addition to playing a role in subcortical face processing, the M pathway also plays a role in cortical face processing.
The third line of evidence for a M pathway influence on face processing comes from the notion that the M pathway contributes to stimulus recognition by providing top-down feedback about likely object representations to the inferotemporal (IT) cortex (Bar, Reference Bar2003; Kveraga et al., Reference Kveraga, Boshyan and Bar2007; see Pessoa & Adolphs, Reference Pessoa and Adolphs2010 for a review). This top-down information is thought to be fast and coarse, providing an initial “guess” to IT cortex about the identity of the stimulus. One manner in which this could occur is by way of M pathway projections leading from early visual cortex (areas V2 and V4) and extending to the prefrontal cortex. M pathway information that has arrived in the prefrontal cortex may then spread to the orbitofrontal cortex (OFC) (reviewed in Barbas, Reference Barbas1995; Rempel-Clower & Barbas, Reference Rempel-Clower and Barbas2000), where initial expectations about the visual stimulus could be formed. Notably, the OFC contains “top-down” projections to the IT cortex (reviewed in Cavada et al., Reference Cavada, Company, Tejedor, Cruz-Rizzolo and Reinoso-Suarez2000) and the amygdala (Rempel-Clower & Barbas, Reference Rempel-Clower and Barbas2000; Ghashghaei et al., Reference Ghashghaei, Hilgetag and Barbas2007), providing a mechanism by which the OFC could influence neural responses and perhaps aid in stimulus recognition. Because the IT cortex includes regions that specialize in face processing, such as the FFA (Kanwisher et al., Reference Kanwisher, McDermott and Chun1997), it is highly possible that the M pathway-biased information from the OFC influences face processing. Thus, if the results of the current study, that is, a relationship between M pathway sensitivity and face, but not object, processing, are related to M pathway-biased top-down projections from OFC to IT cortex, we would have to assume that this top-down information is particularly important in priming face representations in the FFA (and less important for priming object representations) Alternatively, because there are projections from the OFC to the amygdala (presumed to be involved in face processing, see above), this might also account for our finding of a relationship between M pathway sensitivity and face, but not object, processing.
Regardless of the exact mechanism, the results of the current study add to the mounting evidence for a role of the M pathway in face processing. There is much more to be done to test this hypothesis, and more reasoning needed to understand why the M pathway may be particularly suited for face processing. As Davida Teller would often say when I (Karen Dobkins) was a postdoc in her laboratory, showing her some exciting result and conjecturing away about it: “we need more data”! We hope to continue this line of work, using different sorts of face and object processing tasks across development, to see if there is supplementary evidence for the notions put forth here.
Acknowledgments
We would like to thank Shereen Cohen for her assistance with data collection and Emily Blumenthal for statistical guidance and feedback on this paper. This work was supported by NIH/NICHD R01 HD052804-01A2 (awarded to KD).