Introduction
Many groups of Sternorrhynchan insects depend on endosymbiotic bacteria to provide nutrients not present in their plant-fluid based diets (Buchner, Reference Buchner1965; Moran, Reference Moran2001; von Dohlen et al., Reference von Dohlen, Kohler, Alsop and McManus2001; Baumann, Reference Baumann2005; Moran et al., Reference Moran, McCutcheon and Nakabachi2008). Due in part to the obligate associations between these organisms, phylogenetic analyses of these primary-endosymbionts and their insect hosts have found patterns of phylogenetic congruence at the family level (Gruwell et al., Reference Gruwell, Morse and Normark2007; Urban & Cryan, Reference Urban and Cryan2012; Kuechler et al., Reference Kuechler, Gibbs, Burckhardt, Dettner and Hartung2013) as well as at the species level (Ahmed et al., Reference Ahmed, De Barro, Ren, Greeff and Qiu2013; Liu et al., Reference Liu, Huang, Zhang, Jiang and Qiao2013). One group of Sternorhynchans where family level patterns of phylogenetic congruence between host and primary endosymbiont have been observed is the armored scale insects (Coccoidea: Diaspididae) and their primary endosymbiont Uzinura diaspidicola Gruwell et al. (Reference Gruwell, Morse and Normark2007). However, patterns of phylogenetic congruence between these insects and U. diaspidicola remain to be explored below the family level.
When Gruwell et al. (Reference Gruwell, Morse and Normark2007) identified the primary endosymbiont of all armored scales as U. diaspidicola by comparing the family level phylogeneies of U. diaspidicola and its armored scale hosts, the authors included eleven genera of armored scales that were each represented by two or more species. Seven of these genera showed strict co-diversification with their endosymbionts, whereas patterns for the remaining genera were less congruent. All genera, however, were represented by only a small number of individuals per genus, and thus it remains unclear whether or not the previously observed family level congruencies also extend to the species level for armored scales. One of the multi-species genera included by Gruwell et al. (Reference Gruwell, Morse and Normark2007), Chionaspis, and two pine-feedings members of this genus C. pinifoliae Fitch and C. heterophyllae Cooley were recently the subject of an extensive intra-specific study (Gwiazdowski et al., Reference Gwiazdowski, Vea, Andersen and Normark2011). In that study, Gwiazdowski et al. (Reference Gwiazdowski, Vea, Andersen and Normark2011) sampled 320 individuals from across their North American range and found that North American species of Chionaspis formed a monophyletic group, confirmed C. heterophyllae as a single species, and revealed C. pinifoliae to be a complex of at least nine species-based on a morphological survey in concert with multi-locus genealogical concordance. Four species from this group were recently described (Vea et al., Reference Vea, Gwiazdowski and Normark2012), and the extensive geographic sampling for this group provides a fine-scale context to explore host/endosymbiont co-evolution near the species level in armored scales.
Therefore, we took advantage of this existing dataset and we built upon the host DNA sequence data collected by Gwiazdowski et al. (Reference Gwiazdowski, Vea, Andersen and Normark2011) by sequencing three loci from the primary endosymbiont U. diaspidicola to examine whether patterns exist of phylogenetic congruence between closely related species in the C. pinifoliae–C. heterophyllae species complex and their primary endosymbiont. We then compared these phylogenies to the biogeographic and plant–host information associated with each individual to explore whether patterns of diversity of U. diaspidicola and/or its hosts in the C. pinifoliae–C. heterophyllae species complex are shaped by biogeographic or plant–host association processes.
Materials and methods
Sampling and gene selection
Full collection information including locality, species designations, and per-specimen GenBank accession numbers for all host DNA sequences for all specimens used in this study are available in Supplementary Table 1 of Gwiazdowski et al. (Reference Gwiazdowski, Vea, Andersen and Normark2011). Though Vea et al. (Reference Vea, Gwiazdowski and Normark2012) have recently described several species in the C. pinifoliae–C. heterophyllae species complex, we follow the species designation scheme of Gwiazdowski et al. (Reference Gwiazdowski, Vea, Andersen and Normark2011; e.g., S1 for C. heterophyllae, S2 for Chionaspis species number two, S3 for Chionaspis species number three, etc.) for easier comparison between these two studies.
DNA extraction and PCR amplification
Total genomic DNA from individual armored scale insects was isolated as part of Gwiazdowski et al. (Reference Gwiazdowski, Vea, Andersen and Normark2011) using the DNEasy Blood and Tissue Kit (Qiagen, Valencia, California). These extracts were used to amplify fragments of DNA from U. diaspidicola following PCR protocols for armored scale insect endosymbionts (Gruwell et al., Reference Gruwell, Morse and Normark2007, Reference Gruwell, Wu and Normark2009). We amplified three endosymbiont genes from U. diaspidicola: 16S rRNA, GroEL (a chaperone gene), and rspB (a nuclear protein-coding gene); the amino acid variation in these genes is consistent with active genes mapped in the U. diaspidicola genome (Sabree et al., Reference Sabree, Huang, Okusu, Moran and Normark2013).
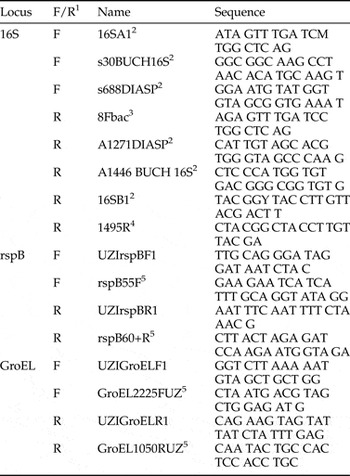
Individual gene fragments were amplified using standard PCR procedures on a TC – 3000 G thermal cycler (Techne Corp, MN) using the following protocols. Previously published primers were used to amplify fragments of 16S, and a combination of previously published primers and novel primers developed for this study were used to amplify fragments of rspB and GroEL (table 1). Reactions were performed using Nexus PCR Premix Taq following the manufacturer's protocol (Bionexus, Oakland, California) and brought to 25 μl using ultra pure H2O. Thermocycler conditions were as follows: for 16S and GroEL genes, an initial denaturation temperature of 95 °C for 5 min, followed by 30 cycles of 95 °C for 30 s, 49 °C for 60 s, and 72 °C for 30 s, and finishing with a final extension at 72 °C for 5 min; and for rspB, an initial denaturation temperature of 95 °C for 5 min, followed by 5 cycles of 95 °C for 30 s, 54 °C for 30 s, and 72 °C for 1 min, 5 cycles of 95 °C for 30 s, 51 °C for 30 s, and 72 °C for 1 min, 5 cycles of 95 °C for 30 s, 49 °C for 30 s, and 72 °C for 1 min, 5 cycles of 95 °C for 30 s, 47 °C for 30 s, and 72 °C for 1 min, 30 cycles of 95 °C for 30 s, 45 °C for 30 s, and 72 °C for 1 min, finishing with a final extension at 72 °C for 10 min (Moulton & Wiegmann, Reference Moulton and Wiegmann2004). PCR products were visualized using 1.5% agarose gels stained with EZVision® (Amresco, Solon, Ohio).
Names, orientations, and sequences for primers used in this study.

1 Designation of forward (F) or reverse (R) primers.
2 Primers originally published in Gruwell et al. (Reference Gruwell, Morse and Normark2007).
3 Universal primer originally published in Gruwell et al. (Reference Gruwell, Hardy, Gullan and Dittmar2010).
4 Endosymbiont specific primer derived from Weisburg et al. (Reference Weisburg, Barns, Pelletier and Lane1991).
5 Primers originally published in Andersen et al. (Reference Andersen, Gwiazdowski and Gruwell2014).
DNA sequencing and alignment
PCR products were either purified with ExoSAP-IT® (Affymetrix, Santa Clara, California) and sequenced at Penn State Nucleic Acid Facility (University Park, Pennsylvania), or purified and sequenced at the High throughput Genomics Center (Seattle, Washington). Sequences were edited and assembled using Geneious v. 5.6.2 (Drummond et al., Reference Drummond, Ashton, Buxton, Cheung, Cooper, Heled, Kearse, Moir, Stones-Havas, Sturrock, Thierer, Wilson, Drummond, Ashton, Buxton, Cheung, Cooper, Heled, Kearse, Moir, Stones-Havas, Sturrock, Thierer and Wilson2012), and sequence alignments were created using MUSCLE (Edgar, Reference Edgar2004). All alignments were then truncated to the length of the shortest assembled sequence. DNA sequences generated in this study are available on Genbank under the following accession numbers: for 16S KF300549–KF300621, for GroEL KF300622–KF300699, and for rspB KF300700–KF300768. A concatenated dataset was then constructed from the endosymbiont sequence data and trimmed to only include individuals from whom at least two of the three-endosymbiont loci were available. Insect DNA sequences from the nuclear loci 28S and elongation factor 1-alpha (EF1α) and the mitochondrial locus cytochrome oxidase I and II (COI–COII) for all individuals from which at least two endosymbiont sequences were sequenced were then downloaded from GenBank, and each locus was aligned independently using MUSCLE (Edgar, Reference Edgar2004). The alignment for each locus was then truncated and a concatenated dataset was generated as per the endosymbiont dataset. No regions of the endosymbiont datasets were masked from analyses, as there were no insertions or deletions present. For the concatenated host dataset there were no insertions or deletions present in 28S; however, the intergenic region located between COI and COII was excluded from analysis, as were the introns in EF1α.
Genetic analyses
Statistical parsimony networks were constructed for each of the endosymbiont alignments using TCS v. 1.21 (Clement et al., Reference Clement, Posada and Crandall2000) with a 95% connection limit. We then performed phylogenetic reconstructions for both the concatenated endosymbiont dataset and the concatenated host dataset using MrBayes (Huelsenbeck, Reference Huelsenbeck2001) with the following steps. First, the concatenated datasets were partitioned by gene and further partitioned by codon for each of the protein coding genes (GroEL, rspB, EF1α and COI–COII). Then a best-fitting nucleotide model for each gene was determined based on AIC scores using ModelTest (Posada & Crandall, Reference Posada and Crandall1998), and the best-fit model for each gene was then used to assign the appropriate number of unique substitution rates and model of rate variation to each partition. For both datasets two independent runs, each with four chains, were analyzed for 20 million generations with sampling every 1000th generation and a heating of 0.2. All phylogenetic analyses were run through the CIPRES Science Gateway (Miller et al., Reference Miller, Pfeiffer and Schwartz2010). The program Tracer (Rambaut & Drummond, Reference Rambaut, Drummond, Rambaut and Drummond2007) was used to visualize that the log-likelihood scores and a burn-in of 20% (4 million generations) was performed before summarizing the majority rule consensus tree for each dataset.
To compare the congruence of the majority rule consensus trees constructed from the concatenated endosymbiont and the concatenated host datasets we compared the fit of the two trees to the endosymbiont dataset and tested whether there were significant differences between the trees using a Shimodaira-Hasegawa (SH) test as implemented in the phylogenetic program PAUP*4.0beta (Swofford, Reference Swofford, Swofford and Sunderland2002). Significance was obtained using 10,000 bootstrap replicates.
Biogeographic and plant–host association analyses
Collection information, including the geographic region of origin and the plant species from which individual specimens were collected from were scored as characters in MacClade v. 4.08 (Maddison & Maddison, Reference Maddison, Maddison, Maddison, Maddison and Sunderland2005). For the biogeographic analyses individuals collected in Georgia, Massachusetts, Maine, North Carolina, Tennessee and Wisconsin were scored as ‘Eastern US’, individuals collected in Arizona, Baja California, California, Colorado, Texas, Utah and Washington State were scored as ‘Western US and Baja CA,’ and individuals collected in the Mexican states of Oaxaca, Sonora and Mexico were scored as ‘Mexico.’ For the plant association analyses, plant host species were scored by their subgenus affiliations following the Gymnosperm Database (Earle, Reference Earle2014) and the Jepson Herbarium eFlora Database (Jepson Flora Project 2014). These characters were then mapped onto the host and endosymbiont phylogenies using the trace character feature in MacClade, and the ancestral state for each node was calculated using maximum parsimony reconstruction.
Results
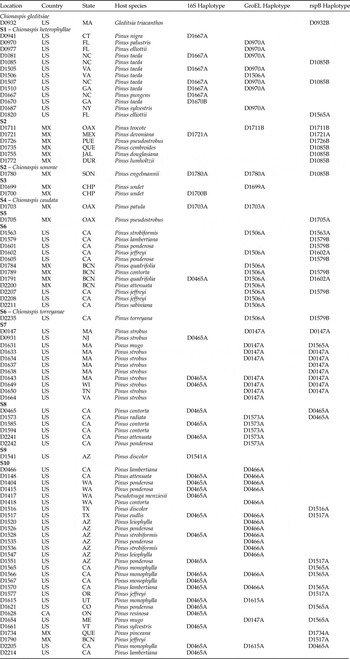
The best-fit model for each locus are as follows: for 16S the best-fit model was TIM+I, for GroEL the best-fit model was F81+I, for rspB the best-fit model was TrN+I, for 28S the best-fit model was K81uf+I, for EF1α the best-fit model was TrNef+I, and for COI–COII the best-fit model was TrN+I+G. The alignment length for each locus, the number of constant sites, and the number of parsimony informative (PI) sites were calculated using PAUP*4b10.0 (Swofford, Reference Swofford, Swofford and Sunderland2002), and are presented in table 2. Haplotype information for each locus, and summary collection information for all individuals are shown in table 3. The network analysis of the 16S rRNA data set included 36 sequences (fig. 1), the network analysis of the rspB data set included 43 sequences (fig. 1), and the network analysis of the GroEL data set included 52 sequences (fig. 1). These analyses showed broad patterns of congruence between haplotype groups and species in the C. pinifoliae–C. heterophyllae species complex as classified by Gwiazdowski et al. (Reference Gwiazdowski, Vea, Andersen and Normark2011) as there were no species with polyphyletic haplotypes for 16S, and only two species with polyphyletic haplotypes for GroEL and rspB (fig. 1). For 16S, the network diagram was divided into four sections each separated by two or more base pair changes. The first included all individuals of S1, the second included all individuals of S3, and S5, the third included all individuals of S2, and the final section included all individuals of species S4, S6, S7, S8, S9 and S10. For GroEL, the network was divided into four sections separated by at least three basepair changes. The first grouping included all individuals of S7, S8 and S10. The second group included a single haplotype that included all the individuals of S6 as well as one individual of S1. The third grouping included a single haplotype that included only individuals of S1. The fourth group included four distantly related haplotypes each represented by a single individual only, two from S2, one from each S3 and S4. For rspB, the network was divided into three sections separated by at least three base pair changes. The first included individuals of Species S7, S8 and S10 as well as several individuals from S1. The second grouping included all individuals of S2, the one outgroup individual and several individuals of S1. The final grouping included only individuals of S6.
Network diagram for 16S, GroEL, and rspB showing relationships between haplotypes. Haplotypes are drawn proportional to the number of individual sequences belonging to each group. The haplotype names adjacent to each circle represents the haplotype designations seen in table 3. Patterns are used to represent the species designation for the individual from whom each sequence was obtained. Distances between haplotypes are shown with lines and open circles (i.e., a line connecting two haplotypes equal one base-pair change, while open circles represent additional base pair changes).

Alignment length and character summary status for each locus analyzed. The overall length of the truncated alignment for both endosymbiont and host loci, the number of constant sites (CS) and the number of parsimony-informative sites (PI) as calculated in PAUP (Swofford, Reference Swofford, Swofford and Sunderland2002) are reported.

Summary of collection information presented in Gwiazdowski et al. (Reference Gwiazdowski, Vea, Andersen and Normark2011) including 16 s, GroEL and rspB haplotype information. For those species that have been described, species designations (S1–S10) are followed by their scientific name. 1

1 Vea et al. (Reference Vea, Gwiazdowski and Normark2012) recently described three species included in this analysis, C. caudata, C. sonorae, and C. torreyanae. Chionaspis sonorae includes some individuals previously described as S2 and C. torreyanae includes some individuals previously described as S6 by Gwiazdowski et al. (Reference Gwiazdowski, Vea, Andersen and Normark2011). During analyses we have used S2 and S6 as per Gwiazdowski et al. (Reference Gwiazdowski, Vea, Andersen and Normark2011); however, in the table above we show both designations for reference.
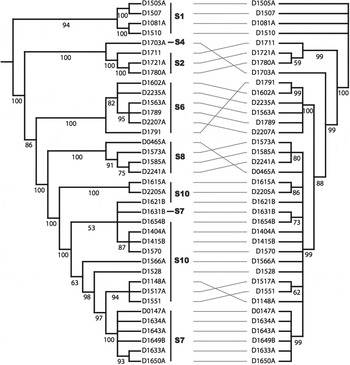
The Bayesian reconstruction of the concatenated endosymbiont and host datasets included sequences from 37 individuals (fig. 2). This majority rule consensus tree for the analysis of the concatenated endosymbiont dataset included monophyletic assemblages for S1, S2 and S6, with species S4 being putatively monophyletic (it was only represented by a single individual), and with species S6, S7, S8 and S10 forming a single unresolved clade. The majority rule consensus tree for the analysis of the host dataset reconstructed monophyletic species assemblages for S1, S2, S6 and S8 with species S4 being putatively monophyletic (again only represented by one individual), and with species S7 being reconstructed as polyphyletic and species S10 as paraphyletic, though together they form a well-supported clade with 100% Bayesian Posterior Probability (BPP).
Tanglegram comparing the majority rule consensus trees from the Bayesian reconstructions of the concatenated host (left) and concatenated endosymbiont (right) datasets. Numbers below each branch correspond with the BPP for each supported branch. To the right of the taxon labels for the host phylogeny are the species designations from Gwiazdowski et al. (Reference Gwiazdowski, Vea, Andersen and Normark2011). Lines connecting the taxon labels between the two phylogenies have been drawn to emphasize topological differences between the two phylogenies.

The primary differences between the endosymbiont and host phylogenies were that the level of resolution seen in the host dataset was much greater than seen in the endosymbiont dataset, and that the placement of species S4 differed between reconstructions (fig. 2). In the endosymbiont phylogeny this species formed a clade including species S6–S10, while in the host phylogeny this species formed a clade only including species S2. These relationships were strongly supported in both datasets (endosymbiont – 99% BPP, host – 100% BPP). When we compared the congruence of the two trees using the SH test, we found no significant differences (ln difference = −1.16733, P = 0.4892) between the topologies of the COI–COII tree and the endosymbiont tree.
The biogeographic analyses for the host and endosymbiont datasets showed clear associations between the phylogenetic placements of individuals and geographic regions of collection (fig. 3). Two individuals (D1631B and D1654B) were collected in the eastern US but group with individuals collected in the western US and Baja California. These two individuals were collected from an ornamental plant, Pinus mugo, and their collection in the eastern US could be the result of transportation of nursery stocks. The results from the plant association analysis found no clear patterns of phylogenetic associations with Pinus subgenera, though for both datasets we reconstructed the ancestral hosts of members of the C. pinifoliae–C. heterophyllae species complex to belong to the Pinus subgenus Pinus (fig. 4).
Biogeographic patterns based on collection information published in Gwiazdowski et al. (Reference Gwiazdowski, Vea, Andersen and Normark2011). Geographic regions for the collection locality were mapped onto the host (left) and endosymbiont (right) phylogenies using the trace character feature in MacClade v 4.08 (Maddison & Maddison, Reference Maddison, Maddison, Maddison, Maddison and Sunderland2005).

Plant host association patterns based on collection information published in Gwiazdowski et al. (Reference Gwiazdowski, Vea, Andersen and Normark2011). Subgenus designations for the species of Pinus from which each individual was collected were mapped onto the host (left) and endosymbiont (right) phylogenies using the trace character feature in MacClade v 4.08 (Maddison & Maddison, Reference Maddison, Maddison, Maddison, Maddison and Sunderland2005).

Discussion
Here we have explored patterns of co-diversification between members of the C. pinifoliae–C. heterophyllae species complex and their primary endosymbiont U. diaspidicola. We find no significant differences between the two phylogenies reconstructed for the host and endosymbiont datasets using a SH test (P = 0.4892). This congruence suggests that insect and endosymbiont co-evolution seen at the family level in armored scale insects (Gruwell et al., Reference Gruwell, Morse and Normark2007) may also occur at the species level among members of the C. pinifoliae–C. heterophyllae species complex. Similar species level patterns have recently been observed in other Sternorrhynchan-endosymbiont systems where phylogenetic patterns of co-diversification between closely related insect species and their endosymbionts have been observed in white flies (Ahmed et al., Reference Ahmed, De Barro, Ren, Greeff and Qiu2013) and aphids (Liu et al., Reference Liu, Huang, Zhang, Jiang and Qiao2013). These increasingly discovered family and species level patterns of co-diversification support the increased use of endosymbiont sequence data to help reconstruct host phylogenetic patterns (Lozier et al., Reference Lozier, Roderick and Mills2007; Andersen et al., Reference Andersen, Wu, Gruwell, Gwiazdowski, Santana, Feliciano, Morse and Normark2010; Bennett & O'Grady, Reference Bennett and O'Grady2012).
When analyzed independently, all of the endosymbiont loci showed patterns of haplotype sharing between at least two species of Chionaspis, though in general these results indicated that individual loci were mostly congruent with host species designations. For 16S the sharing of haplotypes was seen between closely related species (species S6, S7, S8 and S10), while for rspB and for GroEL individuals from S1 shared haplotypes with distantly related species (S7, S8 and S10 for rspB, and S6 for GroEL). It is unclear whether differences are the result of incomplete lineage sorting, horizontal transfer, or some other cause, though for all endosymbiont loci sequence diversity was quite low (table 2). Future studies should take advantage of the recently published U. diaspidicola genome (Sabree et al., Reference Sabree, Huang, Okusu, Moran and Normark2013) to target endosymbiont loci with comparable levels of genetic diversity to developed host loci when making species level comparisons for this or other groups of armored scales.
The co-evolutionary arms race between plants and herbivores has long been hypothesized to be one of the driving forces of speciation in insects through the creation of new adaptive zones (Ehrlich & Raven, Reference Ehrlich and Raven1964), though what role endosymbionts play in shaping patterns of plant–host use remains unclear. The recent sequencing of the U. diaspidicola genome (Sabree et al., Reference Sabree, Huang, Okusu, Moran and Normark2013) confirms the importance of this primary endosymbiont for providing essential amino acids and performing nitrogen recycling, and also suggests that U. diaspidicola has a relationship with its armored scale hosts similar to that seen between aphids and Buchnera aphidicola. Given this importance, we expected to see phylogenetic patterns between U. diaspidicola (and its host species of Chionaspis) and the plant hosts in the genus Pinus from which it was collected. However, even when we examined plant–hosts classified at the sub-genus level (fig. 4) we detected no discernable plant and insect/endosymbiont associations. Though contrary to our expectations, this lack of associations between the primary endosymbiont and plant–hosts is similar to the recent results of Toju & Fukatsu (Reference Toju and Fukatsu2011). Interestingly, though the authors found no plant–host associations with the primary endosymbiont of the chestnut weevil, they did find highly significant associations between several secondary endosymbionts and plant–hosts, suggesting that secondary endosymbionts may play a more important role than primary endosymbionts in the creation of new adaptive zones.
In contrast to the plant–hosts findings, we did find clear evidence of biogeographic associations (fig. 3). These results are similar to those found in aphids (Liu et al., Reference Liu, Huang, Zhang, Jiang and Qiao2013) where the geographical patterns were visible in both the host and endosymbiont phylogenies. Our results indicate that species in the C. pinifoliae–C. heterophyllae species complex can be divided into three broad geographic regions: eastern United States, including C. heterophyllae, all members of species S7, and one member of species S10; Mexico, including all members of species S2 and S4; and western United States and Baja California, including all members of species S6, S8, and all but one individual of species S10. These patterns were nearly identical between host and endosymbiont phylogenies, however they differed in that the endosymbiont phylogeny reconstructed Mexico as the region of origin for species S2–S10, with a single expansion into the western United States and Baja California, followed by at least one subsequent expansion into the eastern United States, whereas the ancestral relationships in the host phylogeny were unresolved.
In conclusion, we found that sequence data from U. diaspidicola and from its hosts in the C. pinifoliae–C. heterophyllae species complex show patterns of co-diversification similar to those previously observed between U. diaspidicola and its hosts at the family-level suggesting that co-diversification among armored scale insects and U. diaspidicola may be occurring at the species level.
Acknowledgements
We thank Gord Burke, Jason Cryan, and Julie Urban, and four anonymous reviewers for valuable comments that improved this manuscript. For financial support we wish to thank Dr Robert Light and the Penn State Erie, The Behrend College undergraduate research grants. We also thank. K. Foust and A. Doolittle for their laboratory assistance. M. Gruwell would like to personally thank S. Gruwell for support. The authors declare no conflict of interest.