INTRODUCTION
The growth trajectory of animals is conditioned by the interaction of genetic growth potential with environmental factors. Although nutrition is the most important environmental factor impinging upon growth, most studies on growth, especially in livestock species, have focused on quantitative genetic approaches to the estimation of genetic parameters of growth curves to be employed in selection programmes, thereby eliminating any consideration of nutritional environment. One notable exception is conveyed by Parks (Reference Parks1982), who attempted to consider explicitly the nutritional environment in the development of mathematical models of growth.
Brody (Reference Brody1945) considered that the inflection point of the growth curve coincides with the onset of puberty. This assertion was based on modelling growth data from various species with a non-linear model that divided growth into two distinct phases: (1) the self-accelerating (pre-pubertal) phase and (2) the self-inhibiting (post-pubertal) phase. The equation for the post-pubertal phase is:

This form can be transformed by starting to begin to count t from the point where this curve intersects the x-axis (t*):

where W denotes body mass, A is asymptotic body mass, t is age or time, and B and k are parameters. Brody (Reference Brody1945) discussed various approaches to the determination of the point of inflection in the mathematical concept of growth. It cannot be derived directly because the definition leaves the growth curve undefined (discontinuous) at the point of inflection. The Brody concept has been applied to modelling growth curves employed in bio-economic production system simulation models (e.g. Blackburn & Cartwright Reference Blackburn and Cartwright1987) by supplying estimates of the point of inflection. In some applications (Doren et al. Reference Doren, Baker, Long and Cartwright1989), this was simply achieved by imposing a domain restriction based on minimum age of 1 year beyond which the Brody curve was used to model growth. The required estimates of age at onset of puberty (in the absence of endocrine data) can be derived using least-squares curve-fitting with growth functions which possess a point of inflection assuming that the derived value would be equivalent to the point at which puberty occurs. This estimate can then be used to constrain the parameters of the body function.
Even outside the realm of mathematical modelling of growth, puberty serves as a time anchor for delineating a principal change in the composition of gain. Blaxter (Reference Blaxter1989) discussed the issue of changing enthalpy of gain and concluded that allometric relationships suggesting a continuously increasing proportion of fat mass in gain (and correspondingly, a decreasing proportion of protein) are not correct if fitted to gain and composition data across the entire development phase. Blaxter (Reference Blaxter1989) maintained that, from puberty onwards, fat mass proportion of gain remains constant (i.e. having reached maximum value at puberty) and that the increase in empty body fat proportion is due to successive additions of relatively fat-rich tissue; this issue appears to be far from resolved, however. NRC USA (1996/2000) and INRA (2007), for example, published tables accounting for an increasing proportion of fat in gain in beef cattle across the entire growth period. Nevertheless, the literature, including Brody (Reference Brody1945) and Blaxter (Reference Blaxter1989), appears to suggest that, at puberty, a principal change in body composition occurs. This change should theoretically be reflected in a conspicuous feature of the weight–age relationship; hence the appeal of growth curves with an inflection point.
A study systematically examining the relationship between growth curve parameters and the age at onset of puberty as determined by endocrine parameters seems to be lacking. Several questions are of interest. First, does onset of puberty coincide with maximum growth rate? Second, can data on growth and body composition contribute to more meaningful hypotheses about the role of body composition v. degree of development (maturity)? Third, how do genetic group and nutritional treatment influence parameters of growth curves and the relationship between age at maximum growth rate and age at onset of puberty? Fourth, at what stage of maturity do growing female sheep reach puberty?
Accordingly, there is a need for further research on how genotype and environmental effects impinge upon the parameters of mathematical models describing these physiological processes, and how they relate to events of biological significance, such as the establishment of reproductive competence.
Following the discovery of leptin, considerable research has led to the current consensus that this hormone acts as a permissive signal in the onset of puberty, communicating the availability of energy reserves (i.e. adiposity) ‘sufficient’ for reproduction (Sisk & Foster Reference Sisk and Foster2004). Accordingly, it was hypothesized that:
(a) Puberty cannot occur before or at the point of inflection because the amount of body fat appears to significantly increase only past the point of maximal growth, i.e. point of inflection;
(b) Irrespective of nutritional regimen, the inflection point of the growth curve must occur at a younger age than the onset of puberty;
(c) Nutritional regimens altering the shape of the growth curve also affect age and degree of maturity at the onset of puberty.
Previous studies have presented data that suggest that the inflection point of the growth curve occurs before puberty (e.g. Menchaca et al. Reference Menchaca, Chase, Olson and Hammond1996); however, it appears that a systematic analysis has not been attempted previously.
MATERIALS AND METHODS
Animals, diets and animal management
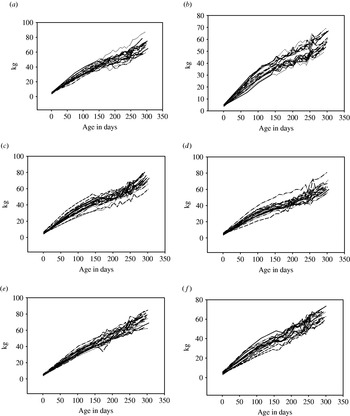
All USA experiments were carried out at the Sheep Experiment Station, Dubois, Idaho, with the approval of the institutional Animal Care and Use Committee. A detailed description of experimental procedures and measurements is provided in Pittroff et al. (Reference Pittroff, Keisler, Lavoie, Souffrant and Metges2003). Briefly, a total of 135 ewe lambs were selected at random from two closed genetic lines of Targhee sheep. One line has been selected since the mid 1950s for total weight of lamb weaned (designated TWLW). The other line is a random mating control line (RMCL), continued from the same original stock. The average age of the experimental animals at the beginning of the experiment was 149±0·6 days. The average weight was 43±4·6 kg for TWLW animals and 38±4·3 kg for RMCL animals. On average, there were 3–4 weight measurements taken for each animal prior to the commencement of experimental feeding available for each animal. Lambs within lines were allocated at random to three nutritional treatments. Treatment CONTROL (chopped alfalfa hay ad libitum and c. 250 g barley/hd/d) is the normal diet fed to ewe lambs at the station after weaning (n=16 for line TWLW and n=18 for RMCL). Treatment LEAN (n=17 for TWLW and n=18 for RMCL) was a pelleted ration fed ad libitum and designed to maximize growth and development with an energy concentration of 9·83 MJ metabolizable energy (ME)/kg dry matter (DM) and a crude protein (CP) content of 203 g/kg. Treatment FAT (n=19 for TWLW and n=18 for RMCL) was a pelleted ration fed ad libitum in order to provide an energy surplus while protein-limiting lean growth, with an energy concentration of 12 MJ ME/kg ME and 79 g CP/kg. The two experimental diets LEAN and FAT were designed to achieve the largest possible difference in growth trajectories between treatment groups. Figures 2a–f depicts the growth trajectories for all animals.
The two French experiments (Blanc et al. Reference Blanc, Fabre, Bocquier, Canepa, Delavaud, Caraty, Chilliard and Debus2006) were carried out at the Frejorgues experimental farm, INRA, Montpellier. At weaning (12 weeks of age), a total of 20 (Expt 1) and 16 (Expt 2) Merino ewe lambs were randomly allocated to experimental groups of similar ages, weights, body condition scores (measured on a scale of 1=emaciated to 5=obese) and pre-weaning growth rates. From the 12th to the 37th week of age, ewes from Expt 1 were allocated at random to one of two nutritional treatments HIGH (HH) and MEDIUM (MH1). Treatment HH (n=10) was fed ad libitum a diet composed of dried beet pulp (500 g/kg), dehydrated alfalfa meal (400 g/kg) and straw pellets (100 g/kg) with an energy concentration of 9·5 MJ ME/kg DM and a CP concentration of 121 g/kg DM. Treatment MH1 (n=10) differed from the HH treatment only by the amount of feed offered (0·70 of the amount of group HH). From the 38th week of age onwards, groups HH and MH1 were both fed ad libitum. Ewes on Expt 2 were allocated to the treatments M1 (n=8) and M2 (n=8). They were fed, from the 12th to the 37th week of age, diet MH1 as in Expt 1, but the amount of feed given to both groups was adjusted each week to position animals onto a growth similar to group MH1 in Expt 1. From the 38th week of age, diets of group M1 and M2 differed. Group M1 was fed a diet of extruded soy beans (180 g/kg), dried sugar beet pulp (640 g/kg) and straw pellets (180 g/kg DM), whereas group M2 was fed barley (400 g/kg), dried beet pulp (250 g/kg), dehydrated lucerne meal (100 g/kg), rumen protected soybean meal at 80 g/kg (1% formaldehyde treatment at low temperature, 480 g CP/kg) and straw pellets at 170 g/kg. These diets had similar energy concentrations (11·1 MJ ME/kg DM for M1 v. 10·6 MJ ME/kg DM for M2) and were also isoproteic at 134 g CP/kg DM). No differences in any of the response variables studied were found for the two groups (M1 and M2) and consequently, they were combined into one treatment designation MH2 with a total of 16 ewe lambs.
Sample collection and laboratory assays
Animals were weighed once weekly always at the same time before feeding in both experiments. All available weights from birth until the termination of the experimental feeding were included in the analysis. Blood samples were collected twice-weekly prior to feeding by jugular venipuncture using K3 EDTA as an anticoagulant. After centrifugation, plasma samples were frozen for later analysis. Progesterone was assayed with a commercial kit (Diagnostics Products Corporation) for the U.S. samples, and by a radio-immunological assay (Terqui & Thimonier Reference Terqui and Thimonier1974) for the French samples. Two threshold levels of progesterone (age at first observation of circulating progesterone ⩾0·5 ng/ml, AOP1 and age at first observation of progesterone ⩾1·0 ng/ml, AOP2) were used to define the onset of puberty. Although, both reference levels can be found in the literature (see Keisler et al. Reference Keisler, Inskeep and Daily1983), no consensus as to what level is the most appropriate indicator of onset of puberty seems to have been achieved.
Data analysis
On average, there were 23 weight data points available for each animal, starting with birth weight. Growth models were fitted for the individual growth trajectory of each animal, not on group averages. This is a classical repeated measures problem, requiring the consideration of the effect of correlated measures (taken on the same individual) on parameter estimates and associated standard errors by mixed model maximum likelihood analysis (Pinheiro & Bates Reference Pinheiro and Bates1995; Littell et al. Reference Littell, Henry and Ammerman1998). Accordingly, data analysis was performed in several steps: (a) non-linear regression analysis of the age–weight dataset for each animal to derive starting values for non-linear mixed model analysis; (b) mixed model analysis of growth data with a set of appropriate non-linear growth models, comparison of parameter estimates obtained, and choice of best fitting model based on regression diagnostics and biological considerations; (c) examination of effect of unequal measurement spacing on parameter estimates and (d) multivariate linear model analysis of growth curve parameters estimated with the overall most appropriate growth model, using the most appropriate fitting algorithm.
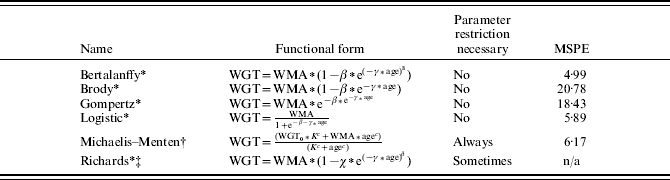
First, in order to derive starting values for the mixed model-maximum likelihood analysis, several models (Table 1) were fitted with SAS Proc NLIN (SAS 2004), using the default ordinary least squares (OLS) Gauss–Newton algorithm. The selection of models was based on the availability of comparable studies in the literature employing these functional forms. The Brody model does not possess an inflection point, and thus would not have allowed challenging Brody's law directly, but was included in order to allow the assessment of the inflection point models in terms of fitting properties vis-à-vis this function, often considered superior for growth modelling. This exploratory analysis was only performed on the Dubois data set.
Functional forms and regression diagnostics of non-linear models examined
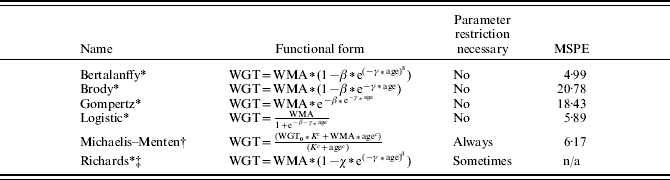
* WGT denotes weight, WMA mature weight, β and γ are parameters.
† WGT0 denotes initial (birth) weight, K and c are parameters.
‡ δ denotes a shape parameter.
For the mixed model analysis, the choice of parameters with which to associate a random effect was based on the standard errors of parameter estimates from the non-linear OLS regression estimates. The only parameter that suggested the need for representation as a ‘mixed effect’ was estimated asymptotic mature weight (WMA). The starting value for the variance of the random effect (additive to WMA) was estimated based on the standard deviation of WMA estimated by the procedure NLIN. Every model in Table 1 was fitted to the weight–age dataset of each individual animal.
Regression diagnostics were used to examine fitting properties of the models used in the mixed model analysis. Three properties were used in model evaluation: (1) the R 2 value, calculated as: 1−RMS/s y2, with RMS denoting residual mean square and s y2 being the total variance of the dependent variable, weight; (2) mean square prediction error (MSPE, Dhanoa et al. Reference Dhanoa, Lister, France and Barnes1999), determined as:
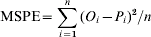
where i=1, 2, … , n is the number of experimental observations, and O i and P i are observed and predicted values, respectively. The square root of this diagnostic was expressed as percentage of the observed overall mean, providing an index of overall error of prediction. Finally, an evaluation of biological plausibility of model parameters, with emphasis on asymptotic mature weight was conducted.
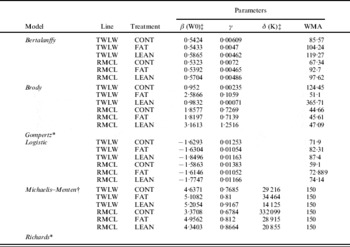
The model providing the best fit by regression diagnostic criteria in the majority of cases was the von Bertalanffy model. Unfortunately, this model considerably over-estimated asymptotic weights (denoted WMA). The final estimates were not consistent with recorded mature weights for the genetic lines in the current experiments. The Logistic model appeared to possess the best combination of low MSPE and realistic parameter estimates. WMA values estimated with this model were consistent with observed values and no parameter constraints had to be set for the model to converge and produce these values. The formulation of the Logistic function chosen has consistently low parameter-effects non-linearity, associated with low bias (Ratkowsky Reference Ratkowsky1983). Ratkowsky (Reference Ratkowsky1983) offered a concise and pragmatic interpretation of the parameters of this function, with β determining the intercept on the y-axis, γ being related to the rate at which the weight changes from its initial value (as determined by β) to the asymptotic weight, WMA, or in other words, the intrinsic rate of change. Conversely, the generalized Michaelis–Menten function described by Lopez et al. (Reference Lopez, France, Gerrits, Dhanoa, Humphries and Dijkstra2000) consistently required enforcing parameter constraints (especially WMA) in order to yield estimates within the biologically reasonable domain. Despite parameter restriction, estimated mature size was always over-predicted. Moreover, the model failed to converge for many individual animal data sets. The results of the fitting process for the various models, using the mixed model-maximum likelihood algorithm of Proc NLMIXED (SAS 2004) with various growth functions for the Dubois observations are summarized in Table 2.
Parameter estimates for Dubois observations estimated with a mixed model maximum likelihood estimation – averages for Line-Treatment combinations

* Model could not be successfully fitted due to failed grid search.
† Mature weight bound at <150 kg – bound enforced.
‡ Parameter names in brackets apply to Michaelis–Menten model.
The results of the mixed model analysis indicated that parameter estimates of growth curves for individual animals are indeed affected by the appropriate consideration of correlations within individuals. However, another critical issue to be considered in fitting weight–age relationships is the effect of unequal spacing of observations on the time (age) axis. Gates & Dahm (Reference Gates, Dahm and Koonce1989) developed an algorithm employing the Orstein–Uhlenbeck error process to fit correlated growth data measured at unequal intervals. The assumptions underlying this approach are described as follows. Let εtj represent the deviation of expected growth from observed growth at time t j, or  (with f being the predicted value). Then, for the n observations on animal i the following are assumed:



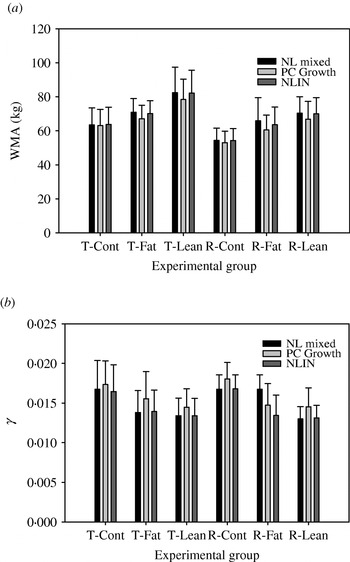
This algorithm is implemented in the computer package PC Growth and available from the Department of Statistics at Texas A&M University. Estimates for growth curve parameters (see Results, Figs 1a and b) differed appreciably between estimation methods. Based on theoretical considerations, the approach proposed by Gates & Dahm (Reference Gates, Dahm and Koonce1989) was chosen to fit the Logistic model to each individual animal growth data set. Unfortunately, the algorithm did not converge for four animals from the French data set. Parameters for these animals were estimated by the nonlinear mixed model approach described above.
(a) Estimates of mature size WMA by different algorithms. (b) Estimates of intrinsic growth rate γ by different algorithms. NL mixed: mixed model – maximum likelihood estimation, PC Growth: Ornstein–Uhlenbeck algorithm estimation, NLIN: OLS Gauss–Newton estimation.

Considerable between-animal variation had to be expected and was indeed observed. In fitting growth curves outliers can have considerable impact on estimated parameters. The consideration of correlated observations, unequal spacing of measurements, and robust fitting (whose combined effects may not be satisfactorily addressed fully by available algorithms) suggest the need for careful interpretation of growth curve parameters in general. However, the generally good fit of the Logistic equation to the data presented here appears to justify the determination of the point of inflection of the growth curve for each animal by generating data with the Logistic function parameterized with the estimates derived for each individual. The point of inflection was determined as the age when the second derivative (parameterized for each individual) of the Logistic function intersected the x-axis. Existence of the necessary condition of sign change (f″ (x−ε) and f″ (x+ε) having opposite signs) was verified. The curve-analytical package Table Curve 2D (Systat Inc. 2002) was used for that purpose.
The parameters estimated by fitting a growth curve reduce, in effect, weight–age trajectories to a single low-dimensional multivariate observation, which is amenable to linear modelling (Rodda Reference Rodda and Endrenyi1981). Accordingly, the parameter estimates for each individual animal were analysed with MANOVA models separately for the French and US experiments (nutritional treatments and genetic groups were not cross-classified between the two sites). Fixed effects of genetic group and nutritional treatment (US data) and nutritional treatment (French data) were evaluated for growth curve parameters and other response variables described below. A value of P⩽0·05 of the Hotelling–Lawley Trace statistic was assumed to indicate overall significance of an effect considered in the multivariate model. Univariate tests were pursued only when the multivariate test indicated overall significance for dependent variables significantly correlated with each other. If the multivariate analysis did not reveal significant correlations among the dependent variables, univariate tests were examined regardless of the significance of the Hotelling–Lawley Trace. The present authors point out that nature and magnitude of the observed correlations must be expected to have both biological and (growth) model-immanent components, i.e. are in part conditioned by mathematical properties of the growth model. In other words, the specific observed correlation coefficients cannot be explained by purely biological considerations.
The estimates of mature size for each animal were used to analyse the relationship between stage of maturity and onset of puberty. Degree of maturity (DOM1 for AOP1 and DOM2 for AOP2) was expressed as a proportion of weight (measured at the age when either of the two progesterone threshold levels was reached) of individually estimated mature size (WMA). These proportions were normalized by the arcsine-square root transformation prior to analysis. When weighing dates and dates of blood sampling were not identical, weight data were linearly interpolated, which appeared justified due to generally very short distances between these time points. A MANOVA analysis modelling AIP, DOM1 and DOM2 as dependent variables and the fixed effects of genetic group, treatment and their interaction as independent variables was applied. Further, the correlation pattern between age at inflection point and age at the two threshold progesterone levels was analysed by modelling AIP, AOP1 and AOP2 as dependent variables in a multivariate model with genetic group, treatment and their interaction as fixed factors. Significance of effects was ascertained as before. The relationships between degree of maturity (DOM1 and DOM2) and age at onset of puberty (AOP1 and AOP2) were examined in a similar multivariate approach with treatment and genetic group as fixed factors. The effect of genetic group could only be evaluated for the USA experiment.
For all univariate analyses for the US data, means separation was by simultaneous multiple comparison with a Tukey–Kramer adjustment for family-wise error (FWE) rate. This procedure tested for simple effects even though interactions between nutritional treatment and genetic group were not significant. While objections have been voiced against multiple comparisons, it is maintained that, in the current case of exploratory analysis, exhaustive sliced-effect type comparisons of simple effects are warranted, and indeed protected by very conservative adjustments for FWE.
RESULTS
Figures 2a–f depicts the growth trajectories of all animals in the US data set. Of the mathematical models examined, the Logistic function was the superior model in fitting all data sets. This superiority emerged regardless of the approach used in fitting the data. However, the estimation approach affected parameter estimates. In order to illustrate the effect of algorithm on estimates, Figs 1a and b summarize the means and standard errors for estimated WMA and γ for each of the genetic group-nutritional treatment groups of the US data according to estimation method (non-linear OLS, NLIN, maximum likelihood mixed model estimation (NLMIXED), and PCG, Orstein–Uhlenbeck correlated error process estimated by maximum likelihood).
(a) TWLW Treatment CONTROL. (b) RMCL Treatment CONTROL. (c) TWLW Treatment FAT. (d) RMCL Treatment FAT. (e) TWLW Treatment LEAN. (f) RMCL Treatment LEAN.

US data
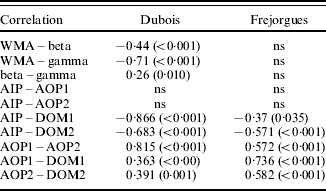
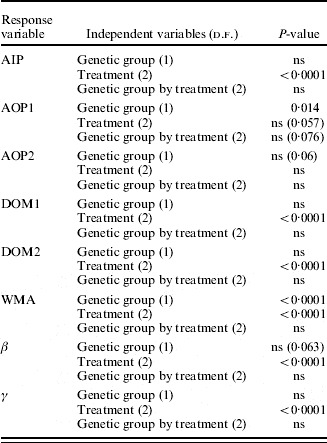
Correlations between parameters of the growth curve model were highly significant and moderately to fairly strong (Table 2). In the MANOVA model for the growth curve parameters, genetic group and nutritional treatment, but not their interaction, were highly significant. Univariate tests identified genetic group and nutritional treatment as highly significant factors for estimates of WMA (both P<0·0001). Genetic group approached significance for estimates of β (P=0·06; nutritional treatment was highly significant for this parameter (P<0·0001). Genetic group did not significantly affect γ; however, nutritional treatment was a highly significant factor for this parameter.
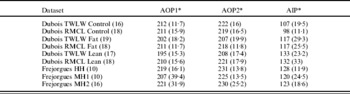
All animals reached AIP significantly before AOP1 (Table 3). Averaged across treatments, the minimum difference was 89 days.
Comparison of age at onset of puberty (AOP, see text) with age at the inflection point of the growth curve (AIP)

* Age in days.
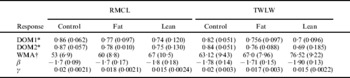
There was no correlation between age at the inflection point of the growth curve (AIP) and the two threshold ages considered as endocrinological indicators of onset of puberty (Table 4). However, AOP1 and AOP2 were highly correlated (Table 4). Nutritional treatment, but not genetic group was highly significant in the multivariate model for these response variables. Results are presented in Table 5. The results of the univariate simple effect tests are summarized in Table 6. Genetic group had no effect on AIP, whereas nutritional treatment was highly significant. On the other hand, genetic group had a significant effect on AOP1 (but not on AOP2, despite the highly significant correlation among the two). Nutritional treatment tended to affect AOP1 significantly (P=0·057), and the interaction between genetic group and nutritional treatment approached significance at P=0·076. Treatment LEAN advanced AOP1 in the high growth/weaning weight line TWLW, but not in the control line RMCL. Thus, a nutritional treatment that advances age at onset of puberty may have this effect only in a genetic line expressing high growth potential. Pittroff et al. (Reference Pittroff, Keisler, Lavoie, Souffrant and Metges2003) observed that pregnancy rates of the same group of experimental animals seemed to be more closely related to body fatness than to age at onset of puberty.
Correlation among response variables estimated by partial correlation analysis (P values in parentheses)
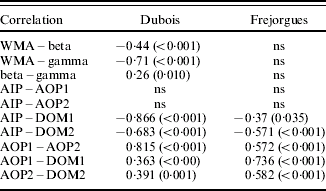
ns=not significant.
Response variables (raw means and standard deviations) for genetic lines and treatment groups for the Dubois data

Values are raw means and standard deviations. Units are * proportion, † kg.
Summary of statistical analyses of response variables

The correlations between AIP and DOM1 and DOM2 were very high and highly significant (Table 4). The Hotelling–Lawley Trace did not indicate any significant overall genetic group effect, but was highly significant for the effect of nutrition. Genetic group was not significant for either DOM1 or DOM2; however, nutritional treatment was highly significant (P<0001). Table 5 lists the results of the univariate tests for these variables.
France data
Only WMA was significantly affected by nutritional treatment (P<0·001). There was no significant effect of nutritional treatment on β, γ, AOP1, AOP2, AIP, DOM1 or DOM2. No significant correlations were found among the parameters of the growth model, highlighting the fact that only limited biological meaning should be attributed to these correlations. AOP1 and AOP2 were significantly correlated at r=0·57 (P<0·001). DOM1 was significantly correlated with DOM2 (r=0·74 and P<0·001), AOP1 (r=0·74 and P<0·001) and AOP2 (r=0·4 and P=0·022). AIP was not related to either AOP1 or AOP2. DOM2 and AOP2 were correlated with r=0·58 (P<0·001). As summarized in Table 3, AIP occurred significantly before AOP1 and AOP2, similar to the US data. Averaged across treatments, AIP occurred 94 days before AOP1.
DISCUSSION
The formulation of the Logistic function employed in the current paper has an inflection point in correspondence with Brody's assertion of the existence of an inflection point of the growth curve. However, this inflection point is fixed at 0·50 of asymptotic weight. Brody (Reference Brody1945) stated that typically the inflection point would be reached at between 0·30 (laboratory and farm animals) and 0·60 (primates) of mature weight. West et al. (Reference West, Brown and Enquist2001) presented a general model for (species-independent) ontogenetic growth, which has a fixed inflection point at approximately 0·33 WMA. Accordingly, the use of the Logistic function possibly overestimates the (biologically) ‘true’ inflection point for farm animals. Further, typical for weight–age data sets collected in extensive sheep production systems, more data points were available after weaning than before. Although this may have an effect on parameter estimation, residuals were higher for the first four measurements (on average prior to AIP) than for subsequent weight values. The present results confirm earlier reports identifying the Logistic model as particularly useful for modelling growth-age data in plants and animals (Grossmann & Bohren Reference Grossmann and Bohren1985; Niklas Reference Niklas1994). On the other hand, the two functions allowing parametric control of the inflection point included in the present evaluation (the Richards equation and the Michaelis–Menten function described by Lopez et al. Reference Lopez, France, Gerrits, Dhanoa, Humphries and Dijkstra2000) either consistently did not converge, or produced biologically unrealistic parameter estimates. Schinckel & de Lange (Reference Schinckel and De Lange1996) elaborated on the need to consider growth models allowing flexible estimation of the point of inflection, but also discussed the specific convergence problems typically observed in parameter estimation with these functions. However, the need for flexible inflection points may be much more important when estimating parameters of true protein accretion curves, which was the goal of these workers. It could of course be argued that inflection point is a parameter, and as such it is an individual trait just like the onset of puberty. Accordingly, if that parameter cannot be freely estimated, there is no point in deriving a relationship between onset of puberty and a fixed inflection point. However, although the inflection point cannot be estimated independently of mature size, it is a constant function of mature size in the formulation the Logistic model employed here and as such treated implicitly as an individual characteristic. Current theory posits that, biologically, onset of puberty must have an allometric relationship with mature size. Having an inflection point that is a function of mature size and does not express any correlation with age at onset of puberty argues therefore against the hypothesis that there is a functional relationship between the two. This is the argument that the present authors wish to assert. Accordingly, it is maintained that, despite the limited degrees of freedom provided by the Logistic model, the present data demonstrate that no functional relationship exists between onset of puberty and the inflection point of growth. The high correlation between AIP and DOM1 and DOM2 is in part attributable to the fact that the Logistic function fixes the inflection point at half of mature size. Conversely, this high correlation may also imply that degree of maturity and growth stage play a key role in onset of puberty in the sense that a certain minimum weight (corresponding to a certain minimum degree of development) must be reached.
This result would agree with Suttie et al. (Reference Suttie, Foster, Veenvliet, Manley and Corson1991). However, the highly significant effect of nutritional treatment, and the absence of an effect of genetic group, clearly illustrate that the degree of maturity that must be reached for reproductive competence to be achieved is strongly influenced by nutritional treatment. As such, significant effects of body composition are likely. The estimates of AOP1 and AOP2 (Table 5) suggest that only AOP2 values are comparable to those found by Dickerson & Laster (Reference Dickerson and Laster1975), which is the only reference that could be found for Targhee sheep. Those authors estimated mean age at puberty for Targhee at 231±7·5 days (after adjustment for a right-censored data set, which was not necessary for the current experiments). Dickerson & Laster (Reference Dickerson and Laster1975) used age at first observed oestrus as their criterion for onset of puberty.
The highly significant effect of nutritional treatment on all growth curve parameters demonstrates that the nutritional treatments in the US experiments created clearly distinct growth trajectories for both genotypes; however, the absence of interaction between nutrition and genetic group suggests that regardless of growth potential all animals responded to nutritional treatments in a comparable fashion. The independence of treatment and genetic group effects for growth curve parameters contrasts with the indication of interaction between these factors for AOP1. Interestingly, Dickerson & Laster (Reference Dickerson and Laster1975) stated that pre-weaning growth handicap (e.g. imposed by litter size) appeared to reduce weight at puberty proportionally more than it delayed age at puberty. This is interpreted as evidence suggesting that age–weight relationships per se are not sufficiently informative indicators of age at puberty. Furthermore, Dickerson & Laster (Reference Dickerson and Laster1975) also found an important genetic effect related to prolificacy, with Finn crosses reaching puberty typically earlier than non-prolific sheep. This observation suggests that growth rate and litter size potential may have complex interactive effects on onset of puberty. It should be recalled that the line in which nutritional treatment for maximum growth advanced age at puberty most was the line selected for TWLW, i.e. selected for both increased litter size and growth.
Observations from related studies in beef cattle seem to be pertinent. For example, Laster et al. (Reference Laster, Smith and Gregory1976) observed that heterosis effects in Angus×Hereford crosses advanced age at puberty by 19·5 days with no effect on weight. They also concluded that physiological maturity is influenced by genetic variation within a breed.
CONCLUSIONS
The current analysis suggests that there is no relationship between parameters of the growth curve and physiological indicators of onset of puberty, in disagreement with the Brody Law stating a functional relationship between point of maximum growth and onset of puberty. Current results provide evidence that onset of puberty occurs much later than the inflection point of the growth curve, suggesting effects of body composition and minimum weight threshold. The plasticity of responses caused by nutritional treatments invites further research elucidating the specific function of body composition in the onset of puberty. Clearly, the use of mathematical growth models to identify physiological thresholds such as onset of puberty does not seem to be indicated. Modelling growth of animals for which physiological threshold data are available, on the other hand, may provide increased information on growth model parameter estimates. New approaches to the functional mapping of putative quantitative traits loci (QTL) for traits measured repeatedly over the life cycle, such as growth, may further stimulate renewed interest into the quantitative analysis of growth. Ma et al. (Reference Ma, Casella and Wu2002) presented a theoretical framework for modelling such continuously evolving traits as a ‘character process’, in which measurements taken at subsequent ages are considered as a multivariate trait vector. Different genotypes of a putative QTL may create different combinations of the parameters of the growth model used to map discrete measurements into a continuous character process. This approach promises to overcome the limitations of treating infinite-dimensional characters (measured as discrete manifestations) as discrete traits while disregarding the underlying physiological processes that create phenotypic variation. However, it obviously requires a sound quantitative (in the case of growth) growth model for the character process, and it should be informed by endocrinological data mirroring the interaction of the character process with the environment.