I. INTRODUCTION
In last few decades, rare earth compounds have been extensively studied for their practical and potential applications.Reference Wang and Liu1–Reference Liang, Chang, Chang and Wu4 Among them, the fluorides are now receiving wide attention owing to the low-frequency phonons usually observed in their crystal lattices as well as in their thermal and environmental stabilities.Reference Li and Lin5, Reference Diamente, Raudsepp and van Veggel6 The fluoride host materials with the composition MGdF4 (M = Li, Na, or K) are of particular interest.Reference Wegh, Donker, Oskam and Meijerink7–Reference He, Yang, Wang, Niu, Gai and Li11 Recently, the RE3+ doped KF–GdF3 system has received more attention due to both its structural and optical properties.Reference Lee, Luo, Diau, Chen, Cheng and Tung12–Reference Du, Zhang, Sun and Yan15 In addition, Gd3+ is an ideal paramagnetic relaxation agent used in magnetic resonance imaging.Reference Kumar, Nyk, Ohulchanskyy, Flask and Prasad16, Reference Park, Kim, Lee, Jeon, Na, Yu, Kim, Lee, Choi, Baik, Kim, Park, Park, Kim, Lee, Yoon, Song, Moom, Suh and Hyeon17 Therefore, the RE3+ doped KF–GdF3 system is very attractive to produce single phase multifunctional materials.
Researchers have developed various synthetic strategies for the synthesis of reproducible and controllable materials. Especially, high-quality (such as monodisperse, single-crystalline, well-shaped, and phase-pure) fluorides have been fabricated successfully due to their potential applications in biology and medicine.Reference Karvianto and Chow18–Reference Wang and Peng20 As a typical solution approach, the hydrothermal treatment has been proven to be effective and convenient in preparing various inorganic materials with diverse controllable morphologies and architectures.Reference Liang, Peng, Wang, Zheng, Wang, Qiu, Nan and Li21 In addition, the hydrothermal method is relatively simple, mild, easy, and green to produce a large amount of products; therefore, the hydrothermal route is often adopted to synthesize fluoride host materials. In the hydrothermal synthesis, there are a lot of factors to control such as reaction temperatures, reaction time, pH values of precursor solutions, reactant ratios of raw materials, and organic additives in addition to the intrinsic structures of samples. In this article, we mainly study the effects of the reactant ratios on the crystalline phases and optical properties of final products. And we select citric acid as an organic additive or surfactant in all the synthesis procedures, which can modify the morphology and the size of final products.
There have been few studies on the KF–GdF3 system submirco/nanocrystals synthesized based on the hydrothermal method.Reference Yang, Zhang, Li, Li, Zhong and Chu13, Reference Cao, Yang, Chung, Moon, Choi, Jeong and Kim14 Moreover, the energy transfer (ET) from Ce3+ to Tb3+ has been investigated in many phosphors.Reference Huang, You, Jia, Song, Zheng, Yang, Liu and Guo22–Reference Guo, Zhang, Li and Li25 By lanthanide doping or alkaline earth doping,Reference Wang, Han, Lim, Lu, Wang, Xu, Chen, Zhang, Hong and Liu26–Reference Chen, Yu, Huang and Wang28 the researchers have realized the phase transition in some fluorides. In this article, by controlling the amount of KNO3, the Ce3+/Tb3+ codoped cubic phase KGdF4 samples evolve from the Ce3+/Tb3+ codoped orthorhombic phase GdF3. In the preparation, we find that the concentration of Ce3+ has great effects on the crystalline phases of the final products. The Ce3+ concentration dependent series of samples are also synthesized. Further, the optical properties of the final obtained products are compared and studied.
II. EXPERIMENTAL PROCEDURE
The samples were synthesized through a citric acid-assisted hydrothermal method. The raw materials Gd2O3 (99.9%, Sigma-Aldrich, St. Louis, MO), Tb2O3 (99.99%, Sigma-Aldrich, St. Louis, MO), Ce (NO3)3·6H2O (99.99%, Sigma-Aldrich, St. Louis, MO), KNO3 (99.99%, Sigma-Aldrich, St. Louis, MO), citric acid (99.5+%, Sigma-Aldrich, Tokyo, Japan), and NH4F (≥98%, Sigma-Aldrich, Munich, Germany) were all purchased from Aldrich and used directly without further purification. The Gd (NO3)3 (0.5 M) and Tb (NO3)3 (0.02 M) stock solutions were prepared by dissolving the corresponding RE2O3 in nitric acid at elevated temperatures. Two millimoles of stoichiometric RE (NO3)3, 12 mmol of KNO3, and 4 mmol of citric acid were dispersed into deionized water to form a 25 mL of clear solution by stirring. After vigorously stirred for 20 min, a 25 mL of aqueous solution containing 12 mmol of NH4F was introduced into the solution. After stirring for another 15 min, the as-obtained solution was transferred into a 70-mL Teflon bottle held in a stainless steel autoclave, sealed, and maintained at 180 °C for 24 h. After the autoclave cooled down to room temperature naturally, the precipitates were collected by centrifugation, washed with ethanol and deionized water, and then dried in air at 60 °C for 24 h. In this article, the amounts of KNO3 and Ce (NO3)3·6H2O were adopted to study the phase transformation and the optical properties of final products. For simplicity, the 5 mol% Tb3+ and 10 mol% Ce3+ codoped samples synthesized with 0, 200, 400, and 600 mol% KNO3 (corresponding the total amounts of RE3+) are signed as K0, K200, K400, and K600, and the samples (fixed 5 mol% Tb3+ and 400 mol% KNO3) synthesized with 5, 10, 20, 30, 40, 50, 70, and 95 mol% Ce3+ are labeled as Ce5, Ce10 (K400), Ce20, Ce30, Ce40, Ce50, Ce70, and Ce95, respectively. For comparison, the sample Ce0 was also synthesized with 400 mol% KNO3 and without Ce3+/Tb3+ (100 mol% Gd3+) doping.
The crystalline structures of obtained samples were characterized by x-ray diffraction (XRD) patterns using a Philips X’Pert/MPD system (Eindhoven, Netherlands) with CuKα (λ = 1.54056 Å) radiation at 40 kV and 30 mA. The 2θ ranges of all the datasets are from 10 to 80° with a step size of 0.02°. Field emission scanning electron microscopy (FESEM) images were taken on a JEOL JSM-6700F (Tokyo, Japan) scanning electron microscope. The photoluminescence (PL) excitation and emission spectra were recorded using a Photon Technology International (PTI, Birmingham, NJ) fluorimeter with a xenon-arc lamp of power 60 W as excitation source. The luminescent dynamic decay curves of Tb3+ were measured using a phosphorimeter attachment to the PTI with a xenon-flash lamp (25 W) as excitation source. All measurements were performed at room temperature.
III. RESULTS AND DISCUSSION
A. Crystalline phase
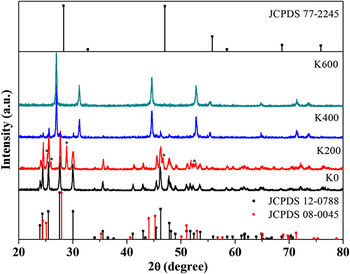
Figure 1 shows the XRD patterns of the final products synthesized with different amounts of KNO3 and standard data. The pattern of the sample K0 can be well indexed to the orthorhombic phase GdF3 (space group: Pnma (62), JCPDS 12-0788). The sample K200 is a mixture of the orthorhombic phase GdF3 and a new material. The diffraction peaks of the new material are denoted as *. Compared to the standard data, the new material can be indexed to the hexagonal phase CeF3 (space group: P63/mcm (193), JCPDS 08-0045) but the positions of the diffraction peaks move toward higher degree because the ionic radius of Gd3+ (Tb3+) is smaller than that of Ce3+. According to Refs. Reference Wang, Han, Lim, Lu, Wang, Xu, Chen, Zhang, Hong and Liu26–Reference Chen, Yu, Huang, Huang, Yang and Wang29, if the dopant concentration is over 10% in one material, this material should be called a solid solution. In the new material, the concentration of GdF3 maybe over 10% and we believe that the new material is a solid solution of CeF3–GdF3–TbF3. With the amount of KNO3 increasing to 400 mol%, the sample K400 is a mixture of GdF3 and KGdF4. The obtained KGdF4 can be readily indexed to a pure cubic phase CaF2 (space group: Fm-3m (225), JCPDS 77-2245). As shown in the figure, the KGdF4 is the main product. Pure cubic phase KGdF4 is finally obtained when the amount of KNO3 reaches 600 mol%.
X-ray diffraction (XRD) patterns of 5 mol% Tb3+ and 10 mol% Ce3+ doped samples synthesized with different amounts of KNO3 and reference data.

The concentration of Ce3+ has great effects on the crystalline phases of final products. Since we want to synthesize pure cubic phase KGdF4, we study the effects of the amount of Ce3+ on the final products using 400 mol% KNO3 but the experimental results deviate greatly from those of expected. Figure 2 shows the Ce3+ concentration dependent XRD patterns of the samples synthesized with 5 mol% Tb3+ (except Ce0). The corresponding standard data are listed in the figure. From the XRD pattern, it is clear that the sample Ce0 (100 mol% Gd3+) is a mixture of the orthorhombic GdF3 (JCPDS 12-0788) and the cubic phase KGdF4 (JCPDS 77-2245), and the ratio of the two samples is analogous judged from the relative intensities of the diffraction peaks. When 5 mol% Ce3+ and 5 mol% Tb3+ are introduced in the raw materials, the sample Ce5 is also a mixture of KGdF4 and GdF3 but the content of GdF3 decreases, estimated from the relative intensities of the diffraction peaks. Nearly pure KGdF4 is obtained when Ce3+ concentration is 10 mol%. The XRD patterns of the samples Ce0, Ce5, and Ce10 illustrate that the Ce3+/Tb3+ doping contributes to the formation of KGdF4. When the Ce3+ concentration increases to 20 mol%, the XRD pattern of the sample Ce20 can be indexed to the hexagonal phase CeF3 (JCPDS 08-0045) and the diffraction peaks move to higher degree because the ion radius of Gd3+ (Tb3+) is smaller than that of Ce3+. The sample should be a solid solution of CeF3–GdF3–TbF3. Though the concentration of Ce3+ is only 20 mol%, the sample presents the hexagonal phase of CeF3. With the increase of the Ce3+ concentration, the samples can also be indexed to CeF3, the relative diffraction intensities change and become weaker, and the diffraction peaks move to lower degree as well. The XRD evolution of the sample synthesized with different Ce3+ concentration proves the existence of the solid solution of CeF3–GdF3–TbF3 in the final products.
XRD patterns of final products dependence on Ce3+ concentration and standard data.

B. Morphology
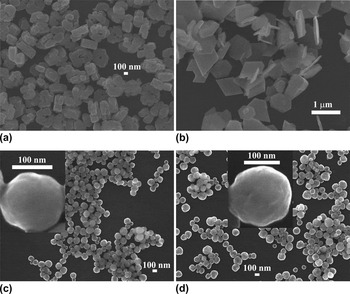
The FESEM images of the samples synthesized with different amounts of KNO3 are illustrated in Fig. 3. The GdF3 [sample K0; Fig. 3(a)] sample has a cookie-like morphology with a hole in the center which is aggregate of several particles with an average size of 100 nm. The sample K200 [Fig. 3(b)] displays various morphologies: diamond shape (GdF3), hexagonal disks (solid solution of CeF3–GdF3–TbF3), and some particles (GdF3). Figure 3(c) is the FESEM image of the sample K400, which has spherical morphology with an average diameter of 130 nm. The inset in Fig. 3(c) is a single spherical particle. By increasing the content of KNO3 to 600 mol%, the sample K600 attains spherical morphology and the size of the spherical particles becomes larger in an average diameter which is 150 nm as shown in Fig. 3(d). A single particle in the inset of Fig. 3(d) illustrates that.
Field emission scanning electron microscopy (FESEM) images of final products (a) K0, (b) K200, (c) K400, and (d) K600. Insets in Figs. 3(c) and 3(d) are single spherical particles of corresponding samples.

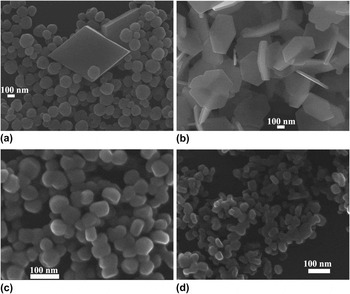
Figure 4 presents the FESEM images of the Ce3+ concentration dependent samples. The sample Ce5 [mixture of KGdF4 and GdF3; Fig. 4(a)] is also diamond shaped (GdF3) and has spherical (KGdF4) morphology. The sample Ce10 (K400) has spherical morphology as illustrated in Fig. 3(c). Great change happens with the sample Ce20, which is a solid solution of hexagonal phase CeF3–GdF3–TbF3. The sample presents hexagonal disk morphology with an average size of 200 nm in edge length and 20 nm in breadth as shown in Fig. 4(b). When the concentration of Ce3+ increases to 50 mol% [Fig. 4(c)], the sample Ce50 is composed of spherical-like particles with an average size of 50 nm. The 5 mol% Tb3+ doped CeF3 (Ce95) nanocrystals in Fig. 4(d) are smaller particles (about 30 nm) than those in Fig. 4(c). The FESEM images agree well with the XRD data.
FESEM images of samples (a) Ce5, (b) Ce20, (c) Ce50, and (d) Ce95.

As shown in Figs. 3 and 4, the concentrations of KNO3 and Ce3+ also have great effects on the morphology of final products. The morphology has great relations with the synthesis conditions and methods in addition to the intrinsic structural properties of the samples. In our experiment, when no KNO3 was added in the raw material, the GdF3 [sample K0; Fig. 3(a)] was cookie-like with a hole in the center. When 200 mol% KNO3 was added in the raw material, the GdF3 was diamond shaped. The sample K400, which was made of GdF3 and KGdF4, was spherical with an average diameter of 130 nm. The experimental results suggest that the concentration of K+ has great effects on the morphology of the GdF3. The formation mechanism of the morphology has a lot of work to do with the pH values of the prepared solutions, the concentration of ions in the solutions, and so on, which will be studied in the future.
C. Possible phase transition mechanism
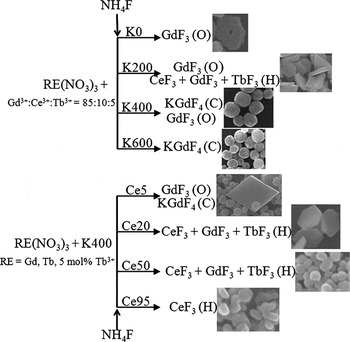
Based on the analysis of XRD results and the FESEM images, we speculate one possible mechanism for the phase transition of final products. For the KNO3 concentration dependent samples, when no KNO3 was added in the raw materials, the final product was GdF3. When 200 mol% KNO3 was introduced, the hexagonal phase solid solution of CeF3–GdF3–TbF3 emerged beside GdF3. We believed that the emergence of KNO3 affected the reaction between F− and RE3+, but it did not participate in the chemical reaction because there was no potassium compound in the sample K200. Since the basicity of the RE2O3 along the rare earth series gradually decreases, the CeF3 was easier to be formed than that of GdF3 so the solid solution of CeF3–GdF3–TbF3 was formed simultaneously. When the concentration of KNO3 increased to 400 or 600 mol%, K+ participated in the reactant reaction and the KGdF4 was formed. For the Ce3+ concentration dependent samples, KNO3 was fixed as 400 mol%. The CeF3 was easier to be formed than the GdF3. When the concentration of Ce3+ was only 20 mol%, the sample presented the hexagonal phase indicating the high capacity of CeF3, which meant that the final product presented the CeF3 phase though the concentration of CeF3 was low. For simplicity, the proposed possible phase transition mechanism of the samples based on the present data is illustrated in Scheme 1. There is a lot of work to do to analyze the mechanism of the phase transition, which we purport in the future.
Possible phase transition mechanism of the samples. Online TOC

D. Optical properties
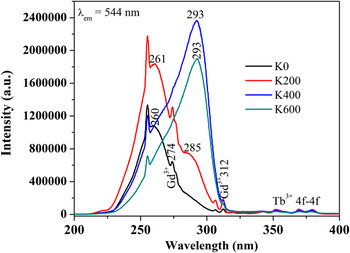
Figure 5 shows the PL excitation spectra of the samples synthesized with different amounts of KNO3. By monitoring at 544-nm emission of the Tb3+, the sample GdF3 (K0) presents a broad excitation band peaking at 260 nm, which can be attributed to the electric dipole-allowed 4f → 5d transition of Ce3+.Reference Li, Ma, Yang, Xu, Li, Yang, Peng and Lin30 In addition, there are excitation peaks at around 274 and 312 (307) nm which can be assigned to the 8S7/2 → 6IJ and 8S7/2 → 6PJ transitions of host Gd3+, respectively.Reference Li, Ma, Yang, Xu, Li, Yang, Peng and Lin30 The presence of Gd3+ excitation peaks in the PL excitation spectra indicates the existence of ET from Gd3+ to Tb3+. In the wavelength range of 320–400 nm, there are weak characteristic transitions of forbidden 4f → 4f transitions within the Tb3+ configuration.Reference Huang, You, Jia, Song, Zheng, Yang, Liu and Guo22, Reference Lei, Pang, Fan, Feng, Song, Dang and Zhang24 A shoulder at about 285 nm emerges in the sample K200 beside the main band peaking at 261 nm. The excitation spectra of both the samples K400 and K600 have only one main band peaking at about 293 nm. The disappearance of excitation band at 261 nm (260 nm) suggests the variations of the located lattices of Ce3+, which prove the phase evolution of the final products. The variation of the excitation spectra of sample agrees well with the XRD data. The final products change from the Ce3+/Tb3+ codoped orthorhombic phase GdF3, to a mixture of the orthorhombic phase GdF3 and the hexagonal phase solid solution of CeF3–GdF3–TbF3 and to the pure cubic phase KGdF4 finally; the 4f → 5d band of Ce3+ is sensitive to the host environment so the excitation bands of Ce3+ in the final products change, which prove the phase evolution of the final products.
Photoluminescence (PL) excitation spectra of Ce3+/Tb3+ doped final products synthesized with different amounts of KNO3.

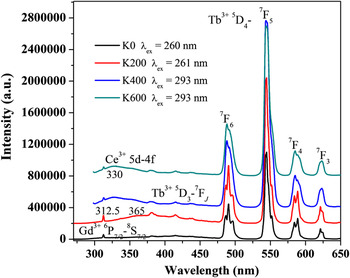
The PL excitation spectra change with the amount of KNO3; correspondingly, the PL emission spectra will also change because the 5d → 4f transition of Ce3+ and the 4f → 4f transitions of Tb3+ are both sensitive to the environment of the local lattices. With Ce3+ sensitization, the PL emission spectra of samples K0, K200, K400, and K600 are illustrated in Fig. 6. The characteristic emission of Tb3+ 5D4 → 7F6, 5D4 → 7F5, 5D4 → 7F4, and 5D4 → 7F3 transitions are observed.Reference Huang, You, Jia, Song, Zheng, Yang, Liu and Guo22, Reference Lei, Pang, Fan, Feng, Song, Dang and Zhang24, Reference Li, Ma, Yang, Xu, Li, Yang, Peng and Lin30 As shown in the figure, the splits of Tb3+ emissions of the samples become inconspicuous with the increase of the amount of KNO3 (phase evolution). The emission bands of Ce3+ 5d → 4f are very different in the final products. Ce3+ has nearly no emission in the sample K0; it has a broad emission band peaking at about 365 nm in the sample K200; and the emission bands shift to about 330 nm in the samples K400 and K600, respectively. In addition, there are emissions of Gd3+ 6P7/2 → 8S7/2 peaking at 312.5 nm in the spectra, which indicate the existence of ET from Ce3+ to Gd3+.Reference Li, Ma, Yang, Xu, Li, Yang, Peng and Lin30 As shown in the figure, the emission intensities of Gd3+ are also different in the samples.
PL emission spectra of Ce3+/Tb3+ doped final products synthesized with different amounts of KNO3.

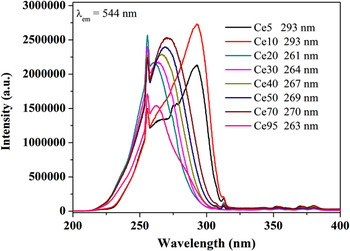
By monitoring at 544-nm emission of the Tb3+, the PL excitation spectra dependence on the Ce3+ concentration are illustrated in Fig. 7. According to the main peak positions and the spectral profiles, the excitation spectra can be divided into three groups: the first group including the samples Ce5 and Ce10, the main excitation peaks locate at 293 nm though there are shoulders at about 265 and 274 nm; the second group including the samples Ce20, Ce30, Ce40, Ce50, and Ce70, the spectra only have one main peak and the peak position is red shifted from 261, 264, 267, 269, to 270 nm with the increase of Ce3+ concentration; and the third group including Tb3+ doped CeF3 (Ce95), which has one main peak positioned at about 263 nm.
PL excitation spectra dependence on Ce3+ concentration.

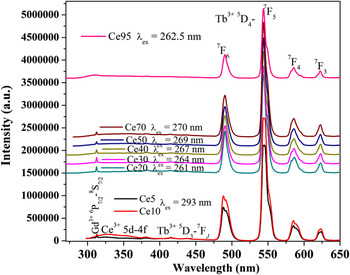
Correspondingly, the PL emission spectra can also be divided into three groups. Figure 8 shows the PL emission spectra dependent on the Ce3+ concentration. In the first group (samples Ce5 and Ce10), not only the emission of Tb3+ but also the emission of Ce3+ become stronger with the increase of Ce3+ concentration. In the second group, the Ce3+ concentration is in the range of 20–70 mol% and the samples are in hexagonal phase. The Ce3+ has nearly no emissions compared to those in the first group. The emissions of Tb3+ increase slightly with the concentration increase of Ce3+ and the spectral profiles become smooth. In the third group (the sample Ce95, 5 mol% Tb3+ doped CeF3), the emission of Gd3+ disappears as there is no Gd3+ in the sample and the emissions of Tb3+ become weaker compared to the other samples.
PL emission spectra dependence on Ce3+ concentration.

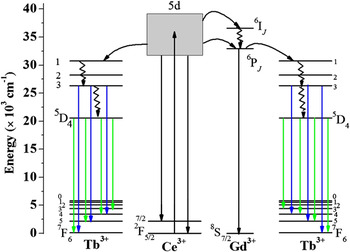
Based on previous studies of ETs in Ce3+/Tb3+ codoped gadolinium compoundsReference Li, Ma, Yang, Xu, Li, Yang, Peng and Lin30, Reference Blasse31 and the above PL excitation and emission spectra, we believe that the excitation energy is absorbed by Ce3+ 4f → 5d transition and then mainly transferred to Tb3+ in KGdF4, where the energy is released as visible emissions. In addition, Ce3+ can transfer energy to Gd3+ and then Gd3+ transfers the energy to Tb3+. In the GdF3 and the solid solution of CeF3–GdF3–TbF3, the excitation energy is absorbed by Ce3+ 4f → 5d transition and then mainly transferred to Gd3+ as the energy levels match well and then Gd3+ transfers the energy to Tb3+. And in CeF3, the excitation energy is absorbed by Ce3+ 4f → 5d transition and then transferred to Tb3+ directly. Figure 9 is schematic energy level diagram of Ce3+, Tb3+, and Gd3+, and possible excitation and emission processes are plotted in this figure. It illustrates that the luminescent process starts with excitation of Ce3+ followed by ET process from Ce3+ to Tb3+ directly or to Gd3+ to Tb3+, and then the energy is released by them. From the PL spectra of the samples, we can infer that the excitation energy can be released by Ce3+ before ET occurs from Ce3+ to Tb3+ (Gd3+) or by Gd3+ in the energy migration among host lattices.
Schematic energy level diagrams of Ce3+, Tb3+, Gd3+, and possible excitation and emission processes.

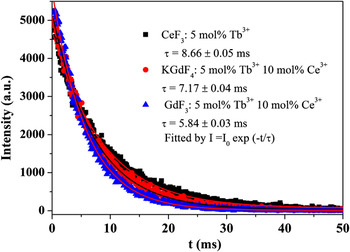
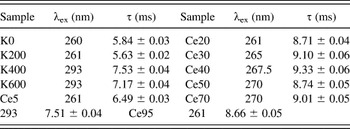
Figure 10 is the luminescent decay curves monitoring at the 5D4 → 7F5 transition of Tb3+ in the representative samples Ce95, K600, and K0. The decay curves can be well fitted by a single exponential function I(t) = I 0exp(−t/τ), where I 0 is the initial emission intensity at t = 0 and τ is the 1/e lifetime of Tb3+. The τ (8.66 ± 0.05 ms) in the hexagonal CeF3 (Ce95) is longer than that in the cubic phase KGdF4 (K600, 7.17 ± 0.04 ms) or the orthorhombic phase GdF3 (K0, 5.84 ± 0.03 ms). The measurement conditions and deduced lifetimes of Tb3+ in all the samples are listed in Table I.
Decay curves of Tb3+ 5D4 → 7F5 in representative samples.

Spectroscopic parameters for 5D4 → 7F5 lifetimes of Tb3+.

IV. CONCLUSIONS
In conclusion, by controlling the amount of KNO3, the final products evolve from the orthorhombic phase GdF3, to a mixture of the orthorhombic phase GdF3 and the hexagonal phase solid solution of CeF3–GdF3–TbF3 and finally to the cubic phase KGdF4 . The Ce3+ concentration dependent final products prove the existence of the hexagonal phase solid solution CeF3–GdF3–TbF3. The XRD patterns and the FESEM images illustrate the phase transformation and the variation in morphology of the samples. Since Ce3+ is sensitive to the local symmetry, Ce3+ presents different optical properties in sensitizing Tb3+ emission in the samples as well as its own emissions. Tb3+ also presents different emissions in the final products because its 4f → 4f transition is affected by the local symmetry around Tb3+. The PL spectra and the luminescent dynamic curves clearly demonstrate the variations in optical properties of the samples.
ACKNOWLEDGMENTS
This research was supported by Basic Science Research Program through the National Research Foundation of Korea (NRF) funded by the Ministry of Education, Science and Technology (No. 2010-0022540) and this research was also supported by NCRC (National Core Research Center) program through the NRF funded by the Ministry of Education, Science and Technology (No. 2010-0001-226).