1. INTRODUCTION
Animals that live in groups must make joint decisions about many aspects of their daily lives, including where and how to divide up the group's activity budget, where to travel to, and how best to get there. Recent theoretical interest has focused on the mechanisms through which such group decisions are made, with a broad distinction between “democratic” processes, where most/all group members contribute to a decision, and “despotic” systems where one or a small number of individuals emerge as leaders who make decisions for the rest of the group (Conradt & Roper, Reference Conradt and Roper2003). Both these scenarios raise interesting questions: in the case of the former, for example, how are individuals' preferences pooled and a compromise decision selected, and in the latter, how are leaders chosen when group members may not be able to assess who is best informed? Mathematical modelling approaches can yield useful insights into these topics, with group navigation constituting a particularly informative system.
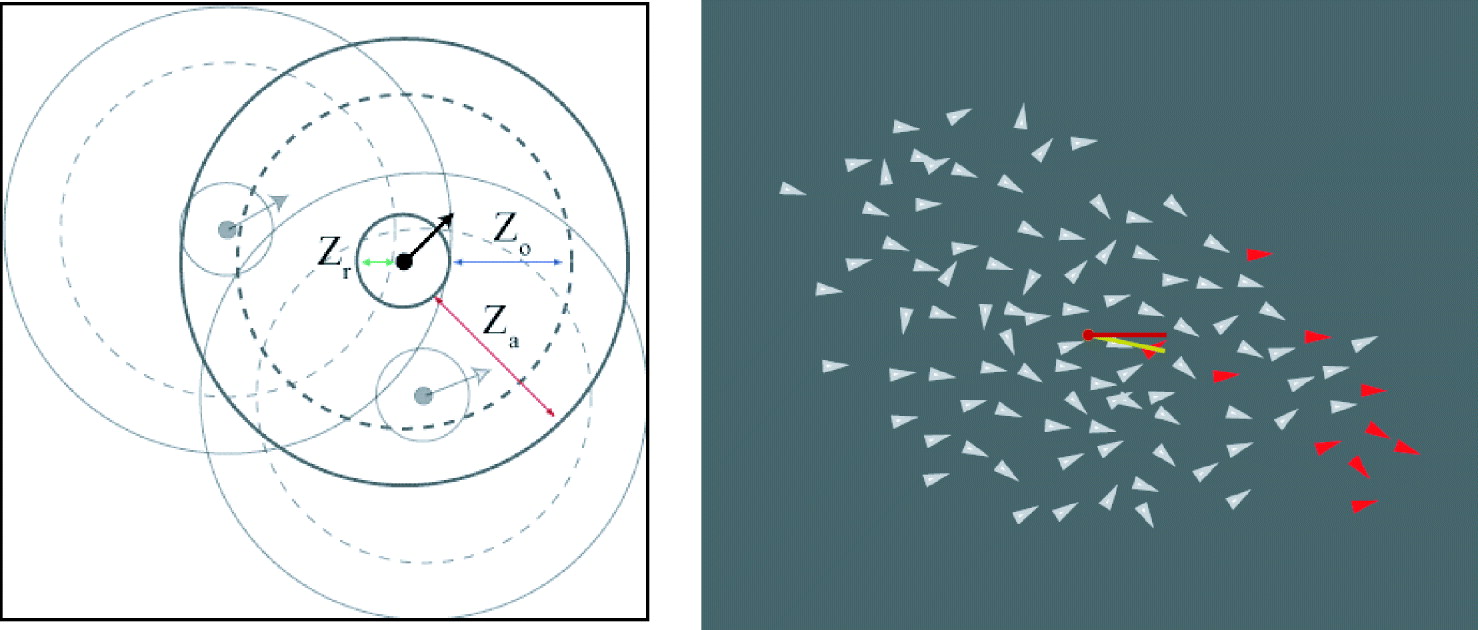
Consequently, the structure and behaviour of collectives of individuals has been widely examined by theoreticians in recent years, and there is now some consensus about the basic behaviours that control the dramatic motions of large animal groups. While there have been some models of individual navigation (for example, Wiltschko & Nehmzow, Reference Wiltschko and Nehmzow2005), here we focus on models of groups. ‘Avoid, align and group’ mechanisms have been used to model the movement and behaviour of a number of animal groups (Couzin, Reference Couzin, Krause, Franks and Levin2002). In these models, each individual has three basic behaviours:
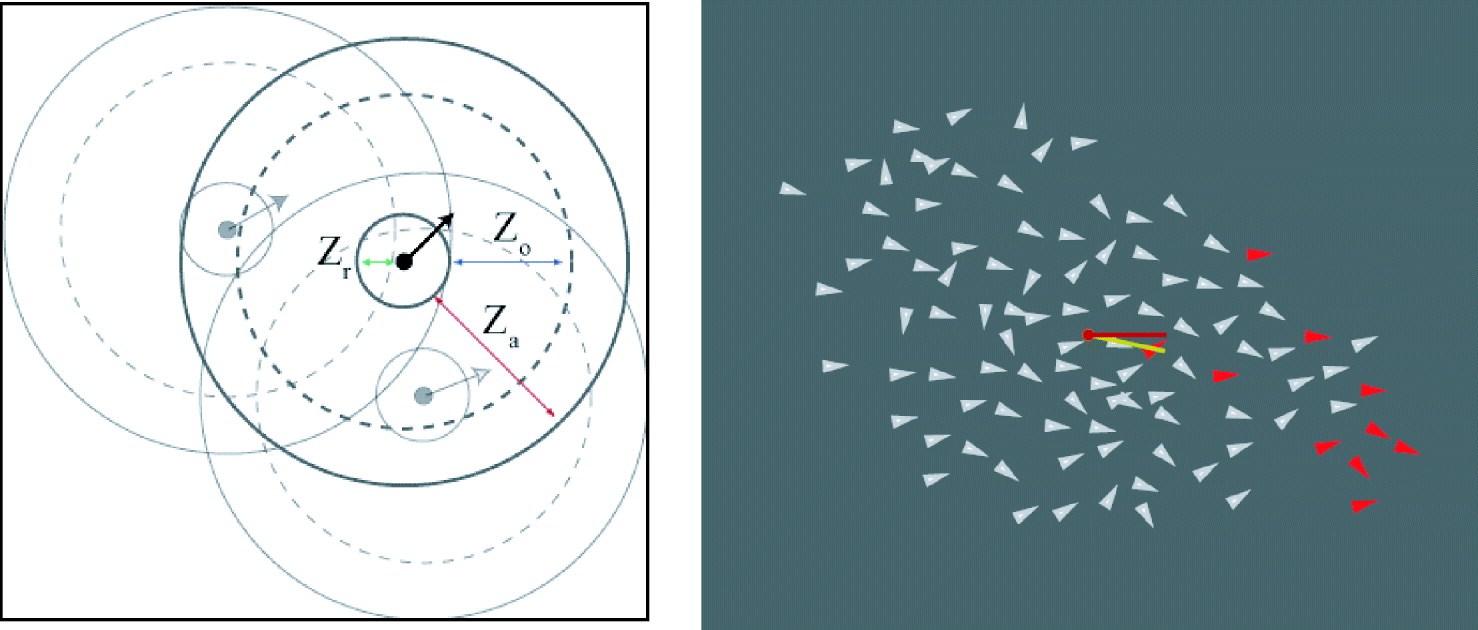
1. Avoid other individuals that are too close (Zr, Figure 1);
2. Orient with nearby individuals to maintain a consistent group heading (Zo, Figure 1);
3. Move closer to nearby individuals to maintain group cohesion (Za,Figure 1).
Left: Schematic of an individual within models. Three zones which influence the individuals behaviour are shown: Zr the zone of repulsion, Zo the zone of orientation, and Za the zone of attraction. (after Couzin et al Reference Couzin, Krause, Franks and Levin2003) Right: Example of 100 individuals navigating within a group. Red individuals have a preferred direction (see methods).
Recently, Couzin et al. (Reference Couzin, Krause, Franks and Levin2005) demonstrated the decision-making capabilities of such groups, showing that collectively the group is able to discriminate between small navigational differences among individual navigational preferences within the group and can accurately select the majority preference, even when this is very small.
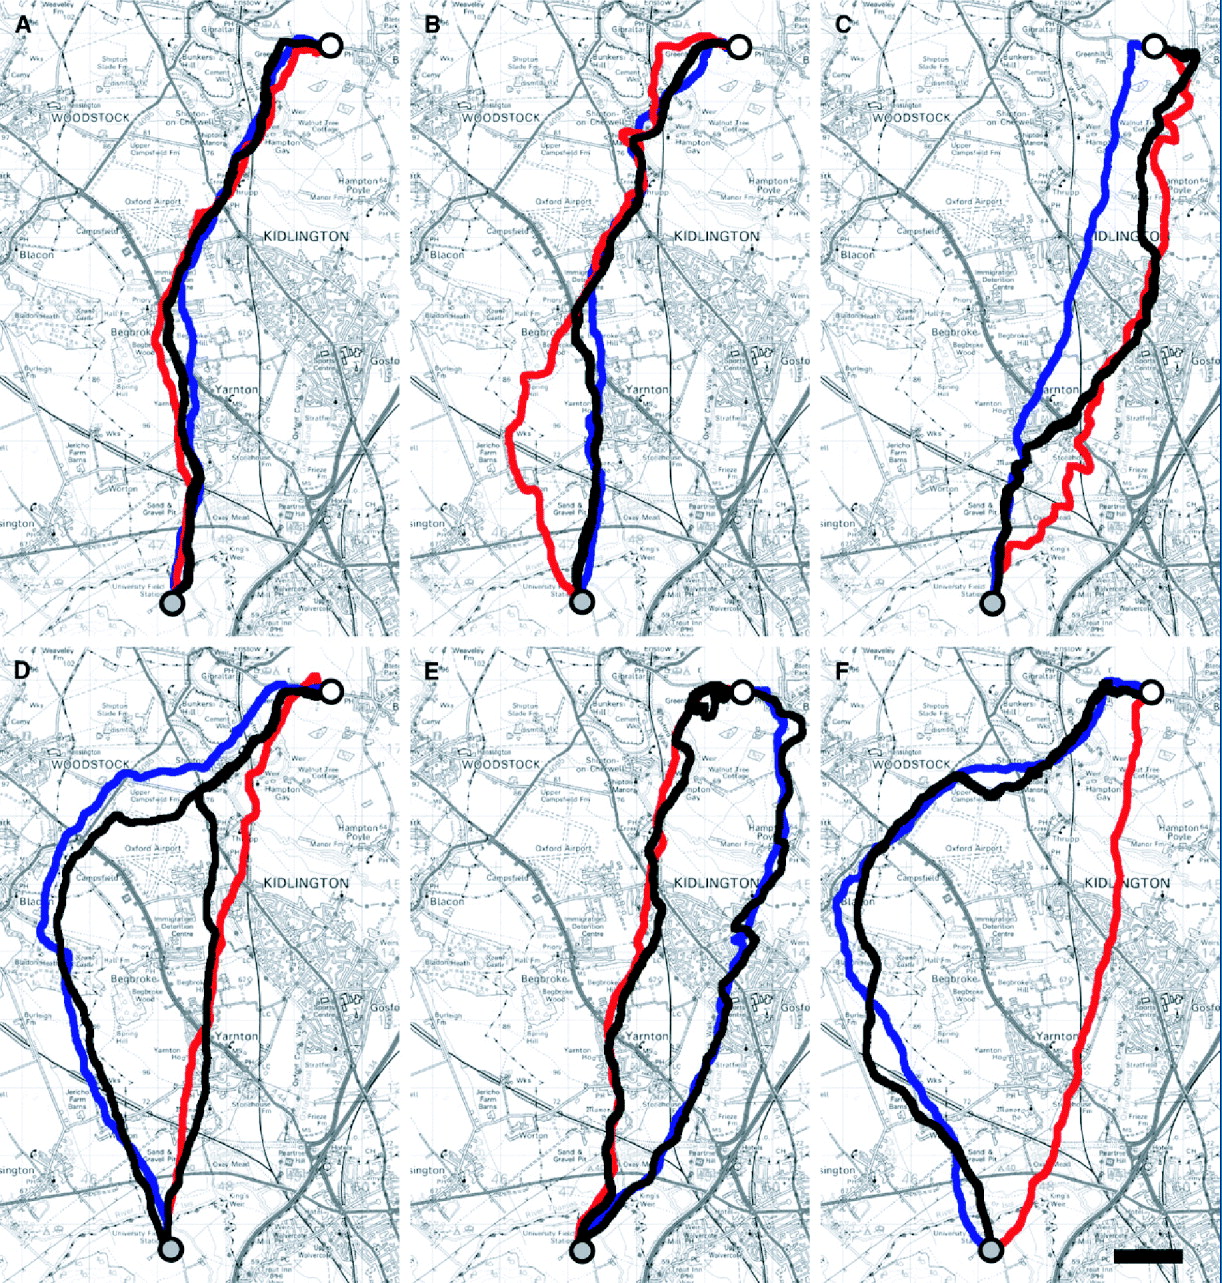
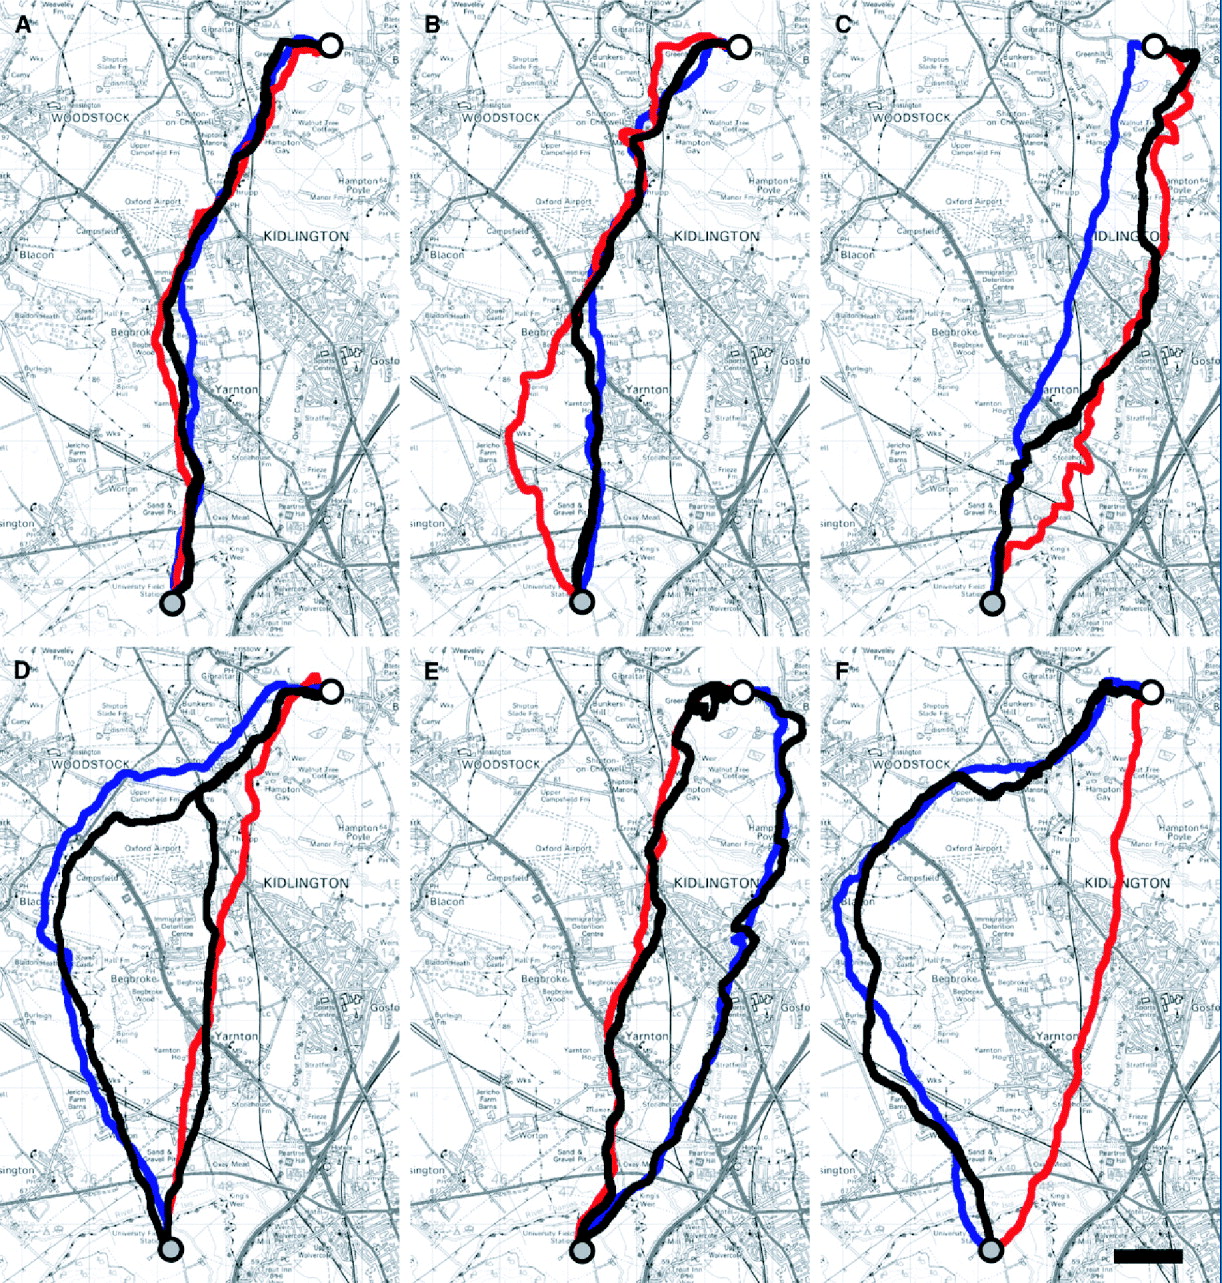
While some recent studies provide experimental data that can be used to examine various models of collective behaviour (for examples, see Table 1 in Conradt and Roper, Reference Conradt and Roper2003), there has only been limited work that combines the modelling approach with specific experimental validation. Recently, Biro et al. (Reference Biro, Sumpter, Meade and Guilford2006) attempted this by combining high resolution GPS tracking of co-navigating pigeons with mathematical models to describe the birds' interactions. Here, pairs of birds were released in navigational conflict: having to balance their desire to fly as a pair with their desire to return to an idiosyncratic route they had learned to favour during prior individual training (see Meade et al. Reference Meade, Biro and Guilford2005; Biro et al. Reference Biro, Meade and Guilford2004 for descriptions of the route recapitulation phenomenon in single birds). Results (see Figure 2 for examples) showed that under certain circumstances birds compromised on their navigational choices and flew in-between their two established routes, at other times one or the other of the pair emerged as the leader, while in yet other cases the pair split up. To elaborate on the factors that might determine the outcome of the interaction, a mathematical model was developed using simple rules to describe the opposing forces acting on the birds during paired flight: attraction to flight partner vs. attraction to route. This model predicted that – much like the work of Couzin et al. (Reference Couzin, Krause, Franks and Levin2005) – in the case of small inter-individual disagreement about the route to take, birds would compromise, whereas if the difference in preferred routes rose over a critical threshold, the pair would either split or one of the birds would emerge as leader. The distribution of these different eventualities within the data corresponded to the predictions of the model, suggesting that the degree of conflict between individuals indeed influences the outcome of a single decision-making process based on a simple set of local rules.
Co-released birds and previous recapitulated routes. Black lines show the flight paths of birds released together. Blue and red lines show the previous, stably recapitulated routes of the two individuals comprising the pair. (A) Birds remained in a pair throughout the flight, sometimes taking the average route. (B) Birds remain in a pair, initially taking an average route, then taking one of the previously established routes. (C) Birds remain in a pair and switch between routes. (D) Birds initially take a shared, average route, then split and return to their previous routes. (E) Birds split at release and fly along their previous routes. (F) Birds fly along one of the two previous routes. (From Biro et al. Reference Biro, Sumpter, Meade and Guilford2006).
Interestingly, when looking at the identity of leaders within all pair-wise interactions, the authors identified a fully transitive dominance hierarchy among their subjects. Position of a bird in this hierarchy seemed to correspond neither to navigational ability (birds with shorter established routes did not necessarily become leaders), nor to social dominance as observed in the loft. In the present paper we now investigate, through further modelling, the potential role of this hierarchy during navigational decision-making by pairs of pigeons. Does a stable hierarchy influence the speed and robustness of decision-making in the group? We report here our model developed to incorporate internal group structure and dominance relationships, together with some preliminary results.
2. METHODS
Following Couzin et al. (2003), we consider a group of N individuals, each with position vector c(t), direction vector v(t), and speed s i. At all times, individuals try to maintain a minimum distance between themselves i and others j by turning away from nearby neighbours within distance α (or Zr). When there are individuals within this distance, a desired heading away from them is calculated:
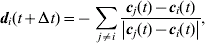
where di represents the individual's desired direction of travel. Maintaining this minimum distance from other individuals is the highest priority. If there are no individuals within this ‘personal space’ then the individual will be attracted to, and align with, its neighbours within distance ρ (which is both Zo and Za which are equal here), and again a desired heading towards and aligning with these other individuals is calculated:

Here di(t+Δt) is normalised to a unit vector  :
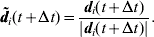
Within the group of individuals, there are some ‘informed’ individuals who have information about a preferred direction g (simulating a direction towards a resource or location). Uninformed, or naive individuals have no information about this direction or which other individuals are informed. Those informed individuals must balance their desire to maintain group cohesion with their preferred direction:
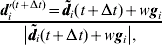
where w is a weighting factor between the individual's social interactions and their preferred directions. When w=0 the preferred direction g has no influence, and the individuals have no preference for any particular direction. As w exceeds 1, the individual's preferred direction has more influence than the interactions with their neighbours.
Conflicts of information within the group can be simulated by giving two groups of informed individuals differing preferred directions. Varying the angular difference between these preferred directions simulates an increasing conflict between the two informed groups. To examine the effect of hierarchical relationships within the group, we extend the above model to include a ‘social importance’ factor, h. This affects the social relationships between the individuals by weighting their interactions:

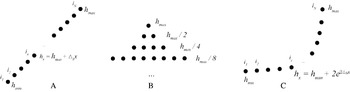
where h varies with each individual and higher values of h will cause interactions with the given individual to have greater influence on the group. Values of h can be generated to mimic specific social structures but initially we examine some simple distributions of h, linear, pyramidal and exponential. A linear distribution of h places each individual within a linear hierarchy (Figure 3A). A pyramidal distribution has multiple ranks of influence within which individuals are equally influential (Figure 3B), and in an exponential distribution, influence increases exponentially with each individual (Figure 3C).
Distributions of h-values. A: linear, B: pyramidal, C: exponential distribution. Within each diagram ix is the xth member of the population, and h can be calculated accordingly (see equations in A & C).

All simulations reported here used 100 individuals, for between 1000 and 2500 time steps. Unless otherwise stated, parameters used were: α=1·0, ρ=6·0, Δt=0·05, s=1·0, Δθ=2·0, ω=0·5. Agents' initial positions and velocities were randomly assigned.
3. INITIAL RESULTS
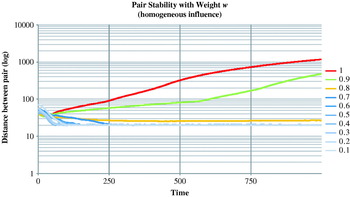
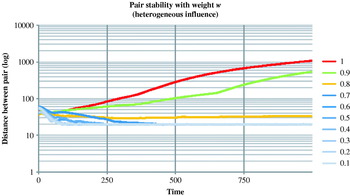
Initially, we can simulate two individuals within the model to explore the relationship between them and compare the results to the model within Biro et al. (Reference Biro, Sumpter, Meade and Guilford2006). Figure 4 shows the average distance between individuals for runs with different weight values, w, but homogenous influence factors. As the weight increases, the likelihood of the pair splitting increases until, when the weight is around 0·9, the pair always split. As the weight values control the weighting of individuals' route preferences against social forces, this is to be expected. Figure 5 shows the same runs with heterogeneous weight factors (from the linear distribution in this case), and the results are very similar. This is surprising, as one might expect that as the influence of one bird of the pair increases, the likelihood of individuals splitting would decrease. There is a small increase in the average distance between co-flying birds when the weight is around 0·8 – this is negligible in our preliminary results but requires further examination. The critical region where the birds split up may lie somewhere in between 0·8 and 0·9, and more simulations with a finer resolution of weights is required to assess any effect there.
Distance between simulated pair for different values of weight w. Each member of the pair had a different preferred direction (0° and 180°). For most weights (0–0·8) the pair is stable and remains close throughout their flight. Values above this (0·8–1·0) cause the pair to eventually separate.

Distance between simulated pair with linear influence values. Each member of the pair had a different preferred direction (0° and 180°). Pairs appear to begin to separate earlier and those with lower weights (0·8) are also beginning to break apart.

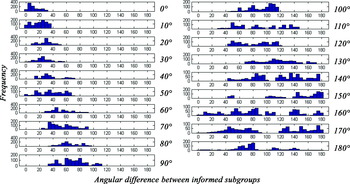
Our model also replicates the results from Couzin et al. (Reference Couzin, Krause, Franks and Levin2005) when using homogeneous (uniform) h-values, validating our methods and confirming the original model (Figure 6). As in Couzin et al., we create two distinct subgroups within the population of individuals, each with different preferential directions. As these directions become increasingly divergent the group initially takes the average route between the two preferred directions, until some threshold value is reached when the birds split and head off towards their own preferred directions (140° – 180° in Figure 6).
Final trajectory of group (by measuring group displacement over 50 time steps), for a range of differences in informed individual's preferred directions. As the difference between preferred directions increases from 0° to 180° the group initially takes the average path, but eventually splits.

Assessing the change in group behaviour with different h-values is not straightforward. The effects of influential individuals may be seen in a number of observable factors. For example, conflict resolution may be altered, affecting the time until a decision is reached by the group (even if that is to remain on an average heading). Alternatively, we may see effects in the local structure of the group without any obvious group level effects. We are currently assessing a number of measurements to highlight the potential changes in these factors.
4. DISCUSSION
In existing models of the movement of animal groups, most groups are assumed to be generally homogenous, with some differences in existing knowledge or preference, but similar influence on the rest of the group. While this highlights some of the startling processing capabilities of such groups, it does not address the existence of internal group structure such as that revealed by recent experimental work (Biro et al. Reference Biro, Sumpter, Meade and Guilford2006). While in-flight dominance relationships do not appear to show a clear correlation with navigational efficiency or social structure as evident within the loft, they are expected to serve some role within the navigational task. One interesting question concerns how individuals' relative influence within a pair is determined – in other words, how are leaders chosen? Individuals may be able to gauge something about their partner based on some aspect of their behaviour in flight – such as, for example, local flight tortuosity – that better explains the observed navigational hierarchy.
Differing levels of influence within social groups may facilitate faster information transfer throughout them. Rather than the diffusion of information within the group that would occur if information from all members was of equal value, heterogeneous influence could form information conduits within the group, allowing information from valued members to be transferred more effectively throughout the group.
Within this paper we have begun to analyse the impact such a hierarchy has on the navigational performance of collections of individuals. While initial results, based on preliminary runs of our model, have not so far demonstrated clear differences between homogeneous and heterogeneous groups, it may be that further adjustments to the model are needed, such as the pre-assignment of individuals with preferred directions (existing knowledge) as the more “influential” members of the group. Further exploration and characterisation of the impact of such internal structure/hierarchies on group dynamics and navigational performance is obviously needed and we now have a framework to begin answering these questions more fully. Over the coming months we will begin to address these questions and will generate hypotheses that can be validated by experimental GPS tracking of groups of pigeons in the coming season.
ACKNOWLEDGEMENTS
We thank Tim Guilford, Jessica Meade, and Julian Howe for assistance with pigeon releases, David Sumpter for help with data analysis and modelling, and Matthew Collett for useful discussions. D. B. thanks the Royal Society for financial support.