







1. Introduction
Understanding the conversion of kinetic energy into potential energy by stratified turbulent flows is a crucial task in environmental and geophysical fluid dynamics. A key metric of the efficiency of this conversion, referred to as the flux coefficient ( $\varGamma$) in this paper, measures the ratio of the rate (
 $\varepsilon$) at which turbulent kinetic energy (TKE) dissipates to the rate (
 $\chi$) at which buoyancy variance is destroyed (Osborn & Cox Reference Osborn and Cox1972). Numerous studies have been devoted to the appropriate parametrization of
 $\varGamma$, leading to insightful reviews on this topic, including a few recent ones (Gregg et al. Reference Gregg, D'Asaro, Riley and Kunze2018; Caulfield Reference Caulfield2020, Reference Caulfield2021). Establishing a generic scaling for
 $\varGamma$ is challenging because it involves many dimensionless parameters which are often interrelated. These parameters tend to vary with each other within a given flow configuration, making it difficult to design a truly ‘controlled’ study to examine the effect of altering just one parameter without affecting the others. Stratified turbulence also exhibits large spatiotemporal variability, giving rise to dynamically distinct regions in the flow which may inherently differ in the
 $\varGamma$ value they manifest. For example, Portwood et al. (Reference Portwood, de Bruyn Kops, Taylor, Salehipour and Caulfield2016) found that turbulent ‘patches’, intermittent ‘layers’ and quiescent regions coexist in the turbulence, while only the patches were associated with significant density overturns. Such dynamically relevant local dynamics may risk being overlooked when spatial and/or temporal averages are taken to formulate ‘bulk’ statistics for mixing (Caulfield Reference Caulfield2020, Reference Caulfield2021).
Identifying a universal scaling for  $\varGamma$ encounters additional challenges due to the wide variety of forcing mechanisms in stratified mixing studies. In numerical simulations alone, the approach to generating turbulence varies widely. For instance, turbulence can be obtained by setting initial conditions that lead to canonical shear flow instabilities such as Kelvin–Helmholtz (KH) and Holmboe waves (e.g. Salehipour & Peltier Reference Salehipour and Peltier2015; Salehipour, Caulfield & Peltier Reference Salehipour, Caulfield and Peltier2016), with buoyancy being the only body force during the flow's evolution. However, strong stratification naturally suppresses these shear instabilities, restricting such studies to the ‘weakly stratified’ scenarios (Caulfield Reference Caulfield2020). This restriction extends to boundary-forced flows (e.g. Zhou, Taylor & Caulfield Reference Zhou, Taylor and Caulfield2017), where turbulence is unlikely to persist under strong stratification to reach statistical stationarity. To produce vigorous, statistically stationary turbulence in strongly stratified conditions, some form of external body forcing is necessary. This may include targeted forcing on specific vertically uniform vortical modes (e.g. Brethouwer et al. Reference Brethouwer, Billant, Lindborg and Chomaz2007) or mechanisms that drive internal gravity waves’ breaking (Howland, Taylor & Caulfield Reference Howland, Taylor and Caulfield2020). While such forcing facilitates the study of strongly stratified situations, it could complicate the interpretation of
 $\varGamma$ results by introducing potential sensitivities to the forcing methods applied (Howland et al. Reference Howland, Taylor and Caulfield2020; Young & Koseff Reference Young and Koseff2023).
In this paper, we examine the mixing characteristics of a turbulent flow that is ‘strongly stratified’ (Caulfield Reference Caulfield2020), but without any external forces other than buoyancy throughout the flow's development. In § 2, we will introduce the numerical dataset and elaborate on the flow configuration. Despite the lack of external forcing, this flow demonstrates dynamics typical of the ‘strongly stratified turbulence’ (SST) regime (Brethouwer et al. Reference Brethouwer, Billant, Lindborg and Chomaz2007), also known as ‘layered anisotropic stratified turbulence’ (LAST) (Falder, White & Caulfield Reference Falder, White and Caulfield2016). Hereinafter, we use the term ‘strongly stratified’ to denote dynamics characteristic of the SST/LAST regime that spontaneously arise in the flow. Previous research on the flux coefficient  $\varGamma$ within the strongly stratified context has primarily concentrated on statistically stationary scenarios involving external forces (e.g. Maffioli, Brethouwer & Lindborg Reference Maffioli, Brethouwer and Lindborg2016). Our study, however, will report time-dependent results of
 $\varGamma$ in this unforced, non-equilibrium, free-shear flow. The volume-averaged (bulk) results will be presented in § 3. In § 4, we introduce conditional sampling of
 $\varGamma$ in relation to a locally defined gradient Richardson number,
 ${\textit {Ri}}$, aiming for a ‘controlled’ assessment of
 $\varGamma$'s dependence on
 ${\textit {Ri}}$. Finally, in § 5, we summarize the key findings and discuss their implications for future research.
2. Turbulence in a strongly stratified wake
2.1. Numerical configuration
The dataset used for the quantification of mixing was derived from the direct numerical simulation (DNS) conducted by Zhou (Reference Zhou2022), henceforth referred to as Z22. Detailed descriptions of the simulation are provided in Z22. The numerical configuration aims to replicate the laboratory experiments of Spedding (Reference Spedding1997). These experiments examined the turbulent wake of a sphere of diameter  $D$, towed at speed
 $U_0$ in a fluid with a uniform buoyancy frequency
 $N$, as illustrated in figure 1. Employing a spectral multidomain method (Diamessis et al. Reference Diamessis, Domaradzki and Hesthaven2005), the simulation solves the incompressible Navier–Stokes equations under the Boussinesq approximation. Zhou & Diamessis (Reference Zhou and Diamessis2019), hereafter ZD19, conducted large-eddy simulations (LES) spanning a broad range of wake Reynolds and Froude numbers,
 ${\textit {Re}} \equiv U_0D/\nu$ and
 ${\textit {Fr}} \equiv 2U_0/ND$. In contrast, Z22 conducted a DNS focusing on a specific case with
 $({\textit {Re}},{\textit {Fr}})=(25\,000,4)$, generating the dataset for the present analysis. This specific parameter set was selected for its ability to access the strongly stratified dynamics while being computationally feasible. The Prandtl number was set to one in this simulation.
Schematic of the computational domain for a temporally evolving, stably stratified wake behind a towed sphere (Diamessis, Domaradzki & Hesthaven Reference Diamessis, Domaradzki and Hesthaven2005; Diamessis, Spedding & Domaradzki Reference Diamessis, Spedding and Domaradzki2011). The mean flow is along the  $x$-direction, and the wake's centreline is at
 $(y,z)=(0,0)$.

Although the simulation models a sphere wake, it does not explicitly compute flow around an object. Instead, the wake is configured to evolve temporally (Orszag & Pao Reference Orszag and Pao1975), and the sphere's impact on the flow is mimicked through a sophisticated scheme (Diamessis et al. Reference Diamessis, Spedding and Domaradzki2011) that creates an initial condition presenting the self-similar flow profiles in the near wake (Spedding Reference Spedding1997). This initial condition corresponds to a downstream distance at which the instabilities initiated by the sphere motion have fully developed, and self-similarity in terms of the mean and fluctuation quantities has been established in the flow (see details in § 3 of Diamessis et al. Reference Diamessis, Spedding and Domaradzki2011). While simulations including the sphere have become feasible in recent years (e.g. Orr et al. Reference Orr, Domaradzki, Spedding and Constantinescu2015; Pal et al. Reference Pal, Sarkar, Posa and Balaras2017), such sphere-less simulations remain the workhorse for investigating turbulent wakes at large  ${\textit {Re}}$ (see a recent survey by Li, Yang & Kunz Reference Li, Yang and Kunz2024). Once the sphere-less wake flow simulation begins, it proceeds without any external forcing besides buoyancy, leading to an unforced stratified flow decaying naturally from a fully turbulent initial state. The sphere's direct impact is incorporated into the initial condition and does not persist during the main wake simulation. This configuration is analogous to the decaying homogeneous turbulence scenario explored by de Bruyn Kops & Riley (Reference de Bruyn Kops and Riley2019) (hereafter dBKR19) but with pronounced inhomogeneity across the plane orthogonal to the mean flow direction, i.e. the
 $y$–
 $z$ plane (figure 1).
2.2. Evolution of wake turbulence
The inhomogeneity over the  $y$–
 $z$ plane leaves only one statistically homogeneous direction in the flow, i.e. the
 $x$-direction. Applying Reynolds decomposition to the velocity field,
 $\boldsymbol {U}$, along the
 $x$-direction yields
 \begin{equation} \boldsymbol{U}(\boldsymbol{x},t)=(\langle U\rangle_{x},0,0)+(U',V',W'), \end{equation}
where  $\langle {\cdot } \rangle _x$ denotes an average in the
 $x$-direction, and
 $\boldsymbol {U}'\equiv (U',V',W')$ is the fluctuation velocity. Other than internal waves generated by the wake turbulence (Zhou & Diamessis Reference Zhou and Diamessis2016; Rowe, Diamessis & Zhou Reference Rowe, Diamessis and Zhou2020), the fluid is essentially quiescent in the wake's surroundings. Following ZD19, the core region of the wake is defined to be within an elliptic cylinder centred around the wake's centreline, i.e.
 \begin{equation} \frac{y^2}{(2L_H)^2}+\frac{z^2}{(2L_V)^2}\le1, \end{equation}
where  $L_H$ and
 $L_V$ are the characteristic width and height of the mean wake, respectively. Quantities can be averaged for the wake's core region as defined above, and we will use
 $\langle {\cdot } \rangle$ to denote such a volume average.
The choice to define the boundary using (2.2) was guided by visual inspections similar to those presented in figure 7 of Z22, where the above definition leads to a reasonably accurate demarcation of the turbulent/non-turbulent (T/NT) interface. The dimensions of  $L_H$ and
 $L_V$ are dynamically adjusted in accordance with changes in the mean flow profile, ensuring that they accurately represent the shape and scale of the mean wake over time. This simple definition does not present the finer details of the T/NT interface should it be defined using more sophisticated criteria (e.g. Watanabe et al. Reference Watanabe, Riley, de Bruyn Kops, Diamessis and Zhou2016) and could introduce a modest degree of uncertainty in the bulk estimates. We anticipate this uncertainty to be relatively minor compared with those introduced by the inherent intermittency of the turbulence, i.e. averaging over dynamically distinct patches to obtain bulk statistics. To address this limitation, a conditional sampling approach is developed in § 4.
Key to describing the mixing efficiency is the dissipation rate of TKE,  $\varepsilon$, and the destruction rate of buoyancy variance,
 $\chi$:
 \begin{equation} \varepsilon(\boldsymbol{x},t)\equiv 2\nu S'_{ij}S'_{ij},\quad\chi(\boldsymbol{x},t)\equiv\frac{\kappa}{N^2}\frac{\partial b'}{\partial x_i}\frac{\partial b'}{\partial x_i}. \end{equation}
Here,  $S'_{ij}\equiv (1/2)(\partial U'_i / \partial x_j + \partial U'_j / \partial x_i)$ is the rate of strain tensor due to
 $\boldsymbol {U}'$, and
 $b'$ is the buoyancy fluctuation. The volume-averaged
 $\varepsilon$ within the wake core,
 $\langle \varepsilon \rangle$, determines two fundamental length scales of the stratified turbulence,
 $\ell _K\equiv ({\nu ^3}/{\langle \varepsilon \rangle })^{1/4}$ and
 $\ell _O\equiv (\langle \varepsilon \rangle /{N^3})^{1/2}$, the Kolmogorov and Ozmidov scales, respectively.
Dynamical insights can be obtained by examining the time evolution of  $\ell _O$ and
 $\ell _K$, alongside the horizontal and vertical integral length scales of turbulence,
 $\ell _h$ and
 $\ell _v$, all plotted in figure 2(a). (The procedure of estimating
 $\ell _h$ and
 $\ell _v$ is documented in appendix C of ZD19.) Here,
 $\ell _h$ is consistently larger than
 $\ell _v$, highlighting the strong anisotropy within the energy-containing, large-scale turbulent structure. As demonstrated by ZD19,
 $\ell _h$ can be considered as the typical size of the ‘pancake’ vortices (Spedding Reference Spedding1997), and
 $\ell _v$ is the characteristic length associated with the shear layers that spontaneously form due to strong stratification (Diamessis et al. Reference Diamessis, Spedding and Domaradzki2011), which is a defining feature of the SST/LAST regime. The Ozmidov scale,
 $\ell _O$, indicative of the largest horizontal scale with adequate kinetic energy for overturning, initially significantly surpasses the viscous scale,
 $\ell _K$. Over time, as the turbulence decays,
 $\ell _O$ diminishes and
 $\ell _K$ enlarges. They intersect at
 $Nt\approx 27$, marking the end of the dynamic range between
 $\ell _O$ and
 $\ell _K$, and the onset of viscous control. In figure 2(b), we examine the evolution of the buoyancy Reynolds number and horizontal turbulent Froude number:
 \begin{equation} \textit{Re}_b\equiv\frac{\langle \varepsilon \rangle}{\nu N^2}=\left(\frac{\ell_O}{\ell_K}\right)^{4/3},\quad \textit{Fr}_h\equiv\frac{\sqrt{\langle U'^2+V'^2 \rangle}}{N\ell_h}. \end{equation}
The value of  ${\textit {Re}}_b$ is initially
 $\simeq 20$ at
 $Nt=1$ and drops below unity by
 $Nt\approx 27$, while
 ${\textit {Fr}}_h$ decreases from 0.033 to 0.007, indicating a stronger buoyancy control on the eddies of size
 $\ell _h$ as time progresses. The inset displays the time series of the vertical Froude number,
 ${\textit {Fr}}_v^{\star }\equiv 2{\rm \pi} \sqrt {\langle U'^2+V'^2 \rangle }/N\ell _v$. From wakes of varying
 ${\textit {Re}}$ and
 ${\textit {Fr}}$, ZD19 noted that a
 ${\textit {Fr}}_v^\star$ range of approximately 0.5 to 1 would indicate that buoyancy has reorganized the flow to establish a vertical scale
 $\ell _v$ following the self-similar scaling of Billant & Chomaz (Reference Billant and Chomaz2001) in the strongly stratified
 ${\textit {Fr}}_h\ll 1$ limit, leading to the predominance of layering dynamics within the turbulence. This period of
 $0.5\lesssim {\textit {Fr}}_v^\star \lesssim 1$ indeed occurs in this specific wake for
 $4\lesssim Nt \lesssim 30$ (see the inset of figure 2b), and we will refer to this period as the ‘strongly stratified’ or ‘layering’ phase of the wake turbulence.
(a) Length scales of dynamical significance, normalized by  $D$, plotted against dimensionless time,
 $Nt$. (b) The path of wake turbulence within the
 $({\textit {Fr}}_h,{\textit {Re}}_b)$ space is shown by a thick grey line, with coloured symbols highlighting specific instances for analysis in § 4. Small grey triangles indicate a subset of simulations by Maffioli et al. (Reference Maffioli, Brethouwer and Lindborg2016). The inset to panel (b) shows the time series of the vertical Froude number,
 ${\textit {Fr}}_v^{\star }$.

2.3. Flow visualization
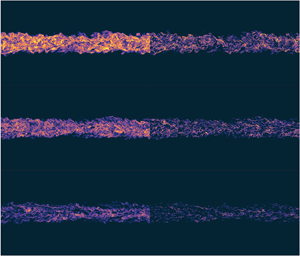
Previous visualizations of stratified wake flows primarily concentrated on vortical structures. For example, figure 4 of ZD19 demonstrated the spontaneous formation of spanwise vorticity layers, while Halawa et al. (Reference Halawa, Merhi, Tang and Zhou2020) examined how variations in  ${\textit {Re}}$ influence potential vorticity structures. In figure 3, we shift our focus to the spatial distribution of
 $\varepsilon$ and
 $\chi$ over the centre
 $oxz$ plane at various stages of wake turbulence corresponding to those highlighted in figure 2(b). In general,
 $\varepsilon$ exhibits higher intensity than
 $\chi$. Both variables display significant spatial intermittency, with their magnitudes changing abruptly over very small length scales. Over time, the intensities of both
 $\varepsilon$ and
 $\chi$ diminish, with the decline in
 $\varepsilon$ leading to an increase in Kolmogorov length and a decrease in Ozmidov scale (figure 2a). Consequently, the bulk
 ${\textit {Re}}_b$ decreases and the dynamic range below
 $\ell _O$ and above
 $\ell _K$ shrinks. At instance A, i.e.
 $Nt=2$, when
 ${\textit {Re}}_b=19$ and turbulence is vigorous, high-intensity regions of
 $\varepsilon$ and
 $\chi$ are distributed uniformly in the flow. By instance C, i.e.
 $Nt=10$, the bulk
 ${\textit {Re}}_b$ has dropped to approximately 4.3, and the high-intensity ‘filaments’ of
 $\chi$ have become markedly sparser. These filaments tend to display opposing orientations on either side of the wake centreline (
 $z=0$), aligning with the mean shear within the wake.
Vertical transects at the centre  $oxz$ plane (
 $y=0$; see figure 1) of (a i,b i,c i)
 $\log _{10}\varepsilon$ and (a ii,b ii,c ii)
 $\log _{10}\chi$ at selected time instances A–C highlighted in figure 2(b). The images shown are close-up views for
 $(-10/3)D< x<(10/3)D$ and
 $(-4/3)D< z<(4/3)D$. The towed sphere generating this wake moves from left to right in the positive
 $x$ direction (see figure 1).

3. Bulk mixing characteristics
3.1.  $\langle \varepsilon \rangle$, $\langle \chi \rangle$ and $\varGamma$


Figure 4(a) illustrates the temporal evolution of the volume-averaged values of  $\varepsilon$ and
 $\chi$. Here,
 $\langle \varepsilon \rangle$ exhibits a monotonic decrease, while
 $\langle \chi \rangle$ initially rises, levels off briefly for
 $2\lesssim Nt \lesssim 3$ and then decreases. The decay rate for
 $\varepsilon$ appears to accelerate at
 $Nt\approx 4$. These patterns align, at least qualitatively, with dBKR19's data on decaying homogeneous turbulence in their figure 7. In dBKR19, turbulence decays from both comparable (Cases I and II) and higher (Cases III and IV) values of
 ${\textit {Re}}_b$, while their
 ${\textit {Fr}}_h$ values are considerably higher than ours.
Time series of (a)  $\langle \varepsilon \rangle$ and
 $\langle \chi \rangle$, both normalized by
 $U_0^3/D$, (b)
 $\varGamma$, (c)
 $\ell _O$ and
 $\ell _T$, both normalized by
 $D$, and (d)
 $\ell _O/\ell _T$. Grey dash-dotted lines in panels (a,b) indicate
 $Nt=5$ and
 $13$, respectively.

Time series of the flux coefficient,  $\varGamma =\langle \chi \rangle /\langle \varepsilon \rangle$, is presented in figure 4(b). Initially,
 $\varGamma$ starts at a low value of 0.09 at
 $Nt=1$. As buoyancy effects become more dominant and the wake turbulence enters the layering phase,
 $\varGamma$ increases quickly and reaches a plateau by
 $Nt\approx 5$. The value of
 $\varGamma$ fluctuates weakly within 0.45–0.49 before it begins a steady decline after
 $Nt=13$. In their homogeneous turbulence study, dBKR19 observed a period in which
 $\varGamma$ only weakly oscillates with time before it drops (see their figure 8). The present wake data suggest peak
 $\varGamma$ values of 0.45–0.49, comparable to the asymptotic value (at large
 ${\textit {Re}}_b$) of 0.54 observed by dBKR19. A comparison can also be drawn with the findings of Chongsiripinyo & Sarkar (Reference Chongsiripinyo and Sarkar2020), who conducted simulations of disk wakes at
 ${\textit {Re}}=5\times 10^4$. Their figure 20 indicates that while initially
 $\langle \chi \rangle \ll \langle \varepsilon \rangle$ in the near wake (implying
 $\varGamma \ll 1$),
 $\langle \chi \rangle$ gradually approaches while remains smaller than
 $\langle \varepsilon \rangle$ as the turbulence enters the SST regime, suggesting a plateauing
 $\varGamma$ value similar to that observed in the sphere wake.
3.2. Thorpe versus Ozmidov scales
A relevant length scale that characterizes the turbulent overturning events is the Thorpe scale,  $\ell _T$, which has been explored in discussions on mixing efficiency (e.g. Smyth, Moum & Caldwell Reference Smyth, Moum and Caldwell2001; Mashayek, Caulfield & Peltier Reference Mashayek, Caulfield and Peltier2017). For the wake data,
 $\ell _T$ is determined by the root mean square of the vertical displacement (
 $\delta _T$) of fluid parcels from their equilibrium position in the ‘sorted’ density profile, i.e.
 $\ell _T\equiv \langle \delta _T^2 \rangle ^{1/2}$. We adopted the ‘sorting’ procedure of Mashayek et al. (Reference Mashayek, Caulfield and Peltier2017) (hereafter MCP17) to compute
 $\ell _T$ (or
 $L^{\textrm {3D}}_T$ in MCP17's notation).
We analyze the temporal evolution of  $\ell _T$ alongside
 $\ell _O$ in figure 4(c). Unlike
 $\ell _O$, which exhibits a monotonic decay mirroring the trend in
 $\langle \varepsilon \rangle$ (figure 4a),
 $\ell _T$ increases between
 $Nt=1$ and 2, before subsequently decreasing. The peak of
 $\ell _T$ at
 $Nt=2$ is noteworthy, as it corroborates elements of Spedding (Reference Spedding1997)'s heuristic reasoning on the ‘non-equilibrium’ (NEQ) regime. During the transition from the fully turbulent early wake to the NEQ regime, Spedding noted a reduced decay rate in the mean centreline velocity
 $U_c$ (see his figure 7). Without density measurements, Spedding hypothesized that at
 $Nt\approx 2$, fluid parcels achieve their maximum displacement from the equilibrium position and start to ‘relax back’, thus converting available potential energy (APE) into kinetic energy and slowing down the mean flow's decay. That
 $\ell _T$ peaks at
 $Nt\approx 2$ provides direct evidence to this interpretation.
The time series of the ratio  $\ell _O/\ell _T$ is shown in figure 4(d). Aside from a brief levelling off when the turbulence transitions to the layering phase around
 $Nt\approx 4$,
 $\ell _O/\ell _T$ exhibits an almost monotonic and considerably weak decline over time, maintaining a value below unity. This contrasts markedly with the scenario of the weakly stratified, KH-driven cases studied by MCP17, where
 $\ell _O/\ell _T$ begins at a low value of
 $O(0.1)$ and then increases rapidly as the KH billow rolls up and transitions to turbulence, eventually exceeding one, i.e.
 $\ell _O>\ell _T$. The pattern shown for the wake in figure 4 reverses the progression in time observed in the KH case:
 $\ell _T$, initially comparable to
 $\ell _O$, peaks early in the wake at
 $Nt\approx 2$ and then diminishes over time as fluid parcels gradually return to equilibrium, releasing the system's APE. The faster decay rate of
 $\ell _O$, driven by the rapid dissipation of TKE, results in an increasing separation between
 $\ell _T$ and
 $\ell _O$, which results in
 $\ell _O\le \ell _T$ for the entire time. The range of the
 $\ell _O/\ell _T$ ratio exhibited by this specific wake is relatively narrow, spanning from 0.3 to 1. In contrast, the shear layer cases investigated in MCP17 showed a wider range of
 $\ell _O/\ell _T$ ratios, from approximately 0.1 to 10 (e.g. see their figure 6).
3.3. Parametrization of $\varGamma$

In a seminal paper, Shih et al. (Reference Shih, Koseff, Ivey and Ferziger2005) introduced a scaling for  $\varGamma$ based on
 ${\textit {Re}}_b$. Later, Ivey, Winters & Koseff (Reference Ivey, Winters and Koseff2008) suggested that additional parameters might be necessary to capture the complexities in the flow, such as intermittency. The wake data, shown in figure 5(a), are categorized into the ‘molecular’ and ‘transitional’ regimes according to the
 ${\textit {Re}}_b$-based scaling. For these regimes, Bouffard & Boegman (Reference Bouffard and Boegman2013) revised the
 $\varGamma$–
 ${\textit {Re}}_b$ scaling using field data (see their figure 9). Although the wake data exhibit the anticipated increasing trend with
 ${\textit {Re}}_b$ for
 ${\textit {Re}}_b\lesssim 3$, the peak
 $\varGamma$ values, ranging from 0.45 to 0.49, are considerably higher than the maximum value of 0.20 predicted by the scaling and widely accepted by field studies as a constant (Gregg et al. Reference Gregg, D'Asaro, Riley and Kunze2018; Monismith, Koseff & White Reference Monismith, Koseff and White2018). Nevertheless, the wake data are largely in alignment with data from forced simulations in strong stratification for a similar range of
 ${\textit {Re}}_b$ and
 ${\textit {Fr}}_h$ (Maffioli et al. Reference Maffioli, Brethouwer and Lindborg2016; Howland et al. Reference Howland, Taylor and Caulfield2020).
 $\varGamma$ plotted against (a)
 ${\textit {Re}}_b$, (b)
 ${\textit {Fr}}_h$ and (c)
 ${\textit {Fr}}_t$. Grey triangles in panels (a,b) are data from Maffioli et al. (Reference Maffioli, Brethouwer and Lindborg2016), circles in panels (a,c) from Howland et al. (Reference Howland, Taylor and Caulfield2020), dotted line in panel (a) proposed by Bouffard & Boegman (Reference Bouffard and Boegman2013) and dash-dotted line in panel (c) proposed by Garanaik & Venayagamoorthy (Reference Garanaik and Venayagamoorthy2019). Note that Maffioli et al. (Reference Maffioli, Brethouwer and Lindborg2016)'s
 ${\textit {Fr}}_h$ values are adjusted by a factor of 0.5 to account for differences in the definition of
 $\ell _h$; only cases with overlapping ranges of
 ${\textit {Re}}_b$ and
 ${\textit {Fr}}_h$ are displayed.

The decline of  $\varGamma$ with
 ${\textit {Re}}_b$ in the range
 $10<{\textit {Re}}_b<20$, as observed in figure 5(a), is primarily associated with the initial phase of the wake's development. This specific reduction in
 $\varGamma$ with
 ${\textit {Re}}_b$ is influenced by the transient adjustment to stratification. For wakes with larger
 ${\textit {Re}}$ than the present case, the initial
 ${\textit {Re}}_b$ during this transient is expected to be higher. Consequently, the observed drop in
 $\varGamma$ for
 $10<{\textit {Re}}_b<20$ should be considered specific to this particular wake and not indicative of a general trend between
 $\varGamma$ and
 ${\textit {Re}}_b$.
Garanaik & Venayagamoorthy (Reference Garanaik and Venayagamoorthy2019) suggested a constant  $\varGamma =0.5$ for small turbulent Froude numbers,
 ${\textit {Fr}}_t\equiv \langle \varepsilon \rangle /Nk \ll 1$, where
 $k\equiv \langle |\boldsymbol {U}'|^2\rangle /2$ is the TKE. Howland et al. (Reference Howland, Taylor and Caulfield2020) demonstrated that for small
 ${\textit {Fr}}_t$,
 $\varGamma$ exhibits a non-trivial dependence on the forcing mechanism. As shown in figure 5(c), our observed peak
 $\varGamma$ values between 0.45 and 0.49 are consistent with the proposed
 $\varGamma =0.5$, while accurately modelling the rest of the data below this optimal range of
 $\varGamma$ appears to require additional parameters.
The length ratio  $\ell _O/\ell _T$ discussed in § 3.2 could serve as an indicator of mixing efficiency in time-dependent scenarios. Using DNS and field data from weakly stratified mixing layers, MCP17 argued that mixing can be ‘the most active and efficient’ when
 $\ell _O/\ell _T\sim 1$. In this context,
 $\ell _O$ represents the largest eddies not suppressed by buoyancy, and
 $\ell _T$ is the scale at which APE is injected through stirring. Optimal mixing is achieved when the two scales match in magnitude. Figure 6 tests if MCP17's argument extends to the strongly stratified scenario considered here. Figure 6(a) suggests that
 $\langle \chi \rangle$ exhibits a distinct peak, i.e. mixing is the most ‘active’, for
 $\ell _O/\ell _T\simeq 0.55$. Similarly, figure 6(b) suggests that
 $\varGamma$ plateaus, i.e. mixing is the most ‘efficient’, for
 $0.37\lesssim \ell _O/\ell _T\lesssim 0.52$. The observation that mixing is energy efficient when
 $\ell _O<\ell _T$ appears consistent with MCP17's figure 7, where large values of
 $\varGamma$ (up to
 $1.0$) occur consistently between the diagonal lines marking
 $\ell _O/\ell _T=0.25$ and
 $1.0$. The optimal
 $0.45\leq \varGamma \leq 0.49$ in the strongly stratified wake appears to be even larger than the
 $\varGamma \simeq 1/3$ value proposed by Mashayek, Caulfield & Alford (Reference Mashayek, Caulfield and Alford2021) for the ‘Goldilocks’ mixing induced by weakly stratified, overturning oceanic shear layers.
Variation of (a)  $\langle \chi \rangle$ and (b)
 $\varGamma$ with
 $\ell _O/\ell _T$.

4. Conditional sampling of $\varGamma$ versus $Ri$


4.1. Formulation
As discussed in § 1, there are at least two reasons to explore beyond bulk statistics and pursue subsampling of  $\varGamma$ across various regions of the flow volume. First, stratified turbulence is intermittent (e.g. as noted by Ivey et al. Reference Ivey, Winters and Koseff2008), with ‘turbulent’ and ‘laminar-like’ regions coexisting. Averaging over these regions without distinction may lead to uncertainties in the overall statistics. Second, conditional sampling enables ‘controlled’ parametric analysis of
 $\varGamma$ based on locally defined parameters, while the bulk parameters remain constant by definition.
We will present conditional sampling results for the wake using Richardson number,  ${\textit {Ri}}$, to characterize the local dynamics. This parameter, which can take various forms, was used extensively in pioneering studies in stratified mixing (see e.g. reviews by Linden Reference Linden1979; Fernando Reference Fernando1991; Peltier & Caulfield Reference Peltier and Caulfield2003). When expressed as the gradient Richardson number,
 ${\textit {Ri}}$ is intrinsically linked to the stability of stratified shear flow. Recent efforts in understanding stratified turbulence through the lens of self-organized criticality (SOC) (Salehipour, Peltier & Caulfield Reference Salehipour, Peltier and Caulfield2018; Smyth, Nash & Moum Reference Smyth, Nash and Moum2019) have focused on turbulence's self-organization around a criticality marked by
 ${\textit {Ri}}=1/4$. In this context, Z22 introduced a locally defined
 ${\textit {Ri}}$ to detect SOC-like dynamics within the wake flow being studied. The flow field is decomposed into large- and small-scale components (see figure 3 of Z22) through spatial filtering, i.e.
 \begin{equation} \boldsymbol{U}(\boldsymbol{x},t)=(\bar{U},\bar{V},\bar{W})+(u,v,w). \end{equation}
The coarse-grained flow field,  $\bar {\boldsymbol {U}}(\boldsymbol {x}, t)\equiv (\bar {U},\bar {V},\bar {W})$, retains scales larger than
 $\ell _O$ and thus are not prone to overturn. Mixing can be interpreted as stemming from the ‘instability’ of the large-scale flow
 $\bar {\boldsymbol {U}}(\boldsymbol {x}, t)$ which leads to overturns at scales smaller than
 $\ell _O$ represented by the residual flow field,
 $(u,v,w)$. The ‘stability’ of
 $\bar {\boldsymbol {U}}(\boldsymbol {x}, t)$ can be characterized by the large-scale gradient Richardson number,
 \begin{equation} \textit{Ri}(\boldsymbol{x}, t) \equiv \frac{N^2}{\bigg( \dfrac{\partial \overline U}{\partial z} \bigg)^2 + \bigg(\dfrac{\partial \overline V}{\partial z} \bigg)^2}. \end{equation}
Z22 observed the coexistence of ‘stable’ ( ${\textit {Ri}}>1/4$) and ‘unstable’ (
 ${\textit {Ri}}<1/4$) zones within the flow (see his figure 4). To assess the dependence of
 $\varGamma$ on
 ${\textit {Ri}}$, we define a conditional flux coefficient,
 $\tilde {\varGamma }\equiv \tilde {\chi }/\tilde {\varepsilon }$, where
 $\tilde {\chi }$ and
 $\tilde {\varepsilon }$ are the averages of
 $\chi$ and
 $\varepsilon$ over regions with approximately constant
 ${\textit {Ri}}$ values. In these regions, the local
 ${\textit {Ri}}$ falls in the close neighbourhood of a specific value, and such small intervals of
 ${\textit {Ri}}$ are referred to as the
 ${\textit {Ri}}$ ‘bins’. The analysis covers three time instances (table 1) in the wake. Only regions within the wake core, i.e. (2.2), are included in the subsampling. To capture intermittency, we also exclude regions where
 $\varepsilon \le \nu N^2$ locally, ensuring that the subsampling reflects dynamics not predominantly influenced by viscosity.
Parameters describing flow instances for detailed analysis in § 4.

The spatial distribution of  ${\textit {Ri}}$ on the
 $oxz$ plane is illustrated in figure 7 through three representative snapshots previously examined in figure 3. Unlike
 $\varepsilon$ and
 $\chi$, which are shown in figure 3 and vary significantly over time, the structure of
 ${\textit {Ri}}$ remains qualitatively consistent across these snapshots. A dark red band at the top and bottom of each image, indicating
 ${\textit {Ri}}\gg 1$, corresponds to volumes outside the turbulent wake core where vertical shear is absent. Within the turbulent wake core, regions of local
 ${\textit {Ri}}$ spanning several orders of magnitude coexist. These patches of either large (
 $\gg 1$) or small (
 $\ll 1$)
 ${\textit {Ri}}$ exhibit a certain degree of spatial coherence and are typically elongated in the horizontal
 $x$ direction while being narrow in the vertical
 $z$ direction. This pattern underscores the influence of strong anisotropy (
 ${\textit {Fr}}_h\ll 1$; as indicated in figure 2b) on the flow structure.


4.2. Results
The three instances considered here span various stages of the wake turbulence (figure 2b). Instance A occurs at  $Nt=2$, corresponding to the peak in
 $\langle \chi \rangle$, whereas instances B and C are situated within the plateau phase of
 $\varGamma$, marking the period of highest bulk mixing efficiency. According to figure 8(a), the three instances record approximately the same total volume of ‘turbulent’ region that meets the condition
 $\varepsilon >\nu N^2$, while bulk turbulence parameters, particularly
 ${\textit {Re}}_b$, have varied significantly between these times (figure 2b or table 1). The statistical distribution of
 ${\textit {Ri}}$, shown in figure 8(b), demonstrates a rightward shift in its left flank of smaller
 ${\textit {Ri}}$ values over time, indicating a trend towards increased flow stability. Figure 8(b) suggests that, during the layering phase, instances B and C display a greater volume of ‘turbulent’ regions where the flow is considered ‘stable’, i.e.
 ${\textit {Ri}}\sim O(1)$ and above, as compared with instance A. This suggests a predominance of strongly stratified, self-organized dynamics during this stage (as discussed in Z22).
(a) Cumulative volume of ‘turbulent’ ( $\varepsilon >\nu N^2$) regions in the wake core, i.e. (2.2), where its local
 ${\textit {Ri}}$ is less than a specified value. (b) Incremental volume within each bin plotted against the right edge of the bin. The solid dots on the curves mark the edges of the
 ${\textit {Ri}}$ bins. Volume is normalized by the total volume of the computational domain. (c) Conditional flux coefficient,
 $\tilde {\varGamma }=\tilde {\chi }/\tilde {\varepsilon }$, as a function of
 ${\textit {Ri}}$.

Figure 8(c) displays the flux coefficient,  $\tilde {\varGamma }\equiv \tilde {\chi }/\tilde {\varepsilon }$, as it varies with
 ${\textit {Ri}}$, for three time instances in the flow. The form of such a flux-gradient relation has long been an open question, for which Caulfield (Reference Caulfield2021) conjectured a few possible scenarios in his figure 1(a). The patterns observed in figure 8(c) align with the scenario where
 $\tilde {\varGamma }$ initially increases with
 ${\textit {Ri}}$ for smaller values of
 ${\textit {Ri}}$, corresponding to the ‘left flank’ of the flux-gradient curve, and approaches a relatively constant value for
 ${\textit {Ri}}>1$. This behaviour echoes the predictions of Balmforth, Llewellyn Smith & Young (Reference Balmforth, Llewellyn Smith and Young1998) in their phenomenological model on buoyancy layering influenced by mixing. They suggested that under a scenario of constant power input for stirring per unit mass of fluid, the buoyancy flux should rise monotonically with the gradient and eventually level off for large gradients, which is remarkably consistent with figure 8(c). In the context of this wake flow, where the only external energy input is through the energy imparted by the initial condition (§ 2.1), the source of power may only be the local production of TKE via buoyancy-driven shear instabilities (Diamessis et al. Reference Diamessis, Spedding and Domaradzki2011, ZD19). Assuming this energy input rate remains approximately uniform across the flow volume at any given time, the agreement with the ‘constant-power’ situation hypothesized by Balmforth et al. (Reference Balmforth, Llewellyn Smith and Young1998) could be more than mere coincidence. The monotonic flux-gradient relation shown in figure 8(c) would also exclude the Phillips mechanism for the formation of density layers, which requires such a relation to be non-monotonic (see e.g. review by Caulfield Reference Caulfield2021). In deriving the flux-gradient relation shown in figure 8(c), regions where
 $\varepsilon <\nu N^2$, comprising approximately 15 % to 24 % of the wake's core region, were excluded to ensure the results represent truly ‘turbulent’ regions. However, sensitivity tests (not shown) suggest that the qualitative features observed of the flux-gradient curve would remain consistent even if calculations included the entire wake core region, as defined by (2.2). This consistency arises because the laminar-like regions contribute relatively minor amounts to the overall dissipation, specifically, approximately 5 %–15 % of
 $\varepsilon$ and 5 %–21 % of
 $\chi$ from regions where
 $\varepsilon <\nu N^2$.
Some further observations can be made on figure 8(c). The asymptotic values of  $\tilde {\varGamma }$ for
 ${\textit {Ri}}>1$ show slight variations across the three time instances, as tabulated in table 1. These values exceed the plateau value
 $\varGamma =0.33$ (or equivalently, a flux Richardson number
 ${\textit {Rf}}\equiv \varGamma /(1+\varGamma )=0.25$) suggested by Venayagamoorthy & Koseff (Reference Venayagamoorthy and Koseff2016) for data with
 ${\textit {Ri}}\le 1$. Such elevated
 $\tilde {\varGamma }$ values for large
 ${\textit {Ri}}$ are also reminiscent of Couchman, de Bruyn Kops & Caulfield (Reference Couchman, de Bruyn Kops and Caulfield2023)'s recent observation of large local
 $\varGamma$ associated with sharp stable density interfaces in a forced DNS. Instances B and C demonstrate bulk
 $\varGamma$ values (table 1) that align closely with the asymptotic values of
 $\tilde {\varGamma }$ for
 ${\textit {Ri}}>1$, a reflection of the substantial volume of flow within this
 ${\textit {Ri}}$ range (figure 8b). In contrast, instance A has more volume occupying the low-
 ${\textit {Ri}}$ range on the flux-gradient curve's left flank (figure 8c), leading to a bulk
 $\varGamma$ considerably lower than the corresponding asymptotic value for
 ${\textit {Ri}}>1$ (table 1).
The data presented in figure 8(c) explore the efficiency at which mixing occurs at regions of varying local  ${\textit {Ri}}$. Figure 9 further investigates the cumulative contribution to the overall
 $\varepsilon$ and
 $\chi$ from regions of various values of
 ${\textit {Ri}}$. This analysis specifically targets turbulent regions (
 $\varepsilon >\nu N^2$) in the wake's core region as defined by (2.2). In general, the most significant contribution to the dissipation occurs within regions of
 ${\textit {Ri}}$ values of
 $O(0.1)$ to
 $O(10)$, while regions of either very large (
 $\gg 1$) or small (
 $\ll 1$)
 ${\textit {Ri}}$ contribute minimally. This observation, to a certain extent, echoes the recent work of Petropoulos et al. (Reference Petropoulos, Couchman, Mashayek, de Bruyn Kops and Caulfield2024), who found in forced stratified turbulence simulations a predominant contribution to
 $\chi$ from regions classified as ‘small-scale structures’ and smaller contributions from ‘strongly stratified interfaces’ and ‘large-scale inversions.’
Cumulative contribution to (a)  $\varepsilon$ and (b)
 $\chi$, expressed as a fraction of the total within the wake's core region, from regions where the local
 ${\textit {Ri}}$ is below a given threshold.

5. Concluding remarks
We examined time-dependent mixing in an unforced, inhomogeneous, freely evolving turbulent flow, specifically under strong stratification where layering dynamics is prevalent. The irreversible, volume-averaged flux coefficient,  $\varGamma$, exhibits low initial values as the turbulence transitions towards the layering phase, a plateau once layering is established and a subsequent decline as viscous effects gain prominence (figure 4b). The plateau value of
 $\varGamma$ between 0.45 and 0.49 aligns with the growing consensus in the literature that under strong stratification,
 $\varGamma$ values considerably larger than 0.20 are achievable (e.g. Maffioli et al. Reference Maffioli, Brethouwer and Lindborg2016; Garanaik & Venayagamoorthy Reference Garanaik and Venayagamoorthy2019; Howland et al. Reference Howland, Taylor and Caulfield2020; Lewin & Caulfield Reference Lewin and Caulfield2024). The particularly efficient mixing observed could be explained using the generic argument made by MCP17 on the role of the overturning scale
 $\ell _O$ and the APE-injecting scale
 $\ell _T$ in determining mixing efficiency. Consistent with MCP17 who focused mainly on weakly stratified scenarios, we found that the
 $\varGamma$ plateau in this strongly stratified flow occurs when
 $\ell _O$ is a fraction (0.37–0.52) of
 $\ell _T$ (figure 6b). However, given the narrow range of the
 $\ell _O/\ell _T$ ratio observed in this dataset (§ 3.2), a comprehensive comparison to the Goldilocks paradigm of mixing parametrization (Mashayek et al. Reference Mashayek, Caulfield and Alford2021) may not be feasible with this study alone. Determining whether the Goldilocks parametrization, derived mostly from weakly stratified scenarios, applies equally to mixing in the SST/LAST regime (Maffioli & Davidson Reference Maffioli and Davidson2016; Lewin & Caulfield Reference Lewin and Caulfield2024) requires further investigation with additional data under such strongly stratified conditions.
A limitation of this study is its focus on a single value of  ${\textit {Re}}$. The LES conducted by ZD19 covered three different Reynolds numbers (up to
 ${\textit {Re}}=400\,000$). Since those simulations are LES and not DNS, deriving direct estimates of
 $\chi$ and
 $\varepsilon$ poses a challenge. However, if one acknowledges that the large
 $\varGamma$ values (up to 0.49) observed in the current study represent a generic feature of the SST/LAST regimes, ZD19's proposed scaling of a
 ${\textit {Re}}{\textit {Fr}}^{-2/3}$ threshold for entering these strongly stratified regimes becomes relevant for mixing predictions. The ZD19 scaling could aid in predicting where in the
 ${\textit {Re}}$–
 ${\textit {Fr}}$ parameter space large
 $\varGamma$ values are likely to occur, thereby facilitating a better understanding of the mixing generated by high-
 ${\textit {Re}}$ stratified geophysical wakes.
This study also underscores the challenge of simplifying the behaviour of  $\varGamma$ to a single parameter (figure 5). This complexity of the parameter space necessitates controlled studies to examine the influence of various parameters independently. Our approach of conditional subsampling, as detailed in § 4, might provide a viable option for such investigations. By conditionally sampling against the local
 ${\textit {Ri}}$ within a controlled setting, we discovered a generic flux-gradient relationship. This relation, long conjectured theoretically (Balmforth et al. Reference Balmforth, Llewellyn Smith and Young1998), now receives support from DNS (figure 8c). Looking ahead, it is intriguing to consider whether this flux-gradient relation could apply to other types of flows or in reduced-order models (e.g. Chini et al. Reference Chini, Michel, Julien, Rocha and Caulfield2022) and how the free parameters in the flux-gradient relation might be calibrated in relation to bulk flow characteristics, such as the input energy rate through external stirring or internal shear production. Due to computational constraints, the
 ${\textit {Re}}_b$ values considered in existing strongly stratified DNS studies on mixing, including the present one, are capped at
 $O(10)$ (figure 5a); future research could certainly benefit from exploring larger-
 ${\textit {Re}}_b$ scenarios while keeping
 ${\textit {Fr}}_h$ or
 ${\textit {Fr}}_t$ small.
In the present study, the subsampling of  $\varGamma$ is conditioned upon the local Richardson number
 ${\textit {Ri}}$. As suggested by Caulfield (Reference Caulfield2021), strongly stratified flows might exhibit alternating layers with different levels of background stratification. This condition facilitates a framework for subsampling mixing properties based on local estimates of
 $N^2$. In particular, the latter approach might help reconcile the apparent difference in the
 $\ell _O/\ell _T$ ratios corresponding to the most efficient mixing observed in the weakly stratified case of MCP17 (i.e.
 $\ell _O/\ell _T\simeq 1$) and the strongly stratified case in this study (i.e.
 $\ell _O/\ell _T\simeq 0.37$ to
 $0.52$). However, no persistent density layering phenomenon was observed for the present wake configuration, which may be related to the absence of non-monotonic behaviour in the observed flux-gradient curve. Implementing the alternative subsampling approach based on local
 $N^2$ is complicated by the lack of clear, persistent layering in this flow and will require careful definition and validation in future studies.
Acknowledgements
I would like to thank the Isaac Newton Institute for Mathematical Sciences, Cambridge, for support and hospitality during the programme Anti-diffusive dynamics: from sub-cellular to astrophysical scales, where this paper was drafted. This programme is supported by EPSRC grant EP/R014604/1. Additionally, my participation was partially supported by a grant from the Simons Foundation. I also thank Professor C. P. Caulfield for his insightful comments on an early draft of this paper.
Funding
This research received support from the Natural Sciences and Engineering Research Council (NSERC) of Canada via a Discovery Grant. Computational resources were partly provided by the Digital Research Alliance of Canada.
Declaration of interests
The author reports no conflict of interest.


 Open access

