Introduction
Bufo arenarum females, as with other anuran amphibians, exhibit a seasonal sexual cycle that is characterized by a breeding or reproductive period and a postreproductive period (Fernández & Ramos, Reference Fernández, Ramos and Jamieson2003).
The postreproductive period, characterized by reproductive system recovery, begins after ovulation and comprises two stages: (i) the early postovulatory period, signalled by folliculogenesis and oviductal development and differentiation; and (ii) the late postovulatory period, marked by the end of oogenesis and the later acquisition of the oocytes maturation capacity (Fernández & Ramos, Reference Fernández, Ramos and Jamieson2003).
The breeding period comprises a preovulatory period in which ovary and oviduct reach maximum development (Winik et al., Reference Winik, Alcaide, Crespo, Medina, Ramos and Fernández1999; Medina et al., Reference Medina, Ramos, Crespo, González-Calvar and Fernández2004) and an ovulatory period in which full grown mature oocytes are released into the coelomic cavity, where they are transitorily stored. These oocytes, called coelomic oocytes, are then transported along the oviduct and finally released for external fertilization.
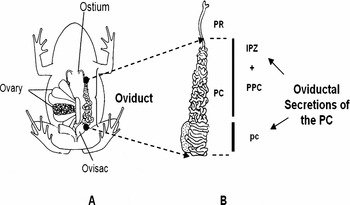
Histological (Moreno, Reference Moreno1972) and ultrastructural studies (Winik et al., Reference Winik, Alcaide, Crespo, Medina, Ramos and Fernández1999) demonstrate that, in Bufo arenarum, the oviduct is divided into three main zones (Fig. 1A, B). The uppermost zone is the pars recta (PR), which collects the ovulated oocytes through an open free ostium in coelomic cavity. The main body of the oviduct called pars convoluta (PC) comprises the intermediate proximal zone (IPZ), a transitional segment of convolute tract, followed by the pars preconvoluta (PPC) and then the pars convoluta (pc) itself. The oviduct ends in the ovisac or uterus where oocytes, now named uterine oocytes (UO), accumulate before oviposition.
(A) Anatomical and functional organization of the reproductive system of the Bufo arenarum female. (B) Oviduct: PC, zones involved in secretion of jelly coat eggs (IPZ, PPC and pc).

Biological studies performed in several anuran species showed that the acquisition of fertilizability depends on the products secreted around the oocytes during their transit through the oviduct (Barbieri & Budeguer de Atenor, Reference Barbieri and Budeguer de Atenor1973; Katagiri, Reference Katagiri1987; Olson & Chandler, Reference Olson and Chandler1999). At the PR level the epithelial secretory cells release to the lumen a low viscosity product that contains a Ca2+-dependent trypsin-like serine protease enzyme named oviductin that, through mild proteolysis, modifies the vitelline envelope (VE) at the structural and molecular levels, rendering the oocyte susceptible to sperm lysin and penetrable by sperm (Miceli et al., Reference Miceli, Fernández and del Pino1978b; Katagiri et al., Reference Katagiri, Iwao and Yoshizaki1982; Miceli & Fernández, Reference Miceli and Fernández1982; Bakos et al., Reference Bakos, Korosky and Hedrick1990).
In the PC, secretory cells located at the epithelial as well as at the glandular level synthesize and secrete the components of the jelly, a highly viscous material sequentially organized as multiple layers around the oocytes, as they traverse the PC. These coats, which together with the VE form the extracellular matrix, have a complex structure composed of a fibrillar stable network of high molecular glycoconjugates and a globular material consisting of low molecular weight proteins, some of which can diffuse from the jelly matrix into the surrounding medium (Bonell et al., Reference Bonell, Reinhart and Chandler1996). Other important diffusing components present in jelly coats are lipids (Diaz Fontdevila et al., Reference Diaz Fontdevila, Bloj and Cabada1991) and the divalent cations Ca2+ and Mg2+, reported only for Bufo bufo japonicus (Ishihara et al., Reference Ishihara, Honoso, Kanatani and Katagiri1984) and Bufo arenarum (M. Medina, personal communication).
Studies performed in a number of amphibian species showed that egg jelly coats components are essential for anuran fertilization (Katagiri, Reference Katagiri1973; Barbieri & del Pino, 1976; Hedrick & Hishihara, Reference Hedrick and Hishihara1991; Omata, Reference Omata1993).
In Bufo arenarum (Barbieri & Oterino, Reference Barbieri and Oterino1972) and Bufo bufo japonicus (Ishihara et al., Reference Ishihara, Honoso, Kanatani and Katagiri1984), it has been demonstrated that the loss of diffusible jelly components causes oocytes to be refractory to fertilization. Additional findings have led to the conclusion that, in Bufo arenarum, the structural matrix components are also essential in this process (Barbieri, Reference Barbieri1976). On the contrary, the studies performed in Xenopus laevis showed that only the small diffusible proteins have a fertilization-promoting activity, while the macromolecules that form the structural matrix appear to be inactive (Olson & Chandler, Reference Olson and Chandler1999). Likewise, the nature and the roles of the components of the jelly coats involved in gamete interaction are, at present, only partially known and data reported show differences according to the amphibian species studied.
Then, in Xenopus laevis, evidence has been provided for diffusible heat-stable proteins that exhibit sperm attraction activity (Al-Anzi & Chandler, Reference Al-Anzi and Chandler1998). These proteins are a fraction of small diffusible proteins of less than 50 kDa that are required during sperm binding to the egg, through an unknown mechanism of action (Olson & Chandler, Reference Olson and Chandler1999) and a glycoprotein that shows calcium-binding properties (Bonell et al., Reference Bonell, Reinhart and Chandler1996). In Lepidobatrachus laevis a glycoprotein that retains Ca2+ and keeps it at a suitable concentration for successful fertilization has been reported (Peavy et al., Reference Peavy, Hernandez and Carroll2003). In Bufo arenarum two highly glycosylated proteins (HGP) secreted along the oviduct were characterized and purified from the jelly coats (Arranz et al., Reference Arranz, Albertali and Cabada1997). Data obtained from this study indicate that the high molecular mass HGP is only a structural component, while the low-molecular-weight isoform (L-HGP) has an acrosome stabilizing effect (Arranz & Cabada, Reference Arranz and Cabada2000; Krapf et al., Reference Krapf, Vidal, Arranz and Cabada2006).
In contrast with these data, in Bufo bufo japonicus it has been proposed that the only function of the egg jelly glycoproteins is to bind the divalent cations Ca2+ and/or Mg2+ around each egg at the level necessary for the induction of the sperm acrosome reaction, while the gamete traverses the jelly coats (Ishihara et al., Reference Ishihara, Honoso, Kanatani and Katagiri1984). This hypothesis has been tested experimentally only in Bufo arenarum. The results obtained show a marked parallel between the loss of the Ca2+ present in the jelly and the decrease in the fertilizability of oocytes. However, the addition of the cation to the insemination media restored partially the fertilization percentages (M. Medina, personal communication). These results suggest that not only Ca2+, but also other still unknown jelly components, are involved in the fertilization process.
In the present study we analysed the macromolecular composition of both the structural matrix and the diffusible components of Bufo arenarum jelly. In addition, we described the protein patterns from different segments of this duct and the changes that occur throughout the sexual cycle.
Materials and Methods
Materials
All reagents were purchased from the Sigma Chemical Co., St. Louis, Missouri, USA.
Animals
Sexually mature Bufo arenarum females of between 100 and 150 g body weight were collected in the neighbourhood of San Miguel de Tucumán, Argentina and used immediately after capture or stored at 15–20 °C in a moist chamber until use.
This study was performed with specimens captured during the following periods of the sexual cycle: (i) the preovulatory period (n = 4), immediately before ovulation; (ii) the ovulatory period (n = 4), just after the transit of the oocytes through the duct; (iii) the early postovulatory period (n = 4), 7 days after oviposition; and (iv) the late postovulatory period (n = 4), during hibernation. Specimens from the preovulatory and ovulatory periods were selected after careful control of the ovaric state and ovulation signs.
Ovulation was achieved either spontaneously or induced by intraperitoneal injection of a suspension of homologous hypophysis (Houssay et al., Reference Houssay, Giusti and Lascano González1929) preserved according to Pisanó (Reference Pisanó1956). Twelve hours after induction, strings of oocytes surrounded by their jelly coats were removed from the ovisacs.
Biological material
Oviductal secretions of the PC
In order to describe the biochemical components of the secretion released into the oviductal lumen before and after the passage of the oocytes, the PC of females captured during the preovulatory, early postovulatory and late postovulatory periods were divided into two zones: (i) the first one that included the IPZ and the PPC (IPZ + PPC); and (ii) the remaining portion of the PC (pc) (Fig. 1A, B).
The samples were obtained by perfusion. In order to do that, each zone was ligated in situ at both ends in order to avoid any contamination with secretions from neighbouring zones. Two cannulae were arranged, one at the upper end for flushing a buffered amphibian Ringer's solution (110 mM NaCl, 1.4 mM CaCl2, 2 mM KCl) containing 10 mM Tris–HCl pH 7.6 and the other at the lower end to take up the perfusion product.
Full jelly
In order to analyse the composition of the full jelly (FJ), strings of oocytes immediately after their passage through the oviduct were carefully removed from the uterus to prevent any contamination with blood or broken eggs and placed into a Petri dish. The samples were treated with 25 mM β-mercaptoethanol 10 mM Tris–HCl pH 7.6 (1:3 w/v) to solubilize the jelly coats. The process, controlled through a stereoscopic microscope, was allowed to continue until the complete solubilization of jelly coats while verifying the integrity of the VE. Although preliminary experiments carried out in our laboratory using 100 mM β-mercaptoethanol 10 mM Tris–HCl pH 7.6 (1:3 w/v) were also effective to obtain the jelly material, the concentration of 25 mM was selected taking into account that even if solubilization is slower, it enables better visualization of the process. The FJs obtained were isolated by decantation of the oocytes.
Diffusible factor and washed jelly
Three lots of UO surrounded by their jelly coats were used to obtain the products that diffuse from these layers, hereafter named diffusible factor (DF). The strings of oocytes were washed with deionized water (1:1 w/v), 10% Ringer's solution (1:1 w/v) or 1.5× OR2 buffer (12.4 mM NaCl, 3.75 mM KCl, 1.5 mM CaCl2, 1.5mM MgCl2, 1.5 mM Na2HPO4 and 10 mM HEPES) (1:1 w/v) adjusted to pH 8.5 containing a proteolytic inhibitor cocktail 200 μg/ml phenylmethylsulphonyl fluoride (PMSF), 15 μg/ml leupeptin and 15 μg/ml pepstatin A (Olson & Chandler, Reference Olson and Chandler1999). For DF attainment by using deionized water (DF1) or 10% Ringer's solution (DF2) the samples were submitted to two extractions of 30 min each one at room temperature with fresh solution and under gentle agitation. The extraction of DF with 1.5× OR2 buffer (DF3) was performed by means of two washes, each one of 6 h at 4 °C with fresh buffer under gentle agitation.
The DFs obtained were separated by decanting the strings of oocytes extracted with the different media. The remaining jelly coats deprived of the diffusible component, that is the washed jelly (WJ), were solubilized with 25 mM β-mercaptoethanol 10 mM Tris–HCl pH 7.6. The process, controlled by stereoscopic microscope, was allowed to continue until the attainment of the corresponding solubilized jellies, named WJ1, WJ2 and WJ3 according to the wash medium used, which were then isolated by decanting the oocytes.
Dialysis
Immediatelly after obtainment, all the samples were dialyzed against 1 mM Tris–HCl pH 7.6 for 48 h to 4 °C, with constant agitation. The tubing dialysis retained most proteins of relative molecular mass (Mr) of 12 kDa or greater. Later the samples were lyophilized and stored at −20 °C.
Protein determination
Protein concentrations of the samples were determined according to the method of Lowry et al. (Reference Lowry, Rosebrough, Farr and Randall1951), using bovine serum albumin as a standard.
Determination of the lactate dehydrogenase (LDH) enzyme
In order to prevent contamination of the FJ, WJ and DF samples with components of cytoplasm oocytes that might be released by cell death or damage to the plasma membrane during the process of their obtainment, the enzymatic activity of LDH was determined using Noll's technique (Reference Noll, Bergmeyer and Grassl1984).
Polyacrylamide gel electrophoresis
Aliquots of FJ, DF1, DF2 and DF3 and the samples obtained by perfusion of IPZ + PPC and pc were suspended in sample buffer containing 500 mM Tris–HCl pH 6.8, 10% SDS, 20% sucrose, 0.05% bromophenol blue with the addition of 2% β-mercaptoethanol in order to carry out the determinations under reducing conditions. Samples were denatured by heating in a boiling water bath for 10 min.
Solubilized washed jellies were suspended in urea buffer containing 9 M urea, 2% β-mercaptoethanol and 4% sucrose for 2 h at room temperature with agitation.
SDS–PAGE was performed according to the method of Laemmli (Reference Laemmli1970), using a MiniProtean II® apparatus (Bio-Rad Laboratories). Aliquots of samples containing 30–40 μg of total protein were run on both 4% and 9 or 8% acrylamide resolving gels, with 3.5% stacking gels. Runs were carried out at 2 mA per lane using the PS 3010–2 power supply, Sigma Aldrich Co. To estimate Mr, we used protein standards supplied by the Sigma Chemical Co. These proteins were also denatured in sample buffer and heated in a boiling water bath for 10 min. For characterization of the protein profiles, the gels were fixed overnight in a solution prepared with 10% 2-propanol–10% acetic acid, stained with 0.1% coomassie brilliant blue R250 and destained in 10% 2-propanol–10% acetic acid solution with three changes.
The characterization of the glucidic profiles was carried out in FJ, DF1 and WJ1. The presence of neutral carbohydrates was determined using the periodic acid–Schiff method (PAS) (Zacharius et al., Reference Zacharius, Zell, Morrison and Woodlock1969), the acid carbohydrates, predominantly with phosphated, carboxylated and sialylated residues, were revealed with alcian blue (AB) pH 2.5 (Wardi & Michos, Reference Wardi and Michos1972) and the strongly acid carbohydrates with mainly sulphated residues were identified with toluidine blue (TB) pH 1 after fixing the gels with a solution of 12.5% trichloroacetic acid overnight at room temperature.
Quantitative analysis of the protein profiles
The total and relative amounts of individual proteins bands in SDS-PAGE gels were established by using densitometric analysis of slab gels images with a Gel Doc 1000 System and Molecular Analyst 1.4.1 software (Bio-Rad Laboratories). The protein concentration of each band (relative protein concentration) was expressed as the percentage of the concentration corresponding to the peak of the band analysed in relation to the total protein concentration seeded.
Results
SDS-PAGE analysis of oviductal secretion during the sexual cycle is described.
Preovulatory period
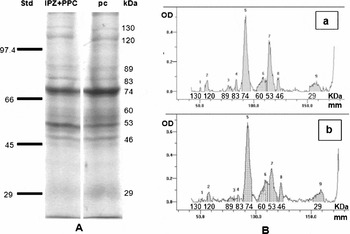
The SDS-PAGE analysis of the secretion released to the oviductal lumen immediately before ovulation showed, by coomassie blue staining, the same electrophoretic patterns with molecules ranging in size from 130 to 29 kDa for both oviductal sectors studied, IPZ + PPC and pc (Fig. 2A). Densitometry revealed the presence of nine peaks (Fig. 2B), the protein of 74 kDa exhibiting the highest optical density (OD) and a relative protein concentration of 40% for IPZ + PPC and 43% for pc.
(A) Electrophoretic patterns of IPZ + PPC and pc secretion samples collected by perfusion during the preovulatory period were analysed by 8% SDS-PAGE under reducing conditions. Each line contains 30 μg of total protein. Relative mobilities were estimated using molecular weight markers purchased from SIGMA. (B) Densitometric analysis from the product profiles of IPZ + PPC (a) and pc (b). Results are representative of four similar experiments.

Other relevant proteins were the 53 and 60 kDa molecules, which showed a relative amount of 25 and 20% for IPZ + PPC and 12 and 14% for pc, respectively.
The other proteins revealed under our experimental conditions had lower OD and relative concentrations below 5%.
Ovulatory period
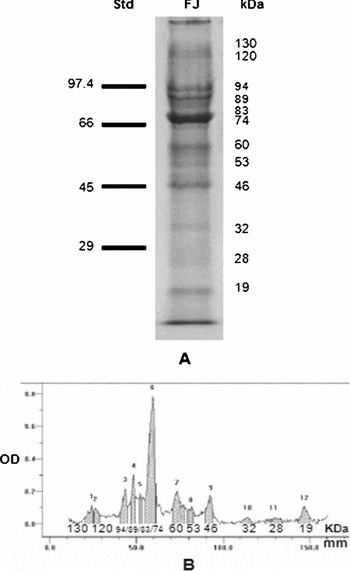
In contrast to what was observed during the preovulatory period, the electrophoretic analysis of the coats organized around the oocytes during their passage through the PC, which represents the FJ containing all the products secreted by this duct, revealed the presence of 12 protein bands (Fig. 3A). The densitometric study enabled us to determine the presence of 12 peaks (Fig. 3B) and showed that peak 6, corresponding to the 74 kDa protein band, presented the highest OD and a relative concentration of 38%. As shown in both figures, other protein bands could be seen with relative concentrations of between 12 and 6%, corresponding to the 60, 46 and 19 kDa proteins and three bands that migrated very close to each other with Mr of about 94, 89 and 83 kDa. The rest of the proteins showed relative concentrations below 4%.
(A) Electrophoretic patterns of FJ from UO during ovulatory period were analysed by 9% SDS-PAGE under reducing conditions. Each line contains 30 μg of total protein. Relative mobilities were estimated using molecular weight markers purchased from SIGMA. (B) Densitometric analysis from the product profiles of FJ from UO. Results are representative of four similar experiments.

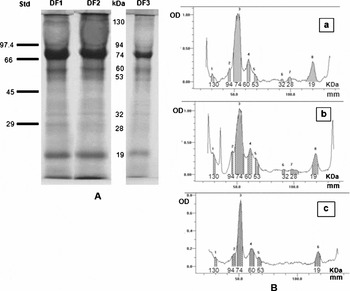
The products that diffuse from the jelly surrounding the UO by treatment with deionized water (DF1) and with 10% Ringer's solution (DF2) showed the same protein profile (Fig. 4A). Densitometric analyses of both preparations revealed the presence of eight peaks (Fig. 4B). Peak 3 of both samples, which presented the highest OD, corresponded to the 74 kDa band and had a relative concentration of 63% for DF1 and 57% for DF2. This analysis also revealed the presence of the 19 and 60 kDa bands, with relative concentrations of 11% and 17% respectively. The other less dense bands showed relative concentrations below 5%.
(A) Electrophoretic patterns of DF1, DF2 and DF3 from UO during ovulatory period were analysed by 9% SDS-PAGE under reducing conditions. Each line contains 30 μg of total protein. Relative mobilities were estimated using molecular weight markers purchased from Sigma. (B) Densitometric analysis from the product profiles of DF1 (a), DF2 (b) and DF3 (c). Results are representative of four similar experiments.

The product diffused obtained from strings of UO treated with 1.5× OR2 buffer (DF3) revealed, similarly to DF1 and DF2, the predominance of the 74 kDa protein with a relative concentration of 53%. However, the densitometric analysis of DF3 only showed the presence of six peaks, with the absence of the 32 and 28 kDa bands.
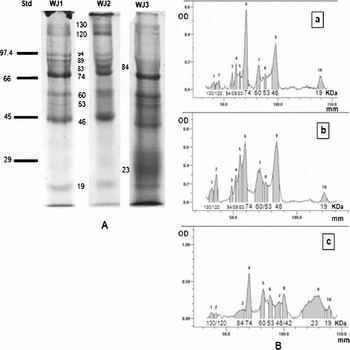
As shown in Fig. 5A, the samples obtained by solubilization of the jelly that had been deprived of the diffusible components after washing with deionized water (WJ1) and 10% Ringer's solution (WJ2) showed the same protein profile. The densitometric analysis revealed in both samples the presence of 10 peaks (Fig. 5B), with predominance of the 74 kDa and 46 kDa bands. However, it should be noted that the 74 kDa protein markedly decreased its concentration with respect to the one determined in FJ and the three DFs. In the same way as FJ, WJ1 and WJ2 presented the well defined band triplet of 94, 89 and 83 kDa, bands with relative concentrations below 8% (60 and 19 kDa) were also found while the rest of the bands showed values lower than 4%.
(A) Electrophoretic patterns of WJ1, WJ2 and WJ3 from UO during ovulatory period were analysed by 9% SDS-PAGE under reducing conditions. Each line contains 30 μg of total protein. Relative mobilities were estimated using molecular weight markers purchased from SIGMA. (B) Densitometric analysis from the product profiles of WJ1 (a), WJ2 (b) and WJ3 (c). Results are representative of four similar experiments.

The solubilized jelly samples obtained after washing with the 1.5× OR2 buffer (WJ3) presented certain differences with respect to the data analysed above. As shown in Fig. 5A, the bands of 94, 89 and 83 kDa defined in FJ, WJ1 and WJ2 were absent, although a broad peak whose relative mobility indicated a molecular mass of 84 kDa appeared (Fig. 5B). The densitometric analysis showed that the 74 and 46 kDa bands decreased one time their relative concentrations with respect to those obtained with WJ1 and WJ2, but two bands of 42 and 23 kDa, absent from the previous samples, now appeared.
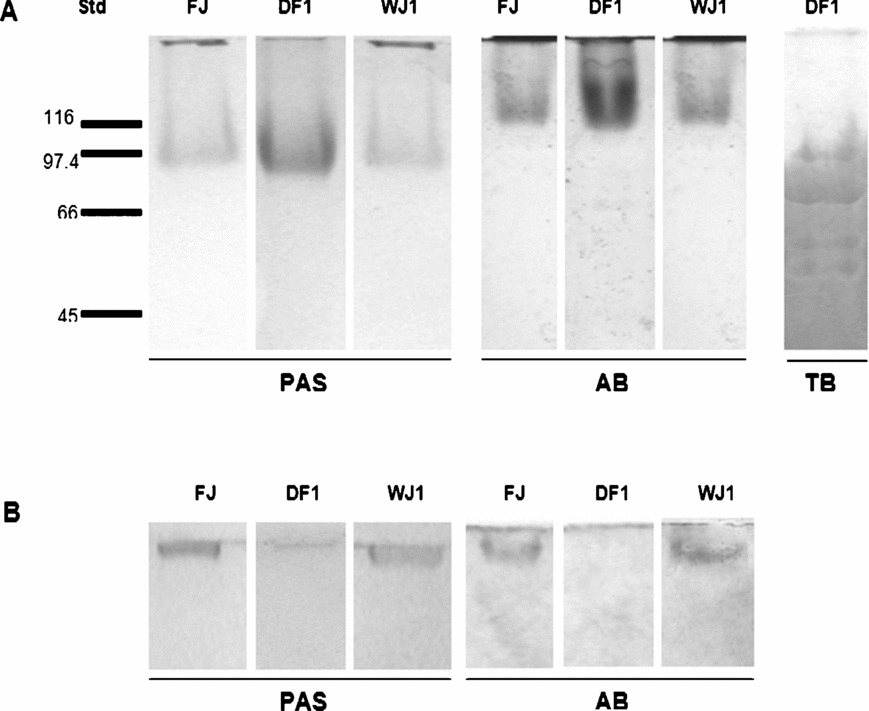
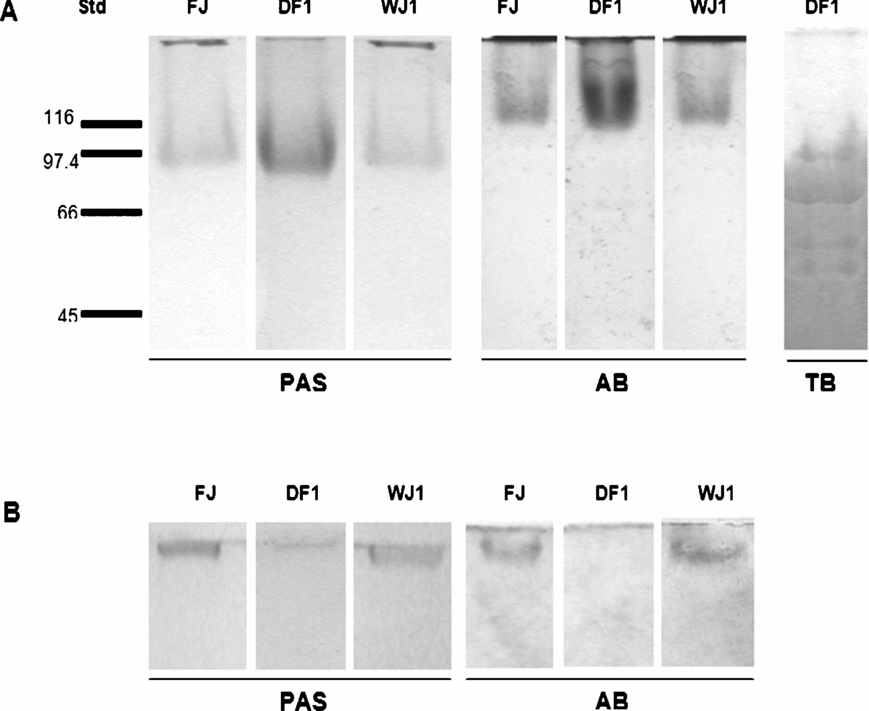
In order to determine the presence of glycoconjugates components, samples of FJ, DF1 and WJ1 were submitted to histochemical staining determinations after SDS-PAGE analysis.
Results showed, in all the samples studied (Fig. 6A), the presence of a PAS-positive band in the 80–100 kDa range corresponding to neutral carbohydrate macromolecules of 94, 89 and 83 kDa. Glycoconjugates AB pH 2.5 positive, of higher Mr (120–130 kDa), were also determined and staining with TB pH 1 revealed the presence of four bands of 94, 74, 60 and 53 kDa.
Electrophoretic patterns of FJ, DF1 and WJ1 from UO during the ovulatory period were analysed with (A) 9% and (B) 4% SDS-PAGE under reducing conditions. Each line contains 30 μg of total protein. Relative mobilities were estimated using molecular weight markers purchased from Sigma. The gels were stained with PAS, AB pH 2.5 and TB pH 1. Results are representative of four similar experiments.
The analysis of FJ, DFs and WJs did not show LDH activity. The absence of contaminating cytoplasm oocyte components in the samples analysed indicated that solubilization or diffusion treatments did not alter the integrity of the plasmatic membrane in these oocytes.
Early postovulatory period
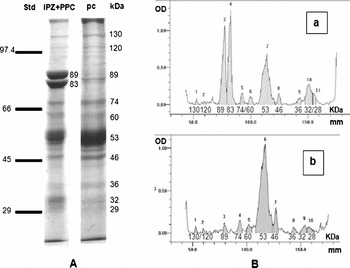
Seven days after ovulation, the secretion obtained by perfusion of the studied zones exhibited some differences in their electrophoretic patterns. At the level of the IPZ + PPC the staining with coomassie blue revealed the presence of 11 protein bands (Fig. 7A). The densitometric analysis indicated that the bands with higher OD, corresponding to the 53, 89 and 83 kDa proteins, represented 29, 24 and 23% of the total protein content (Fig. 7B). With respect to the pc, the electrophoretic analysis revealed the presence of 10 protein bands (Fig. 7A). The absence of the 83 kDa protein band and a marked increase in the relative concentration of the 53 kDa protein band that reached values of 73% were observed (Fig. 7B). The rest of the bands presented relative concentrations lower than 4%. It should be noted that in both zones the 74 kDa protein band, secreted at high concentrations during the preovulatory and ovulatory periods, markedly decreased its secretion to values lower than 3%.
(A) Electrophoretic patterns of IPZ + PPC and pc secretions samples collected by perfusion during the early postovulatory period were analysed by 9% SDS-PAGE under reducing conditions. Each line contains 30 μg of total protein. Relative mobilities were estimated using molecular weight markers purchased from Sigma. (B) Densitometric analysis from the product profiles of IPZ + PPC (a) and pc (b). Results are representative of four similar experiments.

Late postovulatory period
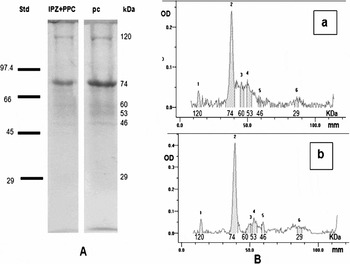
In this period, the secretions obtained from the oviduct in the two sectors analysed showed the same protein profiles, with the presence of six bands, again showing the 74 kDa band (Fig. 8A). Concurrently with these results, the densitometric analysis revealed the presence of six peaks and showed that the 74 kDa protein, which corresponds to peak 2 of both densitograms, presented the highest OD and relative concentration (Fig. 8B). The rest of the protein bands showed remarkably lower values.
(A) Electrophoretic patterns of IPZ + PPC and pc secretions samples collected by perfusion during the late postovulatory period were analysed by 9% SDS-PAGE under reducing conditions. Each line contained 30 μg of total protein. Relative mobilities were estimated using molecular weight markers purchased from Sigma. (B) Densitometric analysis from the product profiles of IPZ + PPC (a) and pc (b). Results are representative of four similar experiments.

High molecular weight bands
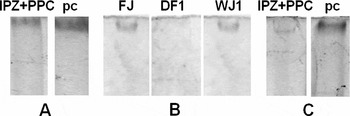
The electrophoretic analysis in gels at 4% of the secretion obtained from the preovulatory and early postovulatory periods showed in both oviductal zones the presence of a protein band of about 300 kDa (Fig. 9A, C). This component was absent in the late postovulatory period. In the jelly coats organized around the UO from the ovulatory period, this band was present only in FJ and WJ1 (Fig. 9B), showing positive reactivity for PAS and AB pH 2.5, but not for TB pH 1 (Fig. 6B).
Electrophoretic analysis on SDS-PAGE under reducing conditions with 4% resolution gel during the following periods: (A) preovulatory, (B) ovulatory and (C) early postovulatory periods. All lines contained 30 μg of total protein. Results are representative of four similar experiments.

Discussion
The data reported in the present work show that the secretion released into the lumen of the PC presents a wide spectrum of proteins that, under our experimental conditions, showed relative molecular masses between 300 and 19 kDa. The coomassie blue staining evidenced that the proteins of 120, 74, 60, 53, 46 and 29 kDa presented a continuous secretion pattern during the whole sexual cycle. Another group, which included the 300, 130, 89 and 83 kDa proteins, was absent only in the late postovulatory period, a stage that corresponds to the hibernation of the species, when the animal is in reproductive rest and with a decreased metabolic activity.
The analysis of the electrophoretic profiles as well as the corresponding densitograms suggest that all the proteins mentioned above presented higher relative concentrations in the product released into the oviductal lumen during the preovulatory and ovulatory periods. These results are supported by previous data obtained by microscopic electronic transmission that showed that, before the passage of the oocytes through the oviduct, the PC reached its maximum degree of development and evidenced marked secretory activity, abundant granular and floccular material that was arranged in a disorganized way as observed in the oviductal lumen (Winik et al., Reference Winik, Alcaide, Crespo, Medina, Ramos and Fernández1999). Considering that during this period the serum levels of testosterone (T), dihydrotestosterone (DHT) and progesterone (P) reached the highest values in the cycle and that it has been demonstrated that P and DHT act as secretagogues (Medina et al., Reference Medina, Ramos, Crespo, González-Calvar and Fernández2004), we may suggest that the abundant protein secretion that characterized this period is hormonally regulated.
In the ovulatory period a differential secretion was observed with respect to the previous stage. The SDS-PAGE analysis of the jelly coats, organized around the oocytes during their passage through the oviduct, allowed us to determine the additional presence of the 94, 32 and 19 kDa proteins, which are only secreted during this period. In agreement with the above, previous ultrastructural studies demonstrated that during the transit of the oocytes an additional secretion that could contain the above proteins, occurred. This secretion would be released from epithelial and glandular secretory cells probably induced not only by hormonal but also by mechanical stimuli, generated by the pressure exerted by the gamete against the walls of this duct while passing through it (Medina et al., Reference Medina, Ramos, Crespo, González-Calvar and Fernández2004).
Our results showed that between the proteins that form the jelly coats, some of them of high and medium Mr (300, 120, 89, 83 and 46 kDa), cannot diffuse with any hydration treatment of these layers. The fact of their being withheld in the matrix suggests for these molecules a structural or in situ function either by themselves or in combination with other stable components. In contrast, proteins of low Mr (32 and 29 kDa) diffused completely, as the washed jelly being deprived of them showed. The rest of the macromolecules analysed diffused only partially and were retained at high concentrations in the structural network independently of the time of extraction. The exception was the 74 kDa protein, which presented a high diffusion capacity. This factor is the reason why, under our experimental conditions, this protein's concentration markedly decreased in the WJs and represented the protein with the highest relative concentration in the DFs. These results indicate that, in agreement with the data obtained for Xenopus laevis (Bonell et al., Reference Bonell, Reinhart and Chandler1996), Bufo arenarum jelly is also made up of proteins of high and medium molecular weight exclusively that are structural or trapped in the stable matrix and of proteins that are capable of diffusing partially or totally from the jelly. In this way the sperm would be in contact with molecules secreted by the PC from the medium surrounding the oocytes until their arrival at the proximity of the plasma membrane.
It is important to point out that the diversity of the proteins secreted into the oviductal lumen is consistent with previous transmission electron microscopy observations. These proteins demonstrated that the secretory cells of the PC presented a high heterogeneity in the electron density of their secretory granules, enabling the formation of an ultrastructural mosaic (Winik et al., Reference Winik, Alcaide, Crespo, Medina, Ramos and Fernández1999). This characteristic may be attributed to the different chemical nature of their contents, as suggested by the histochemical studies performed by light microscopy (Alcaide & Cruz López, Reference Alcaide and Cruz López2002).
The secretion pattern of the PC showed modifications that were associated with the oocytes transit. Then, in the early postovulatory stage, 7 days after ovulation, there was an obvious decrease in the relative concentration of all the protein released into the lumen, especially of the 74 kDa one, which reached minimum values (3%). On the other hand, in the samples analysed we did not observe the presence of the 94, 32 or 19 kDa proteins, which are exclusive of the ovulatory period. These data would be closely related to the fact that the above proteins are massively secreted into the duct lumen and incorporated into the structure of the jelly coats during the transit of the oocytes and suggest that they could play a fundamental role in gamete interaction, an aspect now under study in our laboratory. In agreement with the secretion pattern described, the ultrastructural analysis showed a decrease in the thickness of the epithelial and glandular layers as a result of the decrease in the number of secretory cells (Medina et al., Reference Medina, Ramos, Crespo, González-Calvar and Fernández2004). Observations also showed that the remaining secretory cells exhibited a smaller number of secretory granules, which would account for the scarce secretion (Winik et al., Reference Winik, Alcaide, Crespo, Medina, Ramos and Fernández1999).
Another characteristic of this period, which differentiates it from other stages in the sexual cycle, is that there is a differential secretion between the two zones analysed. Then, the 300 and 53 kDa proteins are mostly secreted by the pc while the 89 and 83 kDa proteins are secreted only by the IPZ + PPC segment. In this respect, it is important to point out that the different zones of the Bufo arenarum PC evidence a different sensibility to ovarian steroids (M. Medina, personal communication). This finding suggests that different hormones acting at the same time can regulate the synthesis and secretion of specific proteins in the segments analysed.
With respect to the late postovulatory period, the results obtained showed scarce secretion with predominance, although at very low concentrations, of the 74 kDa protein. The low functional activity registered at this stage of the sexual cycle suggests that, in the oviductal PC of Bufo arenarum, important metabolic processes would take place that allow in a short time the change from an oviduct with a state of morphological and functional quiescence to a state of maximum development, differentiation and secretory activity characteristic of the preovulatory period.
The histochemical analysis by SDS-PAGE of the jelly coats, performed during the ovulatory period, showed a wide variety of glycoconjugates. Then, the positive reaction to AB pH 2.5 found in the molecules with a Mr of 120–130 kDa indicated the presence of acidic residues mainly of phosphated, carboxylated and/or sialylated nature.
On the other hand, neutral carbohydrates were identified in the bands of 89 and 83 kDa, only reactive to PAS, while the reactivity of the 300 kDa band to PAS and to AB pH 2.5 and of the 94 kDa band to PAS and to AT pH 1 showed the coexistence of acidic and neutral radicals in both molecules. The orthochromasia evidenced with AT pH 1 in the components of 94, 74, 60 and 53 kDa indicated the presence of important molecular masses in relation to limited glucidic residues of strongly acidic nature, principally sulphated. Molecules with these characteristics are known to have a high capacity to bind Ca2+ (Shimoda et al., Reference Shimoda, Kitajima, Inoue and Inoue1994). Considering that in Bufo arenarum the participation of this cation has been demonstrated in gamete interaction (M. Medina, personal communication), the possibility of its binding to proteins of the jelly with capacity to diffuse partially, then enabling the availability of both components, protein and cation, in the DF and in the structural matrix, acquires particular importance.
These results agree with the tissue histochemical analysis of the PC that showed, in the different types of secretory cells the presence of a remarkable variety of mucines (glycoproteins and proteoglycans) of neutral and acidic nature with carboxylated, sialylated, phosphated and sulphated radicals (Alcaide & Cruz López, Reference Alcaide and Cruz López2002). In this way a close correlation can be established between the ultrastructural variability of the secretory granules present in the cells in charge of the secretion of the jelly components (Winik et al., Reference Winik, Alcaide, Crespo, Medina, Ramos and Fernández1999), the chemical variability of the products stored in these granules (Alcaide & Cruz López, Reference Alcaide and Cruz López2002) and the variability of the components present in the secretion.
The identification of the non-reactive proteins to the histochemical tests used is in agreement with the ultrastructural analysis that revealed the presence of secretory cells containing prominent granules of paracrystalline organization similar to the inclusions contained in the cytoplasm of certain bacteria and of eukaryote cells from vegetable and animal organisms, structures whose only function assigned is that of protein storage (Theil, Reference Theil1987; Frazier et al., Reference Frazier, Pfeifer, Russell, Flak, Olsen, Hammar, Westblom and Normark1993).
In our laboratories experiments are in progress for the study of glycoproteins and proteins present in the jelly coats in the mechanism of Bufo arenarum fertilization.
Acknowledgements
This research was supported by grant (026/D347) from CIUNT, Consejo de Investigaciones de la Universidad Nacional de Tucumán, Argentina.