


I. Introduction
The United States is an international anomaly in that it has two largely interchangeable commitment devices to conclude the vast majority of its agreements with other states.Footnote 1 One instrument is the treaty. Treaties follow the advice and consent procedure set forth in Article II of the Constitution, which requires a two-thirds majority in the Senate in order for a treaty to be ratified and to become binding international law.Footnote 2 In place of the treaty, commitments can also be made in the form of a congressional-executive agreement, which requires only a simple majority in both the House of Representatives and the Senate.
Many scholars are skeptical of the utility of having two seemingly similar policy instruments to conclude international agreements, with most of the critique directed at the treaty for its supposed inflexibility and irrelevance. To be sure, criticism of the treaty is nothing new and dates back to at least the 1940s.Footnote 3 During that time, the discussion revolved around the question of whether it is permissible to use both instruments interchangeably, with a particular focus on the constitutional limits on substituting congressional-executive agreements for treaties. However, over time it became clear that neither courts nor the State Department showed much concern with delineating constitutional limits on the interchangeability of the two commitment devices.Footnote 4 Take, for instance, former U.S. State Department Legal Adviser Harold Koh, who suggests that there are only two reasons why the State Department uses treaties, namely comity toward Congress and the “powerful political message” that is sent to the world through the treaty ratification process. With respect to the interchangeability of the instruments, Koh considers it the “long-dominant” view that it is constitutionally permissible to use congressional-executive agreements in place of the treaty.Footnote 5
Today, the debate around interchangeability has resurfaced, albeit in a different form. The contemporary focus lies not on the question of whether it is permissible to use both instruments interchangeably, but on whether treaties and congressional-executive agreements can be used interchangeably as a matter of policy. During the Obama administration, only twenty treaties were approved by the Senate, the lowest number of approvals during a presidential term since President Ford.Footnote 6 At the same time, the popularity of the congressional-executive agreement seems unwavering, with several hundred international agreements having been concluded as congressional-executive agreements in the same time span.Footnote 7 Faced with this empirical reality, it has been contended that the treaty does not serve much practical purpose today, with some commentators even going as far as suggesting that the treaty should be abandoned altogether.Footnote 8
Why, the argument goes, should presidents go through the slow and cumbersome advice and consent procedure of the treaty if their policy objectives can be fulfilled more easily by use of congressional-executive agreements, which are not similarly constrained?Footnote 9 After all, the latter's authorization can be granted broadly and ex ante through simple majoritarian approval, thus allowing the president to conclude a myriad of agreements authorized under a single congressional act.Footnote 10 If we see treaties used today, this account suggests, it would be for reasons that are orthogonal to the quality of the instrument itself, such as historical convention or selective senatorial preferences.Footnote 11
At the same time, anecdotal evidence lends plausibility to alternative explanations as well. Consider, for instance, the bargaining process surrounding arms-reduction agreements between the United States and Russia. During the negotiations of SALT II, the United States proposed a preliminary congressional-executive agreement designed to ban new types of ballistic missiles and cruise missiles. However, former Soviet Foreign Minister Andrei Gromyko rejected the proposal due to the alleged inferior status of the congressional-executive agreement.Footnote 12 Similarly, during the negotiations of the Strategic Offensive Reductions Treaty (SORT), the United States and Russia agreed to reduce their arsenal of active nuclear warheads to between 1,700 and 2,200 each. President Putin insisted on codifying the agreement as a formal treaty and spent considerable bargaining power on persuading President Bush, who favored a congressional-executive agreement.Footnote 13 Outside the context of nuclear disarmament, negotiation partners have also pointed to the treaty as the desired, more serious form of commitment. For example, when the former President of the Philippines, Corazon Aquino, took office, she voiced her intention to replace the then-current congressional-executive agreements regulating the status of the U.S. military bases in the Philippines by “full-fledged” treaties.Footnote 14
If treaties and congressional-executive agreements are not qualitatively different from one another, it seems hard to rationalize why negotiation partners at times display such great interest in the choice of instrument. Consequently, some scholars appear critical of the supposed lack of the treaties' utility. The arguments come in different forms; some suggest that a president's use of the treaty would signal a particularly high level of commitment,Footnote 15 others that the struggle for senatorial approval may cause the government to reveal valuable information truthfully,Footnote 16 or that the greater stability of senatorial preferences helps to ensure long-term compliance.Footnote 17 What all these accounts have in common is an assumption that treaties, although more politically costly than congressional-executive agreements, confer certain benefits on the parties, in turn justifying their continuing existence as a valuable U.S. policy tool.
As of today, the debate surrounding the ongoing relevance of treaties in a context where congressional-executive agreements are so readily available and widely used remains unsettled. This Article seeks to shed light on the question of whether the treaty is a qualitatively different form of commitment than the congressional-executive agreement. It uses the most comprehensive dataset on U.S. international agreements available—the 7,966 agreements reported in the Treaties in Force Series from 1982 to 2012. In contrast to previous analyses, this Article is the first to directly contrast the consequences of relying on treaties versus executive agreements. Using survival time analysis, the Article demonstrates that, on average, an executive agreement made in 1982 had a 50 percent probability of breaking down by 2012, while a comparable promise made as a treaty broke down with only 15 percent probability.Footnote 18 This result holds even after controlling for a number of observable characteristics, such as the composition of the House and the Senate, the subject area of the agreement, and the partner country. The findings also reveal that the difference between the instruments is most pronounced when comparing treaties to ex ante congressional-executive agreements.
The results are consistent with the view that promises made in the form of the treaty are qualitatively different from those struck as congressional-executive agreements. Against the backdrop of this empirical finding, it seems premature to call for the abandonment of the treaty, which may still serve important policy functions that cannot similarly be fulfilled by the congressional-executive agreement.
The rest of the Article proceeds as follows: Part II lays out the institutional foundation of the different commitment devices and reviews the theories on how treaties may or may not differ from executive agreements. Part III motivates the empirical inquiry in the context of this theoretical debate, describes the data and methodology used in this study, and presents summary statistics. Part IV presents the results of a formal test of instrument durability, while Part V discusses their implications. A last section concludes.
II. Theory
The United States has two different mechanisms for concluding binding international agreements.Footnote 19 The first option is the traditional treaty. Treaties follow the advice and consent procedure set forth in Article II of the Constitution, which requires that, while a treaty is negotiated by the executive, it must still be approved by a two-thirds majority in the Senate in order to be ratified and become binding.Footnote 20
The second option is the executive agreement. Executive agreements can further be categorized into different types. Congressional-executive agreements require a simple majority in both the House of Representatives and the Senate.Footnote 21 They are used in subject areas in which the executive does not have sole competences. Congressional approval can be obtained after the agreement was negotiated, as was the case with the North American Free Trade Agreement (NAFTA)Footnote 22 or the Uruguay Round Agreements of the General Agreement on Tariffs and Trade.Footnote 23 However, it is much more common for Congress to provide broad authorization to the president ex ante in a statute.Footnote 24
If the executive has the competence to make policy without referring to Congress, the president may use sole executive agreements. Such areas encompass, among others, issues under the president's general executive authority or his role as commander in chief of the armed forces.Footnote 25 Sole executive agreements do not require congressional approval, but, like congressional-executive agreements, need to be reported to Congress under the Case Act.Footnote 26
The terminology surrounding the different types of executive agreements has sometimes caused confusion. Political scientists rarely distinguish between different types of executive agreements. When the unmodified term “executive agreement” appears in the political science literature, it commonly refers to the collective of both sole and congressional-executive agreements. In contrast, when international legal scholars use the term “executive agreement,” they typically refer to sole executive agreements, whereas the collective of both sole and congressional-executive agreements is not associated with any specific term. In order to preserve flexibility and precision in language, the present Article uses modifiers whenever it refers to a specific type of executive agreement. The unmodified term “executive agreement” is used to refer to the collective of both sole and congressional-executive agreements.
From an international legal viewpoint, it is clear that treaties and executive agreements are perfect substitutes. Indeed, international law does not recognize the term “executive agreement.” The term “treaty” is more broadly defined than in the domestic context of the United States. The Vienna Convention on the Law of Treaties (VCLT) states that any written agreement between states governed by international law qualifies as a “treaty” and thus creates a binding legal commitment.Footnote 27 Since both U.S. treaties and executive agreements meet this definition, there is no legal difference between either of those commitment devices from the perspective of international law. And while the United States is not a party to the VCLT, the State Department effectively applies the VCLT's definition, thus treating both treaties and executive agreements as equivalent under international law.Footnote 28
Domestically, the issue of legal substitutability has traditionally been more controversial. To be sure, there is little argument that congressional participation can be fully removed by replacing the treaty with the sole executive agreement.Footnote 29 However, views on the interchangeability of treaties and congressional-executive agreements are less harmonious. The Constitution does not expressly mention the existence of an instrument that resembles today's congressional-executive agreement, resulting in a debate about how to interpret this silence. To early proponents, it was largely sufficient to show that interchangeability offers flexibility and best describes the practice of U.S. foreign policy to assert that treaties and congressional-executive agreements should act as legal substitutes.Footnote 30 Later arguments rested on the idea of the existence of “constitutional moments” that would allow constitutional interpretation to be informed by consistent practice of the president, Congress, and the Supreme Court.Footnote 31 Such moments, particularly formed through practice in the 1940s, are alleged to have transformed the meaning of the Treaty Clause, providing a constitutional basis to the congressional-executive agreement.
In contrast, opponents of substitutability highlight the lack of clear textual support. According to a view derived from a strict construction of the Constitution, the Treaty Clause is clear in making senatorial advice and consent the exclusive method for the approval of international agreements.Footnote 32 An alternative view derived from a more flexible reading of the Constitution holds that treaties and congressional-executive agreements both have their respective areas of applicability. The argument rests on the idea that the U.S. Constitution has conferred limited powers upon Congress and the president and that executive agreements can only be used within this limited scope. Treaties as the default tool for matters in foreign affairs are not similarly constrained. Thus, if a matter of foreign policy falls outside of the competences that have been conferred upon Congress, the treaty is held to be the exclusive instrument through which legally binding commitments can be made.Footnote 33
While some doctrinal criticism against the widespread use of the congressional-executive agreement in place of the treaty remains,Footnote 34 today the predominant view is that treaties and congressional-executive agreements act as legal substitutes under domestic law for the vast majority of agreements.Footnote 35 This view is also reflected in Restatement (Third) of the Foreign Relations Law of the United States.Footnote 36 There, the American Law Institute states:
The prevailing view is that the Congressional-Executive agreement can be used as an alternative to the treaty method in every instance. Which procedure should be used is a political judgment, made in the first instance by the president, subject to the possibility that the Senate might refuse to consider a joint resolution of Congress to approve an agreement, insisting that the president submit the agreement as a treaty.Footnote 37
The view that treaties and congressional-executive agreements can be considered legal substitutes naturally raises the question why the United States needs two legal instruments to regulate the same types of international relationships. Indeed, some commentators have asked why the United States should not abandon the treaty in favor of the congressional-executive agreement.Footnote 38
In an attempt to answer this question, scholars have put forward several hypotheses with regard to the contemporary role of the treaty. These can be broadly subsumed under two categories: First, there are hypotheses supporting the idea that treaties have no independent value as a policy instrument. These accounts typically explain the use of the treaty through motivations that are orthogonal to considerations pertaining to the quality of the promise itself. Second, there are hypotheses suggesting that promises made as treaties are qualitatively different from those made as executive agreements, and that the choice to use the treaty is governed by these considerations.
It is important, however, not to fetishize this dichotomy. With few exceptions, neither the hypotheses described nor their respective authors purport to explain the executive's motivations in ways that result in particularly strong policy recommendations. Instead, in formulating the hypotheses, most commentators are open to the idea that the role of the treaty can only be fully explained when taking several of the suggested mechanisms into consideration.
Hypotheses Suggesting Qualitative Equivalence
One of the most influential and forceful accounts against the notion that treaties retain a special policy purpose, and that they may in fact be inferior to the congressional-executive agreement, is provided by Oona Hathaway.
The argument centers on the ease with which a president may renege on an agreement after it has been concluded. In particular, Hathaway suggests that the treaty form hinders the ability of presidents to credibly tie their hands, because even after ratification the treaty offers two additional possibilities to renege on a promise that the congressional-executive agreement would not provide. This in turn makes it difficult for other countries to rely on commitments made in the form of the treaty.
The first opportunity to renege is rooted in the fact that non-self-executing treaties follow a two-step process to become enforceable in U.S. law.Footnote 39 After ratification, non-self-executing treaties require additional implementation through a legislative act for which a simple majority in both the House and the Senate is required. Compare this to the executive agreement, for which the implementing legislation can and often is adopted in the same step as the ratification. Hathaway argues that the treaties’ two-step process makes it possible for the president to renege on his promise after ratification, whether intentionally or because the domestic political costs of enacting the implementing legislation are too high.Footnote 40
The second opportunity is that presidents can withdraw from treaties unilaterally, whereas the withdrawal from congressional-executive agreements requires congressional participation.Footnote 41 This would allow presidents to easily renege on their promise even after a treaty has gone through the advice and consent process.
Hathaway supplements her theory with an empirical assessment of 3,119 agreements concluded between 1980 and 2000. She finds that the observed pattern of treaty use is incompatible with theories that ascribe a different quality to the treaty vis-à-vis the congressional-executive agreement. Instead, Hathaway argues that the use of the treaty instrument can best be explained through a historical lens.Footnote 42 Under her view, the prevalence of the congressional-executive agreement is the result of Congress’ desire to reduce trade barriers in the post-World War II era, which necessitated giving the president more flexibility and authority in negotiating trade agreements.Footnote 43 This has then led to the conventional use of the congressional-executive agreements in trade (and financial) matters. In other subject areas such as human rights, the debate was highly politicized and Congress had no desire to give up what was perceived as the nation's sovereignty subject to the lower legislative bar set by the congressional-executive agreement.
To Hathaway, the treaty is a less reliable instrument and should be abandoned in favor of the congressional-executive agreement. Her claim sparked substantial discussion among international law scholars. For example, in 2014, under the title The End of Treaties?, the online companion of the American Journal of International Law published several essays by prominent scholars and State Department officials discussing whether the treaty will have any place in the future of U.S. foreign policy.Footnote 44
Other scholars have similarly relied on historical perspectives in explaining the use of the treaty. For instance, Curtis Bradley and Trevor Morrison have proposed that the presidents’ choice between the two commitment devices is at least partially influenced by a continuous and concerted insistence of the Senate to retain an important role in the ratification process.Footnote 45 Such an insistence, mainly expressed through declarations and correspondence, would create a “soft law” that imposes political constraints on the options available to the executive. At the same time, senatorial attention is selective, with a primary focus on “major” agreements in which both the stakes and the public attention are exceptionally high. Hence, differences in the use of the treaty would be at least partially explained by the fact that some agreements, in particular major arms-control agreements, are subject to senatorial scrutiny, whereas other are of less concern to the Senate. The authors provide anecdotal support for their hypothesis, recalling instances in which presidents have abandoned plans to conclude major arms-control agreements such as the Treaty on Armed Conventional Forces in Europe as congressional-executive agreements after pressure by the Senate.
Another account explaining the presidents’ choice between the two instruments is the “evasion hypothesis.”Footnote 46 Particularly prevalent in the writings of political scientists, this reasoning holds that the president's main motivation for choosing one instrument over the other is presidential support for the agreement in the Senate.Footnote 47 If an agreement is easy to push through the Senate, the argument goes, presidents will rely on the treaty. If, however, securing a two-thirds majority proves difficult, the president, according to this argument, can simply switch to the congressional-executive agreement without any significant consequences.
Empirical support is provided by Margolis, who analyzes all international agreements concluded from 1943 to 1977 and finds that the distribution of seats in the Senate is highly predictive of the choice between treaties and congressional-executive agreements.Footnote 48 The findings support the evasion hypothesis, according to which the choice between treaties and executive agreements is solely a function of domestic legislative support.
Hypotheses Suggesting Qualitative Difference
In contrast to the hypotheses mentioned in the previous subsection, several accounts suggest that promises made in the form of a treaty are qualitatively different than those made as congressional-executive agreements. These accounts rest on the view that the treaty, although more politically costly, may also confer certain benefits on the parties, which ultimately may lead to a more robust commitment. In interactions where the benefits outweigh the costs, the treaty would then be the preferable instrument, whereas a congressional-executive agreement would be preferred in others.
An account that ascribes political benefits to the treaty is illustrated by the work of John SetearFootnote 49 and Lisa Martin.Footnote 50 Their reasoning focuses on the high legislative hurdles of the treaties’ advice and consent procedure. Since presidents typically lack enough support in the Senate to secure a two-thirds majority, they often have to go through a substantial political struggle to convince senators to vote in favor of a proposed treaty. This political struggle demands not only time and resources, but securing sufficient support may also require the president to make substantial concessions in other subject areas.Footnote 51 Because the conclusion of a treaty comes at such a high political cost, Setear and Martin argue that only presidents who are especially committed to the agreement would be willing to go through the advice and consent procedure. If a high level of commitment is not required, the president would instead opt for the sole or congressional-executive agreement,Footnote 52 which, as the authors allege, comes at a lower cost. Other countries are aware of this signaling dynamic. When contracting with the United States, they would thus observe the form of agreement that is proposed and, in some high-stakes scenarios, they may refuse to agree unless the president is willing to commit via treaty.
Martin conducts an empirical analysis to support the signaling theory. She provides an analysis of 4,953 international agreements concluded between 1980 and 1999 and finds that the value of the underlying relationship governed by the agreement is determinative of whether a president uses a treaty or an executive agreement.Footnote 53 Value is proxied using an indicator for whether the agreement is multilateral, the GNP per capita of the contractual partner, as well as the total GNP.Footnote 54 Martin finds that presidents are especially likely to rely on the treaty if the underlying value of the relationship is high. She concludes from these findings that the treaty is reserved for high stakes negotiations in which the president needs to signal a strong commitment to treaty partners.
Advocates of the signaling theory model the bargaining process surrounding the conclusion of international agreements as a signaling game with three rounds: First, it is determined at random whether the president is reliable or not. Then, the president chooses the treaty or the executive agreement. Lastly, the negotiation partner chooses whether to accept or reject the proposed agreement and the parties pay their costs and receive their benefits. In reality, international cooperation is more complicated. In particular, signaling theory implicates only the commitment level of the negotiating president, even though many agreements are intended to and do outlast presidential terms. It is unclear from the signaling model why negotiation partners should put much faith into promises made as treaties by one administration when future administrations can easily renege on the agreement.
Addressing some of these limitations, a second hypothesis put forth is that the treaty's high legislative hurdles help solve commitment problems arising out of executive turnover. They purport that the strong legislative support implicit in the treaty mechanism reassures negotiation partners that the United States is likely to cooperate in the long run, even if administrations change.Footnote 55 This rationale hinges on the assumption that senatorial preferences are more stable than the preferences of the presidency, for example, because the Senate represents a broader consensus among the voting population that is less sensitive to political shocks,Footnote 56 or because senators serve longer terms and avoid changing their position in order to not be seen as wavering.Footnote 57 This would in turn allow other countries to rely more heavily on a promise made in the form of a treaty.
Lastly, some scholars have argued that a key difference between treaties and congressional-executive agreements lies in the information that is produced in the process of securing legislative approval.Footnote 58 That is, in the course of concluding an agreement as a treaty, the executive needs to reveal important private information in order to make a convincing case and ensure approval of a qualified majority in the Senate. This dynamic can be illustrated by borrowing the leading example posited by John Yoo, who considers a potential military conflict between the United States and China over a territory and negotiations surrounding how this territory would be divided up. The domestic struggle for approval of a treaty requires negotiators to truthfully indicate to the Senate the chances of them winning a war against China. Yoo argues that observing this process would allow China to gain more accurate information about U.S. beliefs than the congressional-executive agreement provides. China may thus insist on the agreement being concluded in the form of a treaty and because the underlying information is more accurate, be incentivized to put more trust into continuing compliance with the agreement.
III. Motivation and Empirical Approach
The foregoing discussion reveals that there are myriad theories on the qualitative difference between treaties and congressional-executive agreements. A common approach to resolving such theoretical debates is to focus on empirical evidence. However, as has been pointed out above, the theoretical and empirical literature both seem inconclusive, with hypotheses of both categories claiming to be supported by quantitative empirical evidence.
It is possible to make sense of this ambiguity in empirical results by observing that previous studies all follow a similar approach. The researcher analyzes the environment in which an international agreement has been concluded and tries to identify patterns that help predict the type of instrument that has been used. If the pattern is consistent with a motivation that assigns different significance to treaties and congressional-executive agreements, that is taken as evidence that these instruments differ in their quality. For instance, from the finding that treaties are used when the partner country has a high GDP per capita, Martin infers that treaties are preferred when the stakes are high and must thus be more reliable commitment devices than congressional-executive agreements. Similarly, from the finding that few treaties are concluded in the area of trade, Hathaway infers that the choice to use the treaty must be animated by historical conventions that made the congressional-executive agreement attractive for trade negotiations.
This focus on choice patterns is a very indirect approach to identifying differences in policy instruments that rests on a number of strong assumptions, such as a correct model specification and a causal relationship between identified patterns and hypothesized motives. Without making these assumptions, observed actions can be the result of a great number of different motivations, making it impossible to infer which instrument is more reliable. For instance, Martin's finding that high GDP correlates with treaty use does not necessarily imply that the treaty is used because the partner country has a high GDP. As will be shown below, the treaty is commonFootnote 59 for agreements between the United States and Western European countries.Footnote 60 On average, these countries tend to have a high GDP per capita, but they also share a number of other characteristics that could potentially explain the results, such as a shared history of Roman law and an adherence to legal formalism. In addition, Martin's findings that “high value” agreements increase the probability of treaty use are not only consistent with signaling theory, but are also consistent with the hypothesis proposed by Bradley and Morrison of selective senatorial attention paid to “major” agreements.
Similarly, Hathaway's analysis is purely descriptive and is not equipped to empirically investigate the reasons why treaties are more or less common in certain subject areas. This makes it impossible to determine whether historical conventions motivate the use of the treaty in different subject areas or whether other considerations might be at play.
There are other, possibly more profound difficulties with the descriptive results as well. Hathaway's primary empirical guidepost is a comparison of treaties across subject areas. For instance, she finds that there are twenty-seven commercial treaties and only eight environmental treaties, thus suggesting that treaties are more important in commerce than in the area of environmental protection.Footnote 61 However, such a comparison of absolute numbers can be misleading, as it does not take into account the overall number of agreements within a subject area. For instance, while the present study also finds that the absolute number of commercial treaties is higher than that of environmental treaties, there are also more commercial executive agreements than environmental executive agreements. Indeed, twenty out of 216 environmental agreements are concluded as treaties, which is a share of 9 percent. However, only thirty-five out of 783 commercial agreements are treaties, which is a lower proportion of 4 percent. Thus, treaties may in fact be a more important commitment device for environmental agreements than for commerce, even though the absolute numbers suggest otherwise.
In contrast to previous studies, this Article takes a more direct approach to compare treaties and congressional-executive agreements that does not require equally strong assumptions. At the heart of the inquiry into the differences between the two policy instruments lies one simple question: If a given contract between the United States and a partner country is concluded as a treaty, will this lead to a different outcome than if the agreement is concluded as a congressional-executive agreement? If the answer is yes, then this suggests that the treaty is qualitatively different from the congressional-executive agreement. If the answer is no, then treaties and congressional-executive agreements are substantively similar and their use might be motivated solely by circumstances that are irrelevant to the substantive characteristics of the agreement. It is thus instructive to shift the empirical focus and consider whether the use of the treaty is associated with an outcome that differs from the congressional-executive agreement.
Outcomes of international agreements can be compared on a number of dimensions. One possible measure is the level of compliance with an agreement. However, comparing agreements based on compliance rates has several disadvantages in this context. Not only is “compliance” difficult to define, it is also notoriously hard to measure and verify in most contexts.Footnote 62 Even if it were possible to accurately measure compliance, it would still leave open the question of how to compare levels of compliance across different agreements in different subject areas.Footnote 63 Motivated by the theoretical work previously discussed, this Article instead compares treaties and congressional-executive agreements based on the strength of the commitment associated them, measured as durability.
Using durability as a proxy for commitment strength is justified for three reasons. First, consider an alternative concept of commitment strength—the ability for an agreement to withstand shocks in the political or economic environment.Footnote 64 The probability for shocks to occur increases with time, and therefore agreements which are more resistant to changing circumstances are also those that last longer. Hence, durability is positively correlated even with this alternative concept of commitment strength. Second, from a purely practical perspective, the duration of a treaty can be measured objectively, whereas the competing concept of commitment strength would require making a number of subjective decisions, such as about the severity of the shock and the extent to which the agreement did or did not withstand external pressures.Footnote 65 Third, different theories use the concepts of commitment strength and durability interchangeably, suggesting that both concepts can be viewed as substitutes.Footnote 66
If the treaty does not retain a special value as a policy tool, it should be the case that a promise concluded as a congressional-executive agreement is just as durable as a promise concluded as a treaty. If, on the other hand, treaties are qualitatively different promises, then the average treaty should outlast the average congressional-executive agreement. In this way, the theoretical debate leads to observable and verifiable empirical claims.
The Data
The dataset consists of all agreements reported in the Treaties in Force (TIF) series that were signed and ratified between 1982 and 2012.Footnote 67 TIF is the official collection of international agreements in force maintained by the U.S. Department of State. It includes information on the signing date, the parties, and the subject area of the agreement, as well as on when the agreement went into force. The agreements in TIF appear in the Kavass’ Guide of Treaties in Force (Guide).Footnote 68 The Guide is an annual publication accompanying TIF, first published in 1982, that contains additional useful information, such as treaty subject matter, a short description, and the parties to the agreement. TIF uses an elaborate but partially incoherent system to categorize agreements by subject area.Footnote 69 In total, there are 197 different subjects in the dataset, many with single-digit observations. This Article reduces the dimension of these subject areas to thirty-eight thematically coherent categories, that are detailed in the online appendix.
Of primary relevance to this analysis is the fact that the Guide contains a list of treaties that were indexed in TIF in the year preceding the year of publication, but are no longer indexed thereafter. The Guide thus makes it possible to determine which agreements have been deleted from the TIF and the year in which the deletion took place. An agreement that was listed in TIF in the previous year but is not listed in the current year is considered by the U.S. State Department to be no longer in force.Footnote 70 Deletions are based on one of four grounds, though TIF does not indicate the reason for any particular deletion. These grounds are (1) expiration based on the terms of the agreement; (2) denunciation; (3) replacement by another agreement; or (4) termination.Footnote 71
Although TIF lumps these four grounds together, some observers might contend that the expiration of an agreement based on its original terms should be treated differently from the other grounds for deletion. After all, an agreement that goes out of force based on an expiration clause does not appear to “break down” in a way that is comparable to an agreement ending, for instance, through withdrawal. However, whether the parties include a termination provision specifying an expiration date in an agreement is endogenous, meaning that it may be at least partially determined by the same circumstances that lead to traditional breakdown of an agreement. In the related area of private contracts, studies have shown that a contract with an unreliable negotiation partner not only increases the probability that an agreement will be terminated prematurely, but also increases the probability that a termination clause with a limited duration is included in the contract.Footnote 72 Thus, both agreements that go out of force due to termination, withdrawal or replacement, and those that end according to expiration clauses, implicate a party's reliability.
For each agreement, the Guide further reports a “Senate Treaty Document Number.” This number is assigned to any treaty submitted to the Senate under the advice and consent procedure. Executive agreements do not receive a Senate Treaty Document Number. The number can thus be used to identify which agreement in the database is a treaty and which agreement was concluded as an executive agreement.
In order to distinguish between agreements that Congress authorized ex post and other types of executive agreements, the data further relies on Hathaway's collection of authorizing legislation. Hathaway compiled the most comprehensive list of congressional acts between 1980 and 2000 that can reasonably be construed as authorizing prior congressional-executive agreements. This list encompasses nine legislative acts.Footnote 73 I inspect each of these acts manually and then search the TIF data for executive agreements that can reasonably be construed as being authorized under one of the acts.Footnote 74 This approach identifies fifty-two ex post congressional-executive agreement, out of 5,443 agreements that have been concluded between 1982 and 2000.
The dataset was further complemented with publicly available information on the president who signed an agreement,Footnote 75 Senate compositions by party, and “legislative potential for policy change” (LPPC) scores for the Senate, as used by Martin.Footnote 76 LPPC scores reflect how difficult it is for a president to push legislation through. A higher LPPC score indicates lower political costs to implement legislation in the Senate. The LPPC score is constructed according to the following formula:
 $$LPPC = Seats_{Pres}{^\ast}Unity_{Pres}-Seats_{Opp}{^\ast}Unity_{Opp}$$
Unity refers to voting unity scores published by Congressional Quarterly.Footnote 77 Higher Unity scores indicate more uniform voting patterns. Hence a president with a united majority in the Senate will receive a higher LPPC score than a president with an ideologically fractured majority. Similarly, the more seats a president has, the higher the LPPC score will be.
Overall, the dataset contains 7,966 agreements. In longitudinal form, each agreement is observed once per year while it is in force and once when it goes out of force, leading to a total of 129,518 per-year-per-agreement observations.
Before proceeding to the analysis, it is important to address possible limitations of this dataset. While TIF is the most comprehensive collection of international agreements to date, there is no dataset listing every international agreement the United States has previously concluded.Footnote 78 Researchers could attempt to complement TIF with other treaty collections with the aim of creating a more comprehensive list of agreements. However, this is neither advisable nor practical for several reasons.
First, and most important, the only known bias in TIF is the omission of secret agreements, which, if publicized, could threaten national security.Footnote 79 However, since these secret agreements are by definition not publicly known, it is likely that they are also missing in other databases. Second, the agreements in TIF all follow a comprehensible selection process: they are agreements submitted to Congress pursuant to the Case Act and are considered to be in force by the State Department. Combining these agreements with other databases introduces the possibility for unknown selection biases, threatening the interpretability of any findings. Third, TIF uses its own index system, such that agreements in TIF cannot easily be compared to those from other sources. And fourth, previous attempts to combine datasets have resulted in substantially fewer agreements than contained in the dataset used here.Footnote 80 For these reasons, this Article suggests that a single dataset based on TIF is preferable to a combination of different sources.
A second limitation of the data is that it is not able to identify individual sole executive agreements. This is important because the question of whether the executive agreement should fully replace the treaty is only raised with regard to congressional-executive agreements; it is generally acknowledged that sole executive agreements are very different policy instruments that fall within the president's power and do not require legislative participation.Footnote 81 The reason for the inability to identify sole executive agreements individually is that neither TIF nor the executive agreements themselves indicate their authorizing legislation. Thus, identifying sole executive agreements would require a search for authorizing legislation for each individual executive agreement in the Statute at Large, a process that is infeasibly labor intensive and cannot be easily automated.Footnote 82 However, prior studies have found that the proportion of sole executive agreements is minimal, with an estimated share of 5 percent to 6 percent of all international agreements.Footnote 83 The analysis described below addresses this limitation through a conservative estimation procedure.Footnote 84
Lastly, the dataset does not include information about the party that is primarily responsible for the agreement's end. All theories summarized above focus on the reliability of the United States as a negotiation partner. Agreements terminated due to reasons unrelated to the U.S. level of commitment should thus not factor into the analysis.Footnote 85 At the same time, the identity of the party responsible for treaty termination is unobservable unless the researcher analyzes each termination individually. Even then, identifying the responsible party is often a subjective assessment. However, the inability to observe responsibility for agreement breakdown is unlikely to introduce significant biases into any estimates derived from the data. Bias is introduced only if an unobserved variable is related both to the variable of interest and the outcome variable. Here, this implies that bias is introduced only if the probability for the other party to breach the agreement differs between treaties and congressional-executive agreements.Footnote 86 However, as pointed out above, only the U.S. reliability is implicated by the distinction between treaties and executive agreements. It would thus be surprising if a partner country's propensity to withdraw was related to the choice of the policy instrument.Footnote 87
Methodology
With each observation in the dataset being an agreement-year, the analysis considers variations in the durability of different types of agreements, holding other characteristics constant. Differences in durability are estimated using survival time analysis. These methods are also referred to as event history studies.Footnote 88 Before proceeding, it is helpful to define a few key terms. Survival time analysis is primarily used in the medical sciences using terminology encountered most often in clinical trials. A “subject” is a unit of observation, here an agreement. An “event,” “death,” or “failure” are synonyms for the occurrence of the incident of interest, here the going-out-of-force of an agreement. The “survival time” is the time period between the start of the observation and the occurrence of the incident, here the period in which an agreement is in force. Agreements that are in force in the last period of observation are considered “right-censored,” i.e., with a survival time that has a known lower bound and an unknown upper bound, as one cannot observe how long the agreement ultimately lasts.Footnote 89 Finally, a “hazard rate” refers to the probability for an event to occur.
Survival time analysis offers different models to estimate the longevity of an observed subject, each of which has advantages and disadvantages. Model choice is primarily governed by whether the survival times of the analyzed subjects are discrete, such that they can be counted, or continuous, as well as how they are observed.
International agreements can go out of force at any point in time and survival times are thus continuous in nature. However, as described above, survival times are measured only once per year based on publication in TIF. In principal, continuous grouped data allows for the application of both parametric and semi-parametric models. However, as explained in the appendix, the semi-parametric Cox proportional hazard modelFootnote 90 is the most appropriate for the present scenario,Footnote 91 as it is a semi-parametric model that only relies on few assumptions.Footnote 92 The complementary log-log model serves as a robustness check.
Summary Statistics
Table 1 reports summary statistics. As can be seen, 5 percent of all agreements between 1982 and 2012 were concluded in the form of a treaty, making the use of the treaty exceptional. 20 percent of all agreements went out of force at some point during the period of observation. The average agreement was observed to be in force for 15.26 years. Among the agreements that are no longer in force, the average durability is 7.3 years. LPPC scores range from −17 to 17 with a mean of −0.10. On average, 50 percent of the seats in the Senate were held by the president's party at the time the agreement was signed. For 71 percent of agreements, the government was divided, with the White House being held by one party and either the Senate, the House, or both being held by the other. Together, these numbers indicate that the average agreement could not have been adopted in the form of a treaty absent bipartisan support, making the treaty a potentially costly instrument.
Summary Statistics

Summary statistics for the variables used in this dataset. An asterisk indicates that the statistics only include treaties that have gone out of force in the period of observation.
Figures 1 and 2 depict histograms indicating the number of executive agreements and treaties split by year and by the signing president. The figures show that the total number of agreements peaked in 1985 and declined thereafter. The relative share of treaties among all agreements was greatest in 2010, with 28 percent of agreements being concluded in the form of a treaty. However, most of these treaties were signed prior to the Obama administration. Indeed, President Obama concluded fewer agreements as treaties than any other president during the period of observation, a finding that has previously been observed by other scholars.Footnote 93 Meanwhile, agreements signed under President Clinton include the highest share of treaties, with 7.6 percent. Together, this implies that the use of the treaty varies with the president, though executive agreements are by far the more prevalent instrument across all administrations.
Agreement Types Over Time
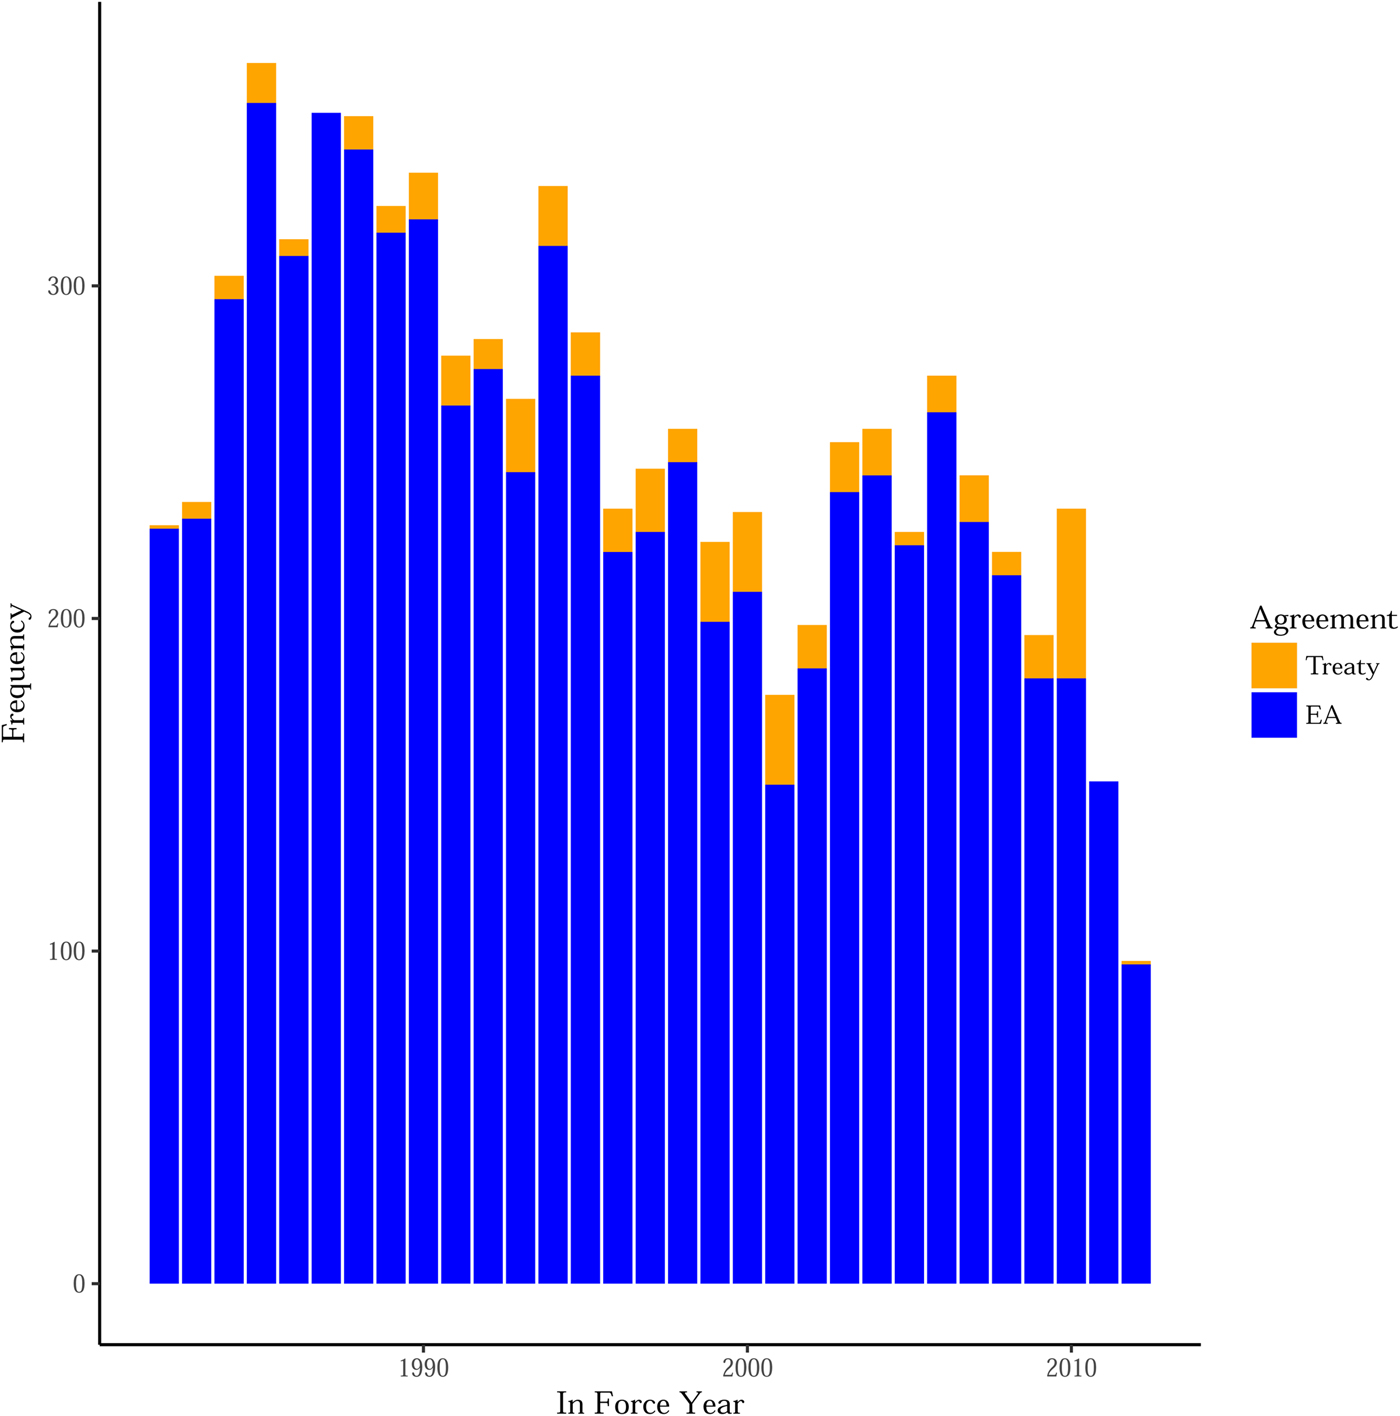
Agreement Types by President

Table 2 depicts a list of selected subject areas and the prevalence of treaties and executive agreements in each area. A full list of agreements by subject is included in the online appendix. The only subject in which treaties are more prevalent than executive agreements is extradition, where 94 percent of agreements are concluded as treaties. A likely explanation for this phenomenon is uncertainty concerning the constitutionality of using executive agreements to surrender individuals to foreign nations. The uncertainty stems from Valentine v. United States,Footnote 94 where the Supreme Court held that extraditions need to be authorized “by act of Congress or by the terms of a treaty.” However, Valentine did not consider whether extraditions pursuant to congressional-executive agreements are constitutional. Instead, the court considered whether the United States can extradite citizens in the absence of any agreement or legislative authority. As such, the reference to “acts of Congress” may have been “pure dicta.”Footnote 95 Today, commentators are split on the question of whether extraditions can be authorized by congressional-executive agreement, with some emphasizing a lack of congressional authority over extraditionFootnote 96 and others interpreting Valentine as an explicit acceptance by the Supreme Court of such authority.Footnote 97
Other areas in which treaties are very prevalent include “judicial assistance,” agreements to prosecute cross-border crime such as drug trafficking, money laundering, and stolen passports; “taxation,” which primarily encompasses double taxation and taxation information sharing agreements; and “property,” including agreements on the return of stolen vehicles and the transfer of real estate. Considering only subject areas, it seems difficult to explain the use of the treaty along one coherent dimension. For instance, if we think that treaties are especially prevalent among important agreements, we might expect them to be used frequently in agreements relating to national security and defense.Footnote 98 However, only 1 percent of defense agreements are concluded in the form of a treaty. Meanwhile crime prevention, which is often thought of as having a lower priority than national security, includes a much larger share of treaties.
The data also suggest that theories that explain treaty use by reference to historical convention leave many subject areas unexplained. For instance, although some scholars have argued that path-dependence explains why treaties are especially common in human rights and absent in trade, Table 2 shows that neither subject presents a particularly striking outlier. While in the area of human rights, treaties are somewhat prevalent (17 percent of all agreements), the choice of that instrument is still the exception rather than the norm. Similarly, the use of treaties in economic areas such as trade, commerce, and finance is close to the average of 5 percent, raising questions as to whether the rarity of the instrument in these areas is best explained by historical events or whether it instead reflects a different aversion to the treaty that affects other subject areas as well. In sum, it seems difficult for conventional theories to explain the wide variety of treaty prevalence in the different subject areas.
Agreement Use by Subject Area
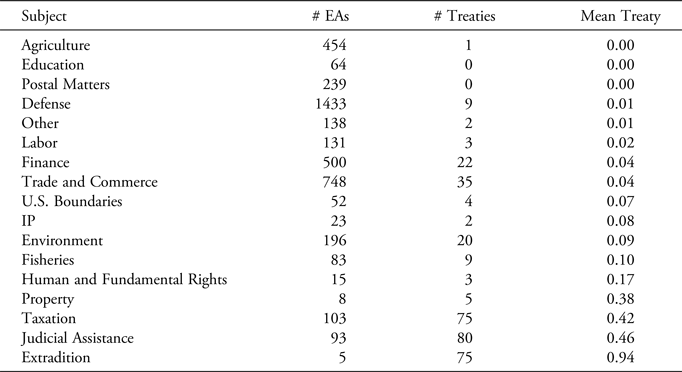
The table depicts the prevalence of treaties and executive agreements for selected subject areas. Statistics for all subjects are included in the online appendix.
Turning to the identity of the parties, the agreements in the dataset were concluded between the United States and one or more of 215 countries or state-like entities and fifty-two international organizations. Table 3 depicts the twenty countries with the most agreements in the dataset. A full list of agreements by partner country is included in the online appendix. The three most frequent treaty partners are all Western European countries, namely France, Italy, and Germany. In multilateral agreements, 20 percent are concluded in the form of a treaty, far exceeding the share in any bilateral relationship.
Agreement Use by Partner Country
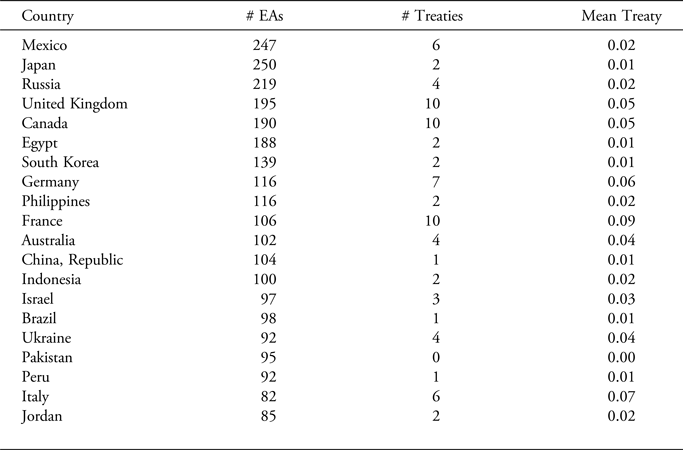
The table depicts the prevalence of treaties and executive agreements for the twenty most frequent partner countries in the dataset. Statistics for all countries are included in the online appendix.
IV. Results
This section presents the results of the analysis. I first consider differences between treaties and executive agreements in general, without distinguishing among different types of executive agreements. I then investigate whether the findings change when further differentiating between sole executive agreements, ex ante congressional-executive agreements, and ex post congressional-executive agreements.
Treaties vs. Executive Agreements
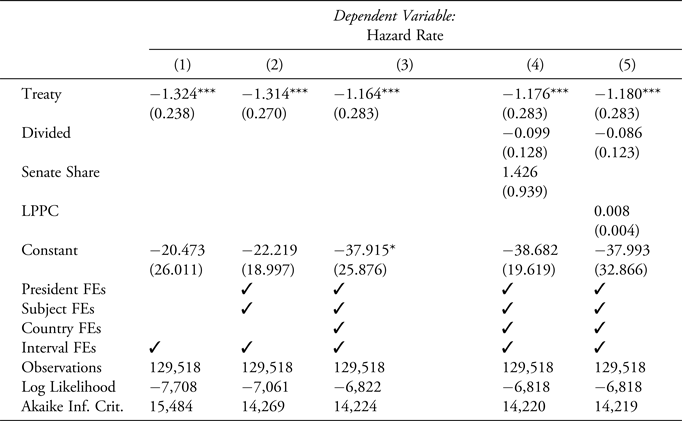
Table 4 presents results for the Cox proportional hazard model. Model (1) only includes the treaty indicator. It can be thought of as a simple descriptive comparison of the durability of treaties and all executive agreements, taking no other characteristics into account. Model (2) includes president and subject area fixed effects. They indicate the average difference in durability, given that two agreements have been concluded by the same president and in the same subject area. Model (3) additionally includes country fixed effects.Footnote 99 If the choice between executive agreements and treaties was the result of historical path-dependence without substantive relevance in the present, then there should be no difference in the durability of treaties and executive agreements when holding all of these characteristics constant. The coefficient on Treaty should thus be small and statistically insignificant. Model (4) further controls for the president's party's share of seats in the Senate, as well as for a divided government, in order to investigate whether differences between treaties and executive agreements are explained by a president's intention to side-step the Senate. If that is the primary motivation for choosing the treaty, then the inclusion of either of these covariates should render the coefficient on Treaty small and insignificant. Model (5) does not control for the share of seats, but for LPPC scores, which are arguably a better proxy for the costs of pushing legislation through the Senate. The standard errors for all models are clustered by agreement.
Cox Proportional Hazard Model
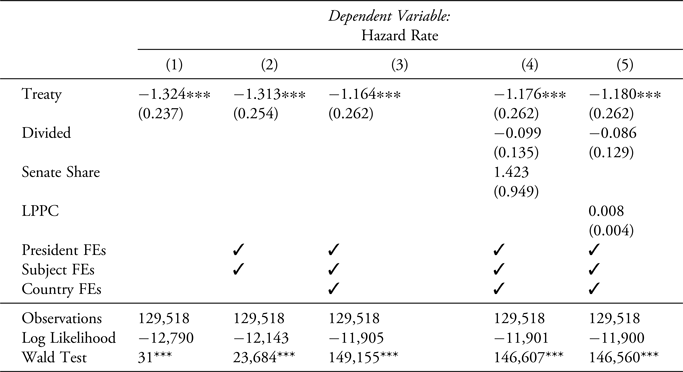
Note: *p < 0.05; **p < 0.01; ***p < 0.001
The results of a Cox proportional hazard regression of survival time on a treaty indicator and several covariates. Standard errors are clustered by agreement.
In each model specification, the coefficient on the treaty indicator is negative and significantly different from zero. Note that coefficients in survival models express changes in the probability for an event to occur, i.e., the hazard rate. Here, the event is defined as an agreement going out of force. Hence a negative coefficient indicates a decrease in the probability for an agreement to go out of force if it is concluded in the form of a treaty. The results imply that treaties last significantly longer than executive agreements and that the difference in durability is neither the result of arbitrary subject-matter conventions, nor a byproduct of a decision-making process that is primarily driven by the seat map in the Senate.
Table 5 runs the same model specifications using the competing complementary log-log model. Again, the results consistently show that agreements concluded as treaties outlast those concluded as executive agreements. Thus, the results do not depend on the specific idiosyncrasies of the Cox model, but are robust to other model specifications as well.
Complementary Log-Log Model
Note: *p < 0.05; **p < 0.01; ***p < 0.001
The results of a generalized linear model with a complementary log-log link function regressing survival time on a treaty indicator and several covariates. Standard errors are clustered by agreement.
Statistical significance does not imply substantive relevance. With a large number of observations such as in this study it is important to complement the statistical findings with evidence that the results are substantively meaningful and not only marginal. Differences in survival times can be expressed as hazard ratios, which describe the ratio of the hazard rate for different subgroups. Here, the hazard ratio for the treaty indicator of the preferred Model (5) is 0.3, indicating the relative probability for a treaty to go out of force at any point during the window of observation is about 30 percent of the probability for an executive agreement to go out of force.
The findings can further be illustrated by comparing estimated survival curves or cumulative hazard curves. The survival curve at time t depicts the probability that an agreement lasts through t, conditional on having lasted up until t. The cumulative hazard in time t is the probability that an agreement goes out of force in or prior to t.
Figure 3 depicts estimated survival and cumulative hazard curves for the preferred Model (5), one corresponding to a treaty and one corresponding to an executive agreement. Numerical covariates have been centered around their mean. For categorical variables, the most prevalent value is used.Footnote 100
Survival and Hazard Curves by Agreement Type
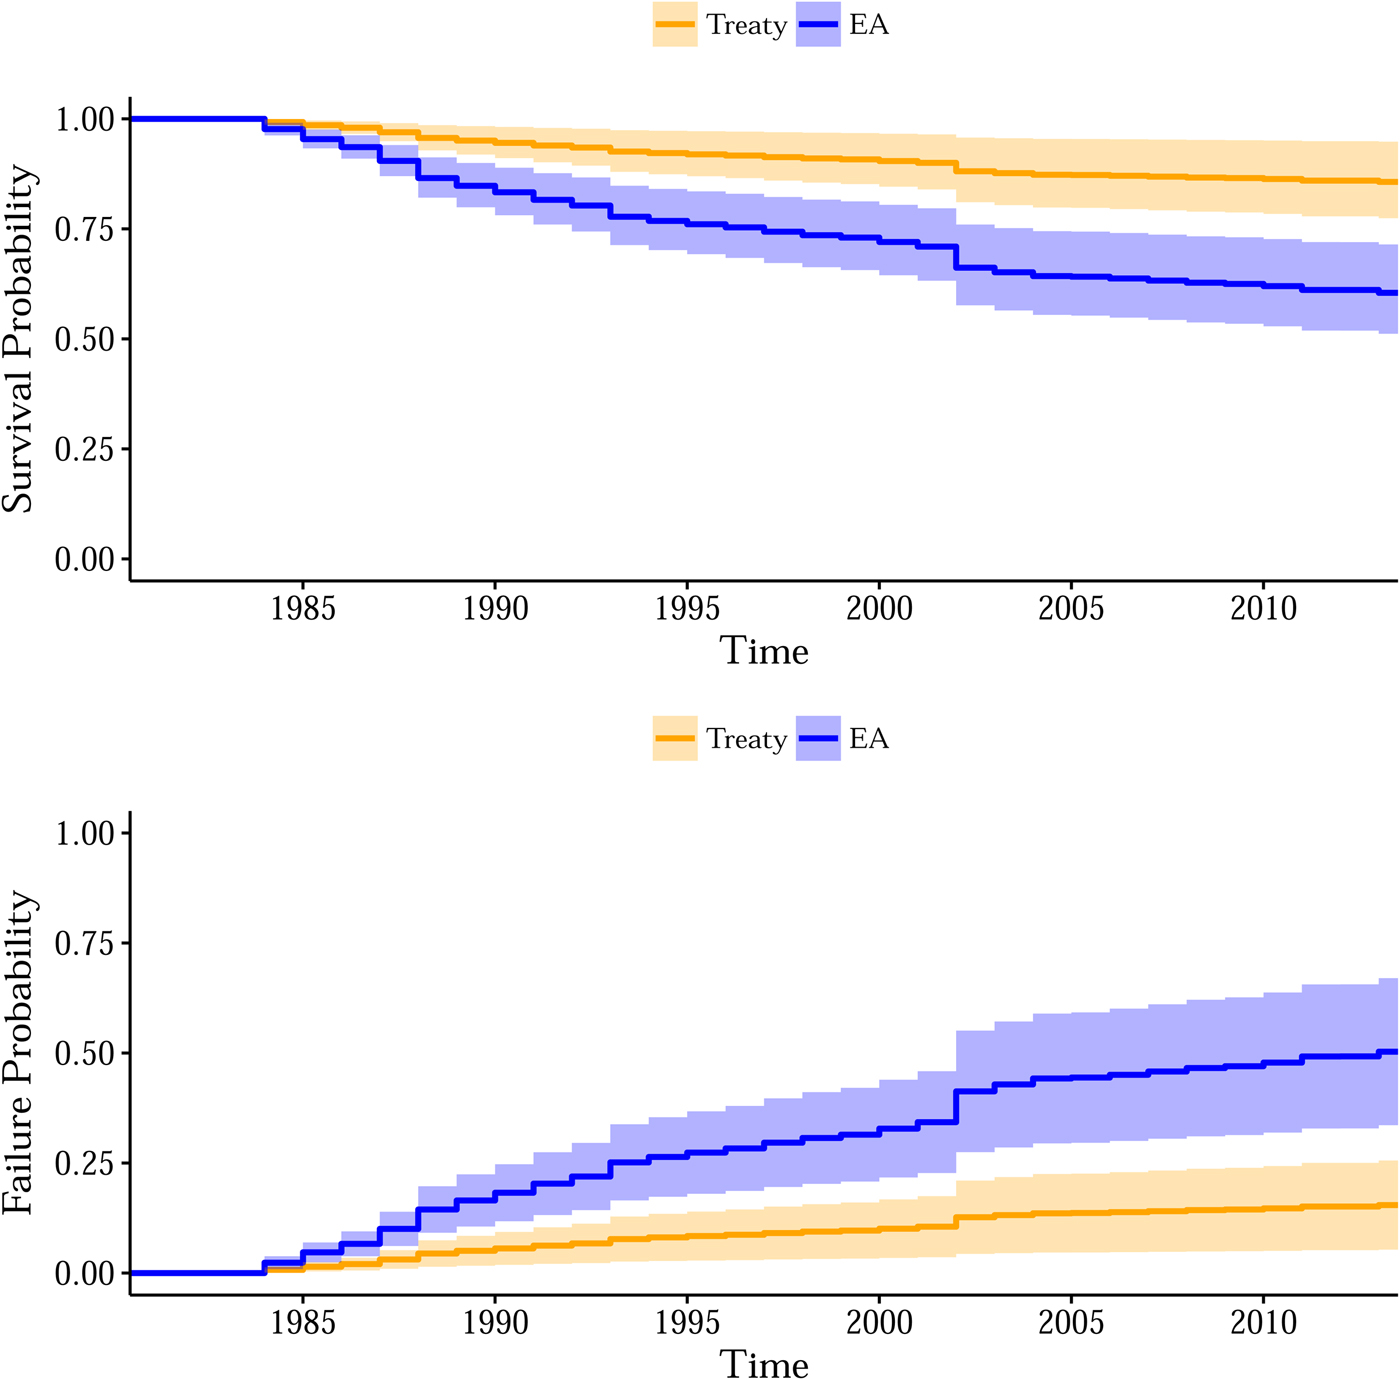
Figure 3 reveals that there is a probability of 14 percent for an agreement to break down at the end of the period of observation, conditional on having remained in force until then. For executive agreements, that probability is 40 percent. Similarly, there is a 15 percent probability that a treaty breaks down at some point between 1982 and 2012, whereas that probability is 50 percent for executive agreements.
Different Types of Executive Agreements
Thus far, the analysis has not distinguished between different types of executive agreements. There are, however, important differences among these instruments, although these differences have not adequately been taken into account in prior empirical scholarship on this topic. Ex post congressional-executive agreements require congressional approval of the individual agreement. Martin's theory implies that this requirement of individual approval may decrease the difference in cost as compared to a treaty. In addition, sole executive agreements are very different policy instruments that fall entirely into the president's power and do not require legislative participation. As such, it may be reasonable to argue that sole executive agreements should be omitted from the analysis. Both of these issues will be addressed in turn.
Consider first ex post congressional-executive agreements. As pointed out above, ex post congressional-executive agreements are rare, with a share of less than 1 percent during 1980 and 2000. Table 6 presents results on the coefficient of the treaty indicator when the model is run separately on ex post congressional-executive agreements and all other international commitments.Footnote 101 While most model specifications indicate that there may be a difference in the durability between ex post congressional-executive agreements and treaties, that difference is substantively small and statistically insignificant. In every model specification that includes other executive agreements, the difference is large and statistically significant. As such, the evidence is consistent with the view that differences between treaties and congressional-executive agreements are less pronounced for ex post congressional-executive agreements.
Cox Model by Agreement Type
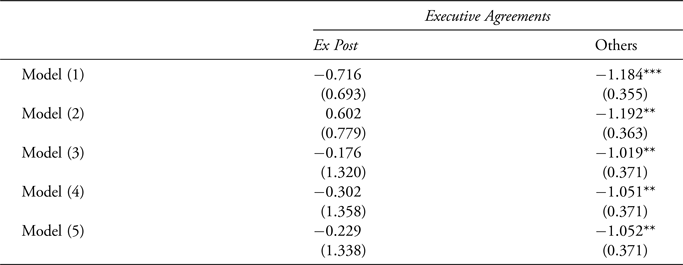
Note: *p < 0.05; **p < 0.01; ***p < 0.001
The table depicts the coefficient on the treaty indicator for different model specifications. “Ex Post” compares treaties to ex post congressional-executive agreements. “Others” compares treaties to the remaining executive agreements.
That said, one cannot conclude that there is definitively no difference between treaties and ex post congressional-executive agreements. The failure to reject the null hypothesis is different from proving the null hypothesis. The number of ex post congressional-executive agreements in the sample is small. As such, failure to reject the null hypothesis may simply be a result of large standard errors due to data scarcity. This is especially true for Models (2)–(5), which include a large number of covariates and thus lead to data sparsity within many subgroups. The fact that almost all model specifications yield negative coefficients certainly makes it possible that more data may yield a statistically significant difference, albeit a small one.
Consider now the case of sole executive agreements. As pointed out above, TIF does not distinguish between sole and congressional-executive agreements, though the estimated share of the former ranges from 5 percent to 6 percent of all agreements. To accommodate the fact that some international instruments may be sole executive agreements that should be excluded from the analysis, this study employs a sensitivity analysis.Footnote 102
The analysis sorts agreements by their durability and assumes that the x quantile are sole executive agreements, where x ∈ [0, 0.1]. For instance, x = 0.03 assumes that the 3 percent least durable agreements are sole executive agreements. It then omits these agreements from the analysis, runs the preferred Model (5) and collects the estimated coefficient on the treaty indicator and its standard error. Note that the assumption that the least durable agreements are sole executive agreements is extremely restrictive. In reality, it is much more likely that some sole executive agreements outlast congressional-executive agreements. It can thus be expected that this approach biases the durability of congressional-executive agreements upward, making it harder to detect a difference between the durability of treaties and executive agreements. If it can be shown that even under these restrictive assumptions treaties survive executive agreements, this provides particularly strong evidence for the greater durability of treaties.
Omitting Sole Executive Agreements
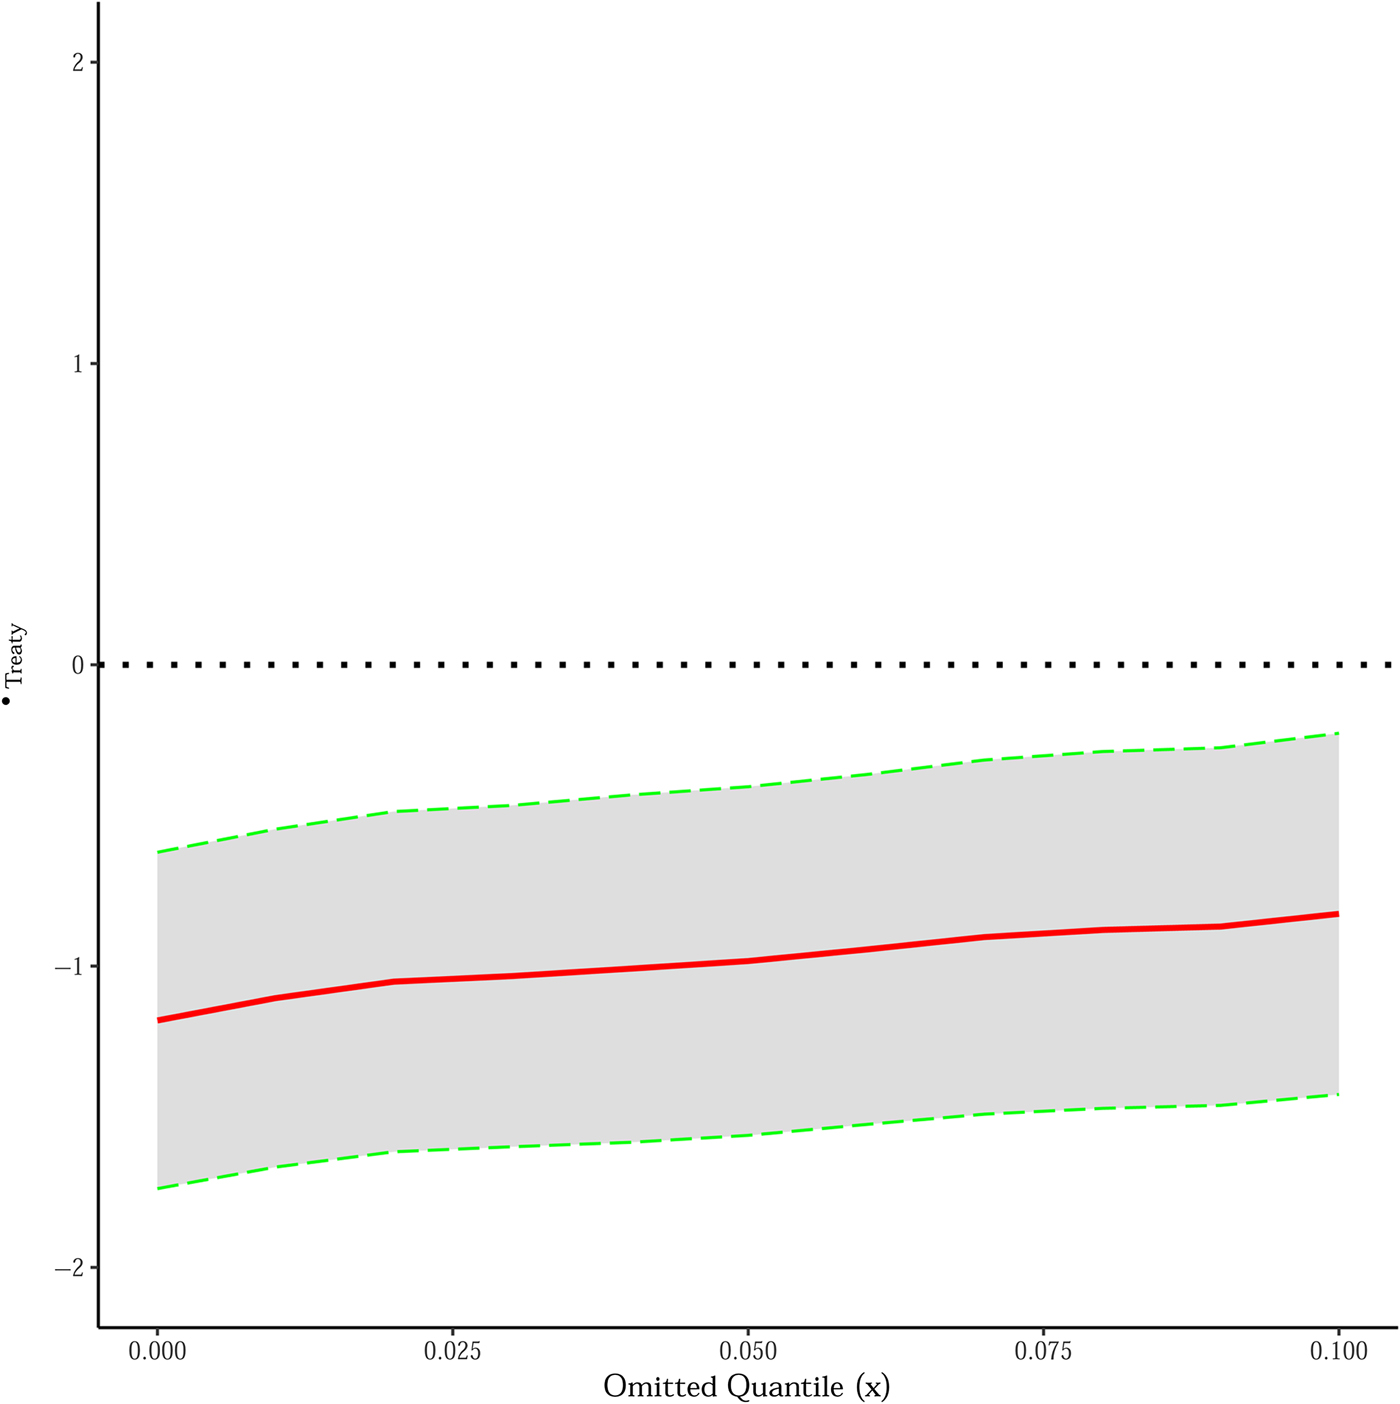
Figure 4 reports the estimated coefficients and 95 percent confidence intervals for all x over the range [0, 0.1]. Even under the strict assumption that the 10 percent shortest-lasting executive agreements are sole executive agreements, there still is a substantial difference between treaties and congressional-executive agreements that is statistically different from 0.
V. Discussion and Implications
This study set out to investigate whether promises made in the form of a treaty are significantly more durable than those made as congressional-executive agreements. The analysis suggests that this in fact is the case. When holding all observed characteristics constant, an agreement adopted as a treaty lasts statistically and substantively longer than a similar agreement concluded as an executive agreement. This finding holds true for all model specifications and even under the assumption that the 10 percent shortest lasting executive agreements are sole executive agreements that could not easily replace the treaty.
It is important, however, to acknowledge the limitations of this study, which highlight that the above findings should be viewed not as an end point but rather as an important step in understanding the relevance of the choice among international instruments.
The first limitation relates to the causal interpretation of the findings. The choice between treaties and congressional-executive agreement is not random, and there is no guarantee that the estimates derived from the analysis can be interpreted as causal estimates, i.e. that agreements concluded as treaties last long because they have been adopted as treaties and not congressional-executive agreements.Footnote 103
Through the inclusion of several controls and fixed effects, the analysis attempts to address most of the plausible sources of omitted variable bias that are motivated by the different theories, such as selective senatorial attention or subject-specific conventions. The fact that the coefficients on Treaty do not vary much even after the inclusion of these controls is a reassuring indication that the results may not simply be the consequence of unobserved selection effects.
However, it cannot be ruled out that at least part of the difference in durability is driven by nuanced considerations that the model is unable to capture. For instance, it is possible that, within a given subject matter, senatorial attention is selectively directed at certain types of agreements, such as those of particular importance, and that this selection is also correlated with durability. The included subject categories may be too crude to capture this dynamic and it is possible that a more granular measure of the subject matter would yield a richer and more complete understanding of the association between the substance of an agreement and the choice of commitment device that may explain at least part of the observed difference.Footnote 104
Future research could address this limitation by sorting agreements on a more granular level than is possible when relying on data from TIF. One particularly promising approach could result from a detailed analysis of the content of individual agreements. Analyzing the text of the agreements would allow researchers to distinguish, for instance, between bilateral tax agreements intended to avoid double taxation, which are often concluded as treaties, and other types of tax agreements. The relevant databases to conduct these types of studies exist,Footnote 105 but it has previously been infeasible to read and coherently categorize several thousand international agreements. Recent advances in computer-assisted text analysis could prove fruitful in overcoming this limitation. Indeed, scholars have already begun to employ text analysis in order to evaluate a limited set of international agreements, such as preferential trade agreementsFootnote 106 or bilateral investment treaties,Footnote 107 and the same methodology may be used to examine international agreements on a larger scale. Particularly promising methods include topic modeling and clustering, which allow the researcher to define an arbitrarily large number of categories in which to group a document based on its textual content. This method would enable the automated, granular categorization of international agreements. A more nuanced categorization acquired through such an analysis could further inform our understanding both of the role of the treaty and the possible consequences that abandoning the treaty would have on the landscape of U.S. international agreements.
A second limitation of this study is that, while it suggests that treaties retain value as a policy tool, it does not directly speak to the relative importance of the different hypotheses for the greater durability of treaties. Several mechanisms have been proposed that could potentially explain this durability, ranging from signaling theory, to the stability of senatorial preferences, to the possibility that the advice and consent process may reveal more credible information to negotiating partners. To be sure, none of these explanations are mutually exclusive; indeed, it may be naïve to assume that a single theory can explain the choice between commitment devices for every agreement. However, since all mechanisms in the present analysis lead to observationally equivalent outcomes, the findings provide little guidance to those interested in assessing and comparing the relative importance of each of the proposed explanations.
Notwithstanding these limitations, this study helps to inform the debate surrounding the continuing relevance of the treaty. The findings are consistent with the view that the treaty confers certain benefits on the parties that the congressional-executive agreement does not, in turn leading to agreements that are qualitatively different. Despite the decline in its use, the treaty appears to retain an important role as a policy tool. In particular, the optimal choice among international agreements may require a presidential administration to carefully consider the strength of the commitment, the private information revealed to the public, the domestic audience costs, and the ease with which an agreement can be terminated. Treaties and congressional-executive agreements reflect different tradeoffs among these characteristics, and abandoning the treaty may thus negatively affect the executive's ability to tailor an agreement to a particular context. Consequently, policy recommendations calling for the abandonment of the treaty seem premature and may result in unintended consequences.
To illustrate, consider again the negotiations surrounding SALT II and SORT, where Russia insisted on the use of a treaty over a congressional-executive agreement. Without the availability of the treaty instrument, it is conceivable that the parties would have reached agreements with substantively different terms. Given that Russia would not have spent any of its bargaining power on the agreement type and could instead have devoted it fully to the substance of the agreements, it appears at least plausible to assume that these alternative terms may have been more favorable to Russia. Under the assumption that the counterparties’ desire for an instrument with the characteristics of the treaty is strong enough, it may even be the case that, absent the treaty, certain agreements would not have come to fruition at all.
As noted above, some of the consequences of abandoning the treaty may be mitigated by choosing ex post congressional-executive agreements.Footnote 108 This Article's findings cannot rule out this possibility, given that data sparsity precludes comparing the durability of treaties and ex post congressional-executive agreements with much confidence. With that said, this study's review of all known statutory authorizations between 1980 and 2000 at least raises serious concerns to that end.
Indeed, the dynamics surrounding the ex post congressional-executive agreement are often described as if the executive submitted to Congress a specific agreement and Congress then considered that agreement in isolation. This is certainly an accurate description for legislative acts implementing important trade agreements. However, outside of the area of trade, the approval process often looks quite different. There, the review of known approval legislation suggests that (1) the language is often vague and it is unclear whether it is approving any specific agreement in particular; and (2) approval is typically only one small aspect in an act addressing a much broader set of substantive issues. To illustrate, consider the following language in the 1996 Balanced Budget Downpayment Act, which is thought to approve the Global Learning and Observations to Benefit the Environment (GLOBE) agreement:Footnote 109
[T]he rate for operations only for program administration and the continuation of grants awarded in fiscal year 1995 and prior years of the Advanced Technology Program of the National Institute of Standards and Technology, and the rate for operations for the Ounce of Prevention Council, Drug Courts, Global Learning and Observations to Benefit the Environment, and for the Cops on the Beat Program may be increased up to a level of 75 per centum of the final fiscal year 1995 appropriated amount.Footnote 110
While the language implies that Congress approves of the GLOBE agreement, it is difficult to read an explicit authorization into the statute. In addition, the reproduced part of the act is the only time GLOBE is mentioned and includes a total of ninety-seven words. The entire act, however, is over 10,000 words long and got approved in a single roll-call vote both in the House and the Senate.Footnote 111 So even if one were to read this as an ex post authorization of GLOBE, the authorizing text would result in less than 1 percent of the total text of the statute. Outside of trade, provisions such as these, where ex post congressional-executive agreements are ostensibly approved as one small part of a larger legislative package, are the rule, rather than the exception.Footnote 112 This leads to an approval process that is strikingly different from the advice and consent process for treaties. The latter focuses the entire and undivided senatorial attention on the approval of the agreement itself and does not directly tie its success to the future of other policy implementations. It is thus unclear whether ex post congressional-executive agreements could consistently provide the same benefits that the treaty grants. As pointed out above, empirical analyses may provide an informative answer to this question only after the ex post congressional-executive agreement is observed more frequently and in a wider variety of subject areas.
In addition to providing an affirmation of the importance of the treaty as a policy tool, this Article's findings also have implications for current debates surrounding the presidential power to withdraw from international agreements. Under the Trump administration, the United States has announced its withdrawal from a number of highly publicized agreements—such as the Paris Agreement on Climate Change, the Joint Comprehensive Plan of Action with Iran, the 1955 Treaty of Amity with Iran, and the Optional Protocol to the Vienna Convention on Diplomatic Relations—and threatened to withdraw the United States from NAFTA and NATO.
There is an active scholarly debate surrounding the scope of presidential power to withdraw the United States from its international agreements, with a particular focus on whether the constitutional hurdles to terminate congressional-executive agreements are higher than those for the treaty.Footnote 113 The results of this study suggest that, in addition to the doctrinal issues, a political economy analysis may provide valuable insights as well.
Indeed, the finding that treaties outlast congressional-executive agreements could be interpreted as indicating that treaties are harder to terminate, if not as a matter of law, then at least as a matter of political reality. We currently lack a comprehensive theory of the political costs of treaty termination. To be sure, the writings of some commentators imply that part of the political cost differential between breaching a treaty and breaching a congressional-executive agreement may be found in reputational sanctions. That is, the use of a treaty would “represent the complete pledge of a nation's reputational capital”Footnote 114 and presidents that use it “somehow put it all on the line in the diplomatic world.”Footnote 115 However, in order for this mechanism to explain why treaties are not terminated at the same rate as congressional-executive agreements, one would have to assume that the United States has a single reputation that is independent of the administration currently in power. Otherwise, it would be difficult to understand why future administrations should feel bound to promises their predecessors made.Footnote 116
This study's empirical findings are ill-suited to evaluating the theoretical merits of these claims. Future research aimed at understanding not only the legal differences but also the political implications of withdrawing from a treaty vis-à-vis the congressional-executive agreement could provide further insights and shed light onto the question of whether the fate of international agreements such as the Paris Agreement or NAFTA would have been less controversial had they been concluded as treaties instead.
VI. Conclusion
Relying on survival time analysis, this Article reveals that treaties are more durable commitments than executive agreements. In particular, there was a 15 percent probability that a typical agreement concluded as a treaty in 1982 broke down by 2012, compared to a 50 percent probability that it broke down when concluded as an executive agreement. The findings are consistent with the view that treaties remain an important policy tool for the United States because they represent a promise that is qualitatively different from a promise made as an ex ante congressional-executive agreement.
At the same time, the Article raises new questions regarding the mechanism responsible for the greater durability of treaties. The empirical findings suggest that renewed scholarly focus on this issue, and on the political costs of agreement termination, provide fruitful ground in which to grow our understanding of the practical implications for U.S. policy of choosing between treaties and congressional-executive agreements.
Appendix
Details on Model Selection
As explained in the text, because international agreements can go out of force at any time, survival times are continuous in nature. However, since survival times are measured only once per year when TIF is published, the data can best be described as continuous data that is grouped by year. For truly continuous data in which an event can happen at any point in time, the Cox proportional hazard modelFootnote 117 has established itself as the preferred choice by researchers,Footnote 118 as it is a semi-parametric model that only relies on few assumptions. The popularity of this model stems from the fact that it can be estimated without making any parametric assumptions about the baseline hazard rate. For instance, the researcher does not need to assume that survivability decreases at a constant rate over time, exponentially or in any other predefined way. However, the Cox model assumes that there are no ties in the data, meaning that no two observations have the exact same survival time. This is due to the fact that ties cannot occur if survival times are measured on a truly continuous scale. Researchers have developed several techniques make to the Cox model tractable even in the presence of ties. The most precise approach is the “exact method” developed by Kalbfleisch and Prentice.Footnote 119 Intuitively, if two subjects i and k survive exactly n periods, the exact method considers the alternative that i survived longer than k and the alternative that k survived longer than i and opts for the one that is more likely.Footnote 120 However, in datasets with many subjects, periods, and ties, the exact method is not feasible as it is computationally very intensive. The “Efron method”Footnote 121 provides an approximation to the exact method that does not suffer from comparable resource constraints but is a little less precise.
An alternative to the Cox model is a parametric survival model, meaning a model in which the baseline hazard rate is assumed to be of a specific form. Among the parametric models, the complementary log-log discrete modelFootnote 122 is the uniquely appropriate model for grouped continuous data.Footnote 123
Whether to prefer the Cox model in combination with an Efron approximation over the complementary log-log discrete model cannot be answered in a general way. Simulations show that even with heavily tied datasets, the Efron approximation often achieves very accurate results.Footnote 124 As a rule of thumb, Chalita et al. propose to compute the quantity
 $$pt = \displaystyle{{nf-r} \over n}$$
where nf is the number of events (here, agreements that went out of force), r is the number of unique survival times, and n is the number of agreements.Footnote 125 For 0 ≤ pt < 0.2, Chalita et al. suggest a continuous model with likelihood approximation; for 0.2 ≤ pt ≤ 0.25, both discrete and continuous models can be used; for pt > 0.25, a discrete model is preferred. Here, pt = 0.19, which is why a Cox proportional hazard model with Efron approximation is used in the primary model specifications. The complementary log-log model serves as a robustness check.
Both the Cox and the complementary log-log model rely on the assumption that the hazard is proportional to the baseline hazard ratio. This assumption can be tested using the Grambsch and Therneau method,Footnote 126 which plots the Schoenfeld residuals against the rank of the time intervals. If the proportionality assumption holds, then there should be no systematic pattern. In a formal test of non-proportionality, thirty-one of 264 (or 11 percent) covariates yield significant p-values implying a violation of non-proportionality. Reassuringly, the covariates of interest are not among them. However, even for the remaining covariates, the disproportionality is of little concern for two reasons.
First, note that the Grambsch and Therneau test was developed in the medical context where sample sizes are typically smaller than one hundred, making the test insensitive to minor disproportionalities. For sample sizes as large as in this study, small confidence intervals lead to significant p-values even if the data reveals negligible disproportionalities. In addition to the formal tests, visual examination of the Schoenfeld residuals is thus recommended.Footnote 127 Such a visual examination yields no significant violations of the proportional hazards assumption for any of the subject matter covariates, and a violation only for a handful of countries, typically those with whom the U.S. has only few agreements, such as Burma, Ecuador, or New Caledonia. The corresponding graphs are included in the online appendix.
Second, note that the concern for a violation of the proportional hazard assumption stems from the medical sciences, where it is of great importance whether a drug has an inverse or possibly a reverse effect on a subgroup of patients. However, in the social sciences, researchers are typically interested in average covariate effects across the entire sample. As Allison highlights, even in cases where the proportionality assumption is violated, estimates can still be interpreted as average covariate effects.Footnote 128 Violations of the proportionality assumption thus do not present a threat to the interpretability of the coefficients for most social scientific studies such as the present one.Footnote 129
Online Appendix
Supplementary material for this article can be found at https://doi.org/10.1017/ajil.2018.103.


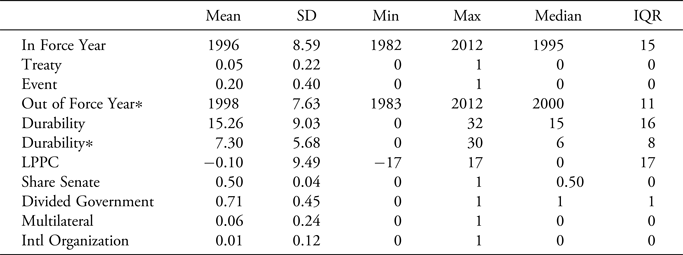
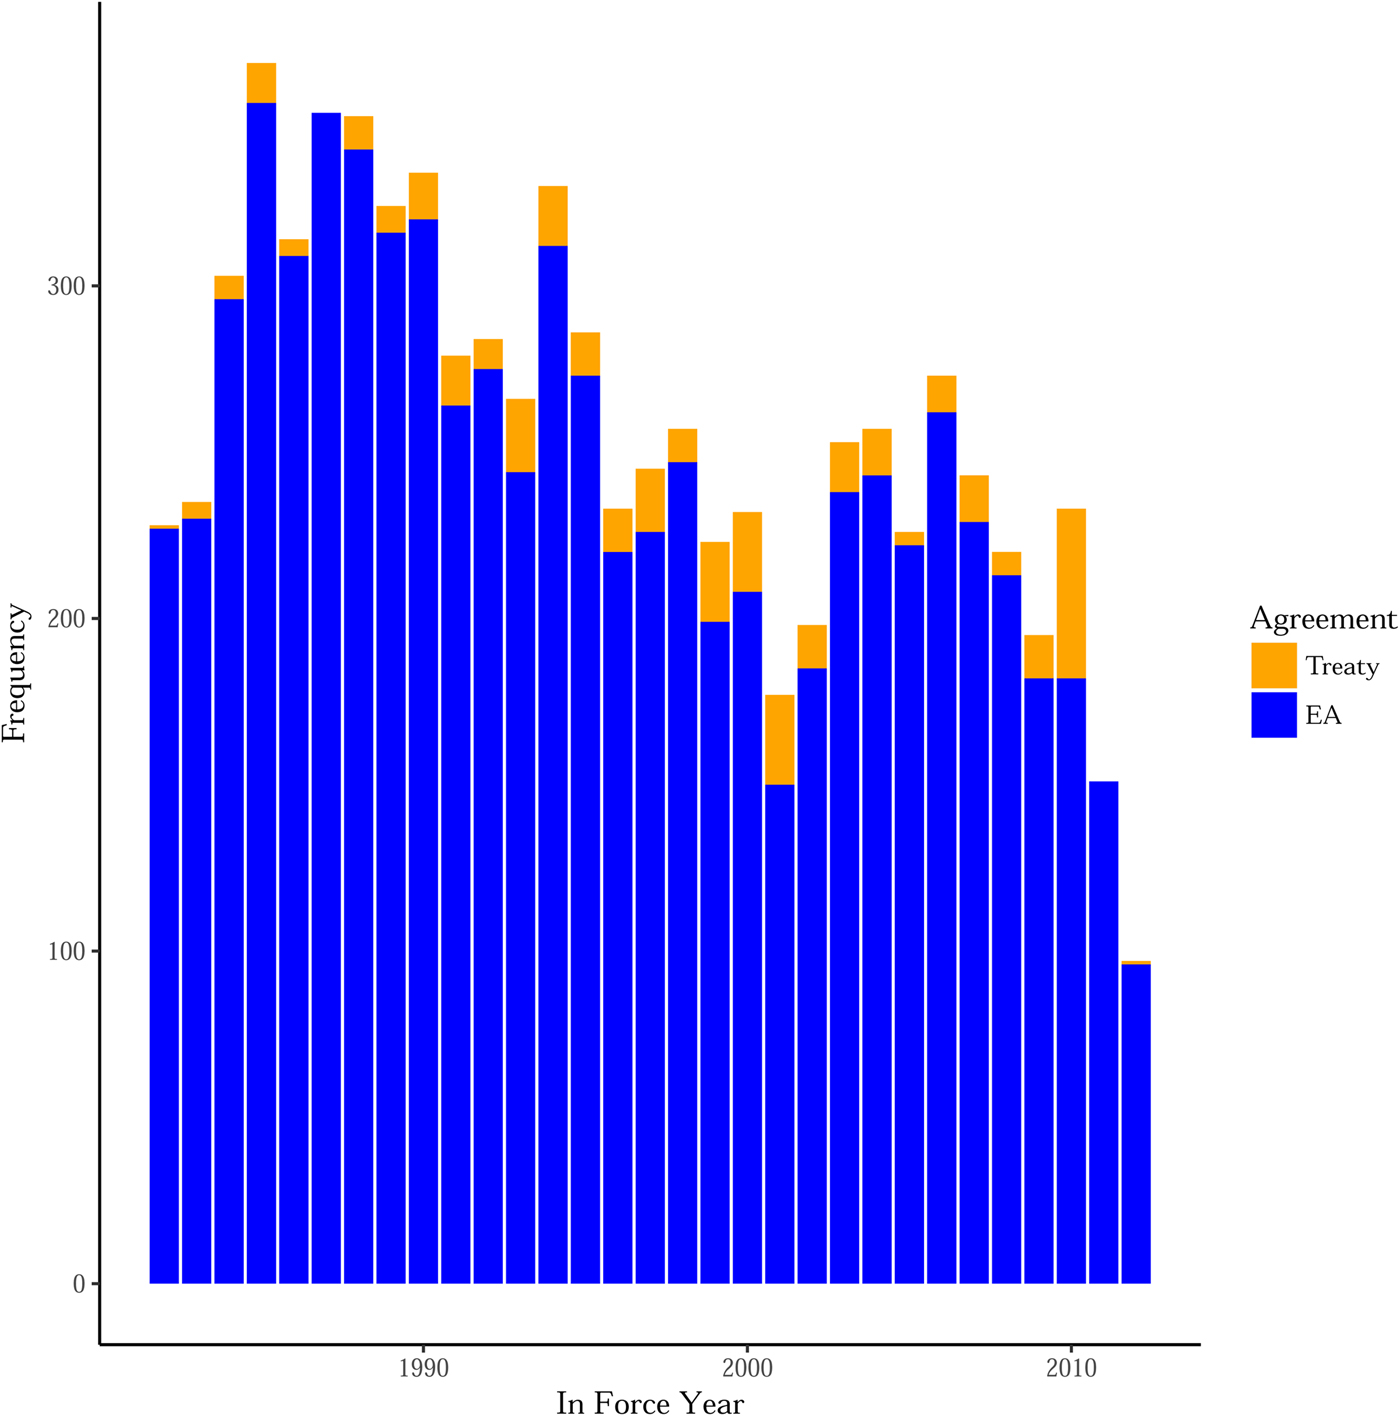
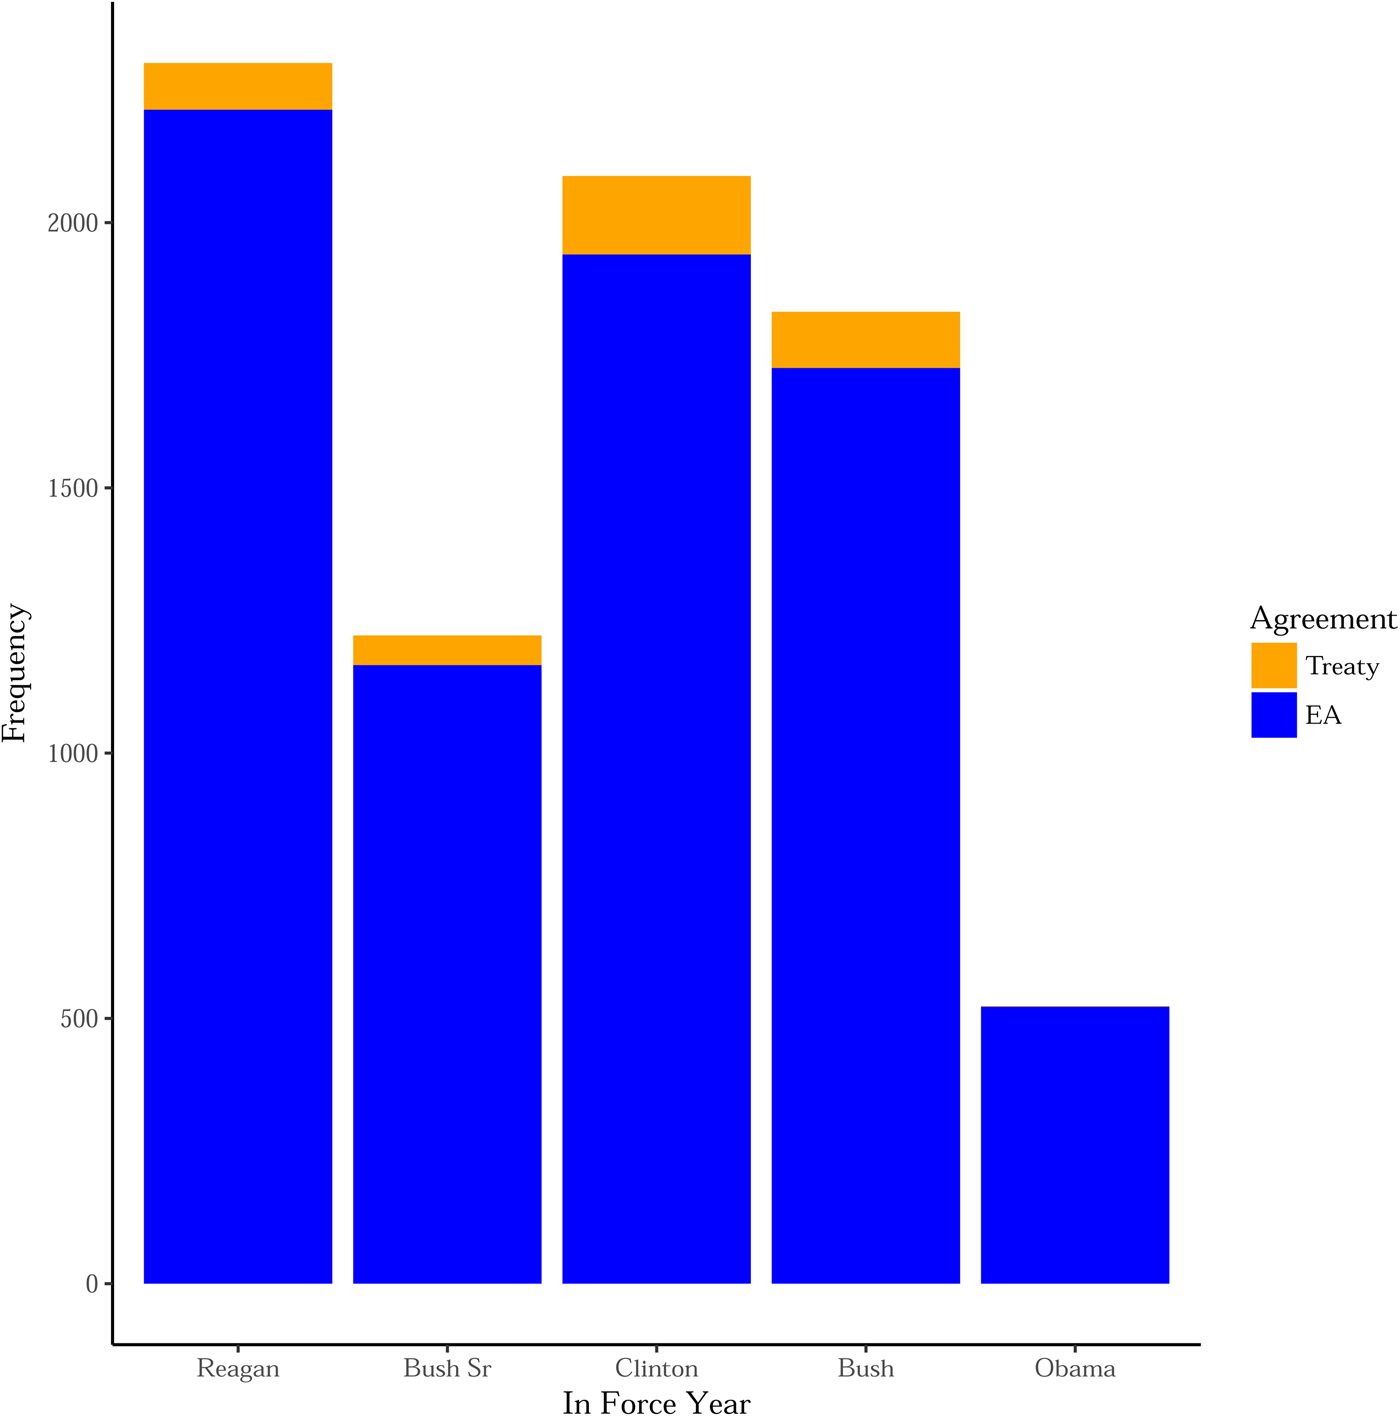
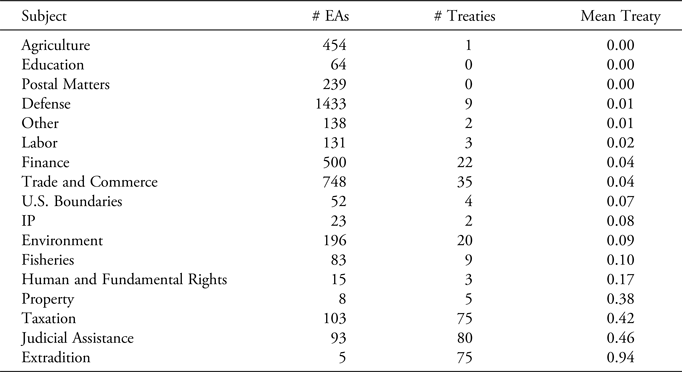
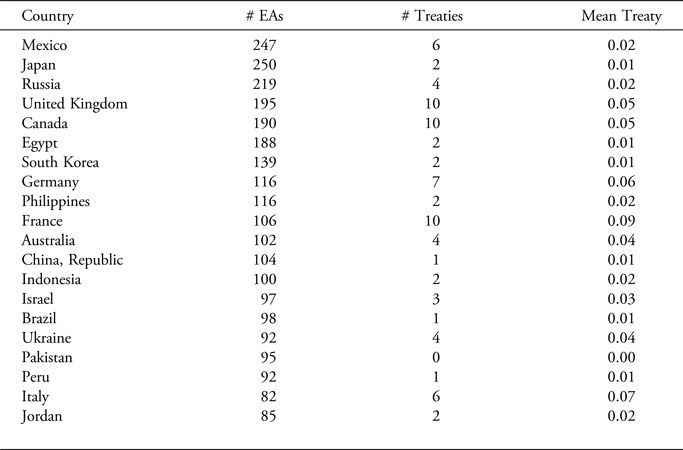
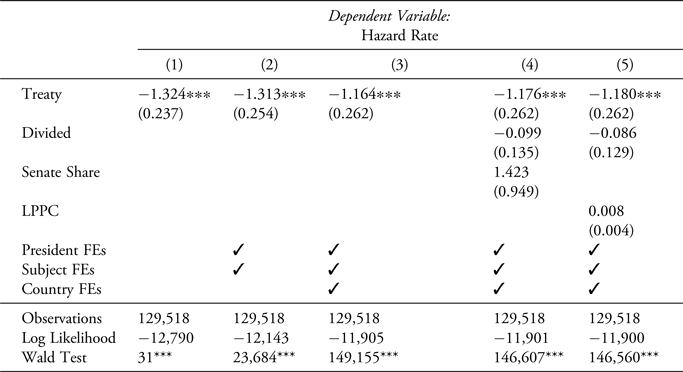
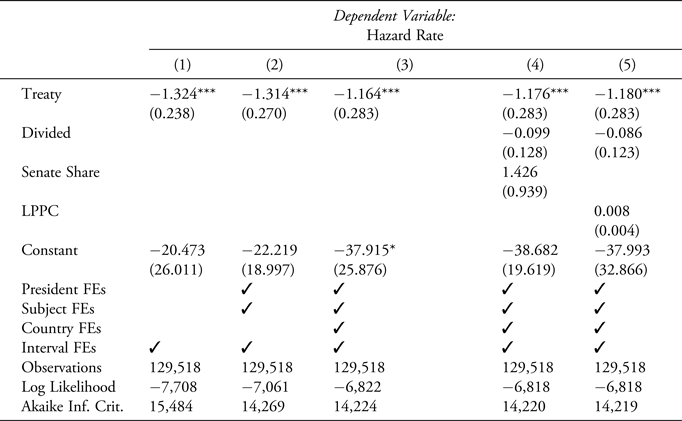

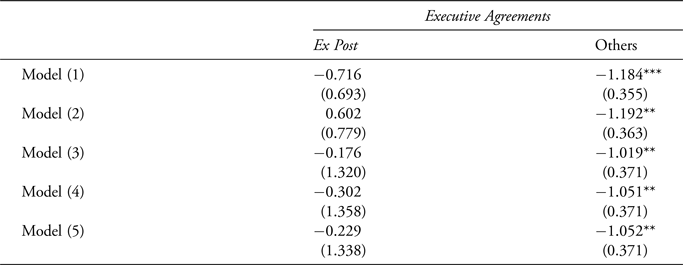
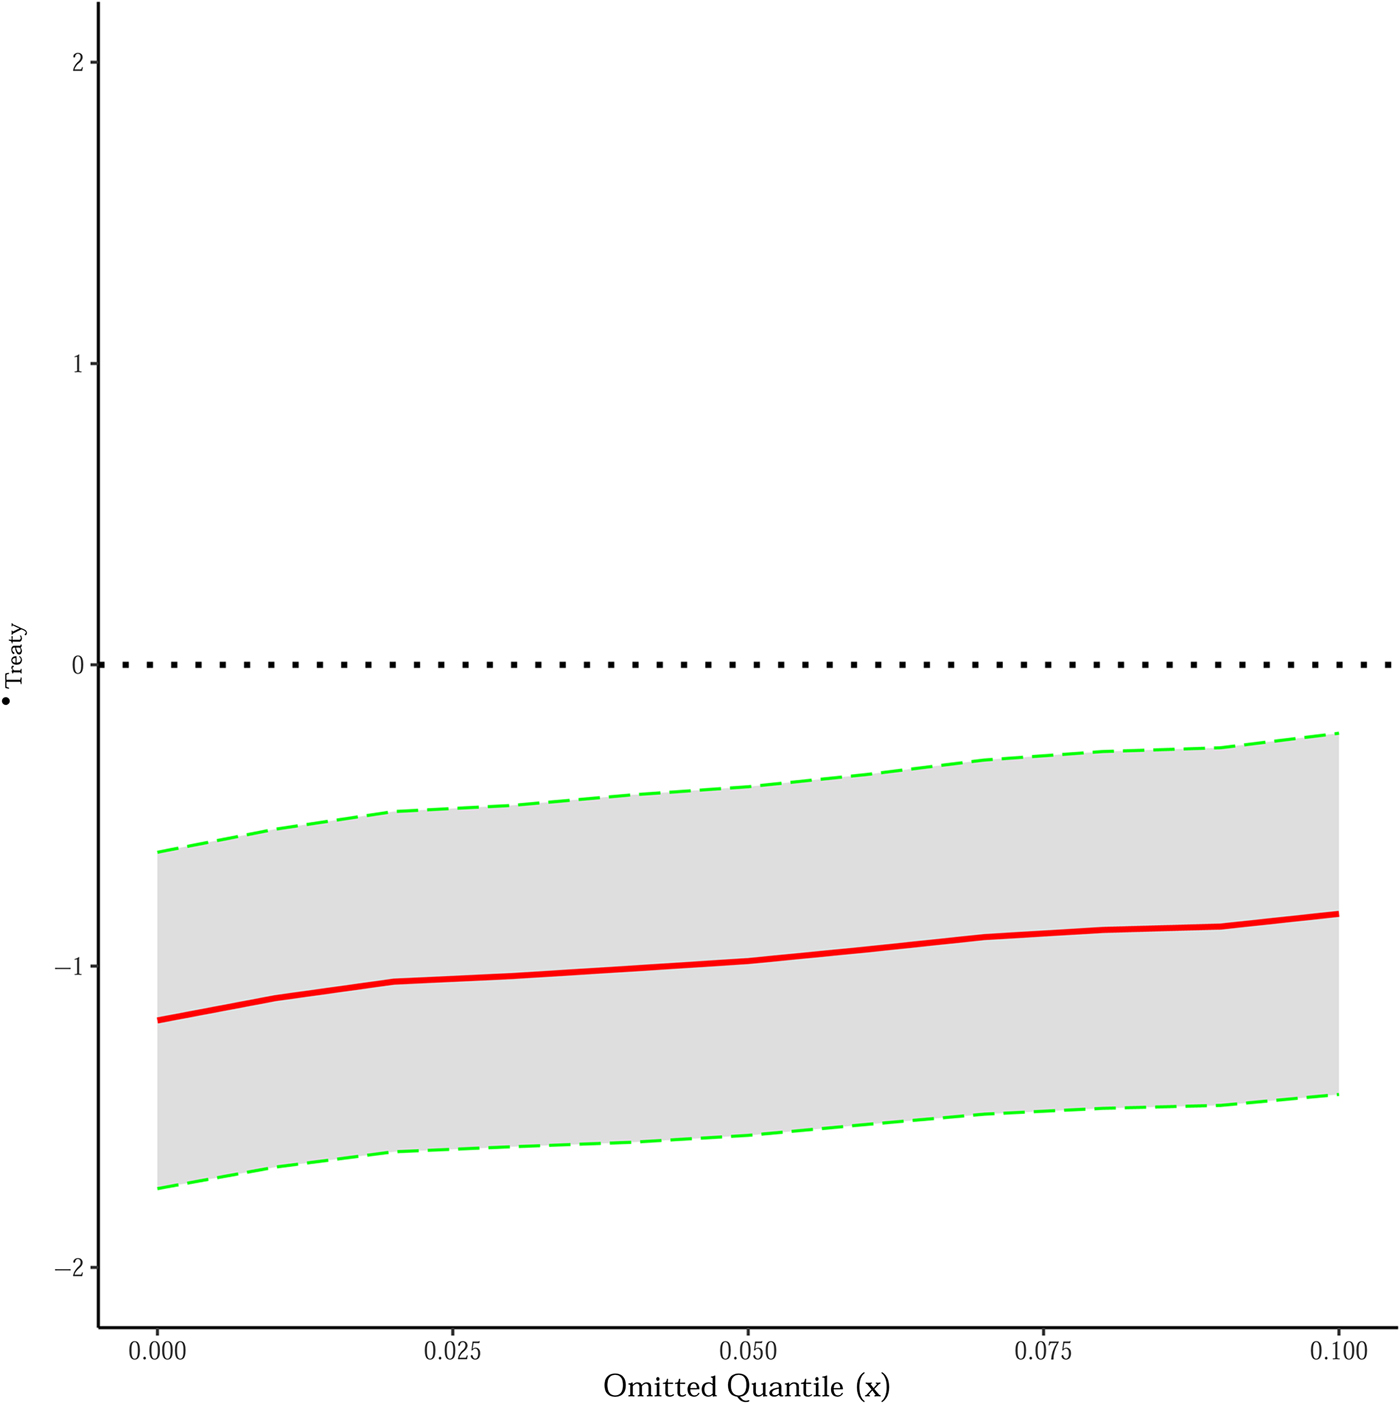




Target article
Giving the Treaty a Purpose: Comparing the Durability of Treaties and Executive Agreements
Related commentaries (4)
Duration ≠ Seriousness of Commitment: An Empirical and Theoretical Critique of Nyarko's Treaties vs. Executive Agreements
Introduction to the Symposium on Julian Nyarko, “Giving the Treaty a Purpose: Comparing the Durability of Treaties and Executive Agreements”
Samsons or Methuselahs? The (Potential) Virtue of Article II Treaties
Senate Treatment of Select International Agreements, 2013–2018