1 INTRODUCTION
During recent years, the Bolivian government has taken advantage of the commodity trade boom on global markets in order to foster redistributive policies (CEPAL 2010; PNUD 2010). For instance, by increasing the fiscal burden on oil and gas exploitation, the government has fuelled different programmes aimed at the expansion of social public expenditureFootnote 1. Furthermore, given this increasing fiscal burden and thanks to the high price of oil and gas on world markets, budget deficits have been substantially reduced to the extent that some years have closed with fiscal surpluses. Whereas these achievements may represent a positive change, some scholars are skeptical about any long-term positive consequence. For instance, it has been argued that the current fiscal burden on gas and oil activities hampers the long-term sustainability of the sectorFootnote 2. Others add that although fiscal surpluses represent a positive change, dependence on natural resources revenues may increase the vulnerability of the system to the evolution of the global economy (see Fundación Jubileo 2012b). In the same vein, it has been stressed that a non-negligible share of the increase in public spending has been «wasted» on unproductive expenses and did not necessarily benefit the less favoured components of the Bolivian populationFootnote 3.
The aim of this paper is to contribute to this debate from a historical perspective and to identify some of the limitations which previously restricted the effectiveness of state intervention. To this end, it offers new detailed quantitative evidence which differentiates it from previous research on the historical evolution of Bolivian public finances. Indeed, while earlier research on this topic has focused on specific periods of the 20th century, the present study covers more than 120 years of the history of the RepublicFootnote 4. Moreover, while Gallo (Reference Gallo1991) offers evidence on the composition of expenditure for the period 1911-1950 only, the database that is presented in this paper provides complete evidence of both expenditure and revenue composition since 1900Footnote 5. In addition, this paper benefits from the reconstruction of the Bolivian GDP elaborated by Herranz and Peres-Cajías (Reference Herranz and Peres-Cajias2013) and offers for the first time a long-term and comparative study of several Bolivian fiscal indicators in relative terms.
Using this new quantitative evidence, the paper shows that Bolivian government revenues and expenditures were particularly low and volatile until the late 1980s. The paper also proves that the importance of social public expenditure within total public spending has been growing since the late 1930s. As for the structure of public revenues, the paper stresses that, besides some modifications in the relative importance of each category, the Bolivian government has always had an unbalanced structure: from the last quarter of the 19th century to the early 1980s, the state was highly dependent on international trade taxes; later on, on indirect internal taxes and revenues derived from oil and gas exploitation. Finally, the paper shows that, largely because of this extreme dependence on certain revenue sources, central government revenues have usually been insufficient to cover expenditures, thus fostering constant budget deficits which sometimes reached a level that was especially damaging for the overall economy. The inflationary process from May 1984 to September 1985 — one of the highest in world history — is certainly the most salient example of this negative impact.
Hence, this historical analysis suggests that the recent expansion of social public expenditure does not represent a new feature but an acceleration of one of the most significant characteristics of Bolivian public finances over most of the 20th century. This finding requires further research in order to analyse who benefited from the expansion of social spending and to identify its impact on the evolution of Bolivian social indicators. However, the aforementioned findings would also suggest that the potential redistributive impact of Bolivian public finances has not been necessarily, or not only, restricted by the lack of an explicit commitment towards redistributive expenses, but by an extreme vulnerability on the revenue side. Therefore, in line with previous studies (Engel et al. Reference Engel, Galetovic and Raddatz1999; Breceda et al. Reference Breceda, Rigolini and Saavedra2009; Goñi et al. Reference Goñi, López and Servén2011), this paper stresses that the current debate in Latin America and Bolivia about the effectiveness of redistributive policies should focus not only on the allocation of public spending, but also on those policies which may ensure a sustainable flow of revenues.
2 THE NEW BOLIVIAN PUBLIC FINANCE DATABASE
Until the end of the 20th century, most analyses of the long-term evolution of Latin American public finances were primarily based on the Argentinean, Brazilian and Mexican experiences (Topik Reference Topik1987; Díaz-Fuentes Reference Díaz-Fuentes1999; Bordo and Cortés-Conde Reference Bordo and Cortés-Conde2001; Cortés-Conde Reference Cortés Conde2006; Comín and Díaz-Fuentes Reference Comín and Díaz-Fuentes2007; Sánchez-Santiró Reference Sánchez-Santiró2011). During the last few years, interest in the fiscal history of other Latin American countries has increased, involving both high-income economies such as Chile (Wagner et al. Reference Wagner, Jofré and Lüders2000), and low-income countries such as Guatemala (ICEFI 2007). In most cases, historical narratives on the topic have been accompanied by detailed long-term databases (Junguito and Rincón Reference Junguito and Rincón2004; Azar et al. Reference Azar, Bertino, Bertoni, Fleitas, Garcia, Sanguinetti, Sienra and Torelli2009). This paper adds a new case study to this growing literature by analysing the Bolivian case and offering detailed long-term series of both public revenue and expenditureFootnote 6.
The new dataset is based on exhaustive archival research both in Bolivia and abroad, which has made it possible to identify the main primary and secondary sources of the long-term evolution of Bolivian public revenues and expendituresFootnote 7. The distribution of revenue and expenditure among the different categories has followed the most widely accepted international definitions (IMF 2001). Expenditures have been allocated to each category according to the ministry in charge. As for revenues, when the nature of a specific revenue was not clear, I have based its classification on the analysis of tax and income legislationFootnote 8. Because of data availability constraints, the series include total (current plus capital) expenditure, but only current (and not capital) revenues. Hence, the database is organised according to an adapted version of the IMF functional classification (IMF 2001) which considers six categories and three sub-categories in the case of expenditures and three general categories with several sub-categories in the case of revenues.
Additional data restrictions have affected the estimation. For instance, the initial year of each series — 1882 in the case of revenues and 1900 in the case of expenditures — is determined by the availability of data. Furthermore, the discovery of substantial differences between cash and budgeted flows for those years for which both data are available prevented me from using budget information — even in those few years for which no data on the cash flows could be foundFootnote 9. Hence, unlike previous work (Barragán and Peres-Cajías Reference Barragán and Peres-Cajías2007), my database is always based on cash revenue and expenditure flows. In this regard, since there are no systematic data for the cash revenues and expenditures of either the departments or the municipalities between 1882 and 1989, my series only include the public finances of the central government from 1882 to 2010, and that of general government from 1990 onwards.
Despite these coverage limitations, the new database constitutes a reasonably good approximation to the main features of the history of Bolivian public finances from the last quarter of the 19th century onwards. First, the Law of 21 November 1872, divided Bolivian public finances into three different administrations — the National Treasury, the Departmental Treasuries and the Municipal Treasuries — and officially recognised the end of the central government's dependence on the indigenous capitation tax and the consolidation of international trade taxes as the main revenue source. This fiscal change and the political stability achieved after Bolivia's defeat in the Pacific War (1879) against Chile fostered a state-building process (Klein Reference Klein2011) that may be approached through the evolution of central government revenues since the early 1880s.
Second, the focus on central government's statistics makes it possible to study the most important part of Bolivian public finances during most of the time analysed by the present work. It is true that after the Law of 1872 none of the three fiscal administrations had a clear prominence over the others (see Platt Reference Platt1982). For example, in 1882 the departments’ revenues were equivalent to 40 per cent of the central government's revenues. However, a progressive centralisation process has taken place since the mid-1900s and the size of the departments’ budgets had decreased to ca. 10 per cent of the central government's revenues and expendituresFootnote 10. The Great Depression and the loss of the Chaco War (1932-1935) against Paraguay reinforced this centralisation process, which was reflected both in legislation (Barragán Reference Barragán2007) and in the structure of public finances: between the 1930s and the 1980s the departments’ budgets represented, on average, 5 per cent of the central government's revenues and expenditure (Wilkie Reference Wilkie1969; Otálora Reference Otálora1995; Barragán and Peres-Cajías Reference Barragán and Peres-Cajías2007). Hence, since they represented more or less 90 per cent of total Bolivian public finances, central government statistics may be considered a good proxy of the total revenue and expenditure of Bolivian public administrations for most of the 20th century.
Departmental and municipal finances regained relevance from the late 1980s onwards. To start with, the tax reform of 1986 established that public revenues collected by the central government had to be reallocated to different administrations: 75 per cent to the central government, 10 per cent to the departments, 10 per cent to the municipalities and 5 per cent to the universities (Otálora Reference Otálora1995, p. 107). These shares and the functions of the different administrations were subsequently modified by the Ley de Participación Popular (Popular Participation Act, 1994), the Ley 1654 de Descentralización Administrativa (Administrative Decentralization Act, 1995) and the most recent legislation on oil and gas activities (2005) (Pereira et al. Reference Pereira, Sheriff and Salinas2012). As a result of these processes, both department and municipal resources increased their relative importance as a share of the general government's total receipts. However, as highlighted in the next section, the implications of these changes can be analysed easily thanks to the availability of general government statistics from 1990 onwards.
3 BOLIVIAN PUBLIC REVENUES AND EXPENDITURES, 1882-2010: SOME STYLISED FACTS
The present section uses the new database to describe some of the most important stylised facts of the history of Bolivian public finances since the late 19th centuryFootnote 11. The first is the low level of the ratio between public revenues and GDP until recent decades (Figure 1). Between 1882 and the late 1950s, central government's revenues were, on average, around 5 per cent of GDP. Thereafter and until the first half of the 1980s, they increased slightly but — with the exception of some years — remained below 10 per cent of GDP. They only surpassed that level in the second half of the 1980s and subsequently continued to grow, reaching a level of 25 per cent of GDP in the late 2000s. Differences between central government's revenues and general government's revenues were not significant until 2005, when departmental and municipal revenues increased their relevance as a result of the new legislation on oil and gas activities.
BOLIVIAN CENTRAL AND GENERAL GOVERNMENT'S REVENUES AS A SHARE OF GDP (LEFT-AXIS) AND PER CAPITA (RIGHT-AXIS), 1882-2010 (%; BS. 2000).
Sources: For GDP, from 1882 to 1950, Herranz and Peres-Cajías (Reference Herranz and Peres-Cajias2013); from 1950 to 2010, from ECLAC database: www.eclac.cl; for population, see Herranz and Peres-Cajías (Reference Herranz and Peres-Cajias2013); for prices and revenues, see text.

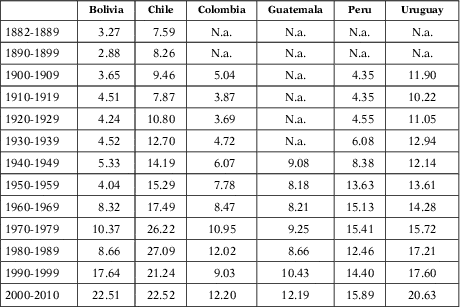
A regional comparison confirms the low level of Bolivian central government revenues for most of the period under study (Table 1). Indeed, during the last quarter of the 19th century, whereas Bolivian revenues remained around 3 per cent of GDP, Chilean figures were around 8 per cent of GDP. During the first half of the 20th century, Bolivian public revenues were around 4.5 per cent of GDP, a figure more or less similar to those of Colombia and Peru, but far from the ratios in Chile and Uruguay. From 1952 to 1985, Bolivian public revenues reached on average around 7 per cent of GDP, one of the lowest figures in Latin America. Thus, it was not until the 1990s when Bolivian public revenues started to converge with the regional average. Nowadays, the Bolivian ratio between central — as well as general — government's revenues and GDP is among the highest in the regionFootnote 12.
LATIN AMERICAN CENTRAL GOVERNMENT'S REVENUES AS A SHARE OF GDP, 1882-2010 (%, TEN YEAR AVERAGES)
Notes: N.a.: Not available.
Sources: (a) Bolivia, see text; (b) other countries from 1900 to1989; Chile: Base de datos EH CLIO LAB, Iniciativa Científica Milenio Mideplan; Colombia: Kalmanovitz (Reference Kalmanovitz2011); Guatemala: ICEFI (2007); Peru: Portocarrero, Beltrán and Romero (Reference Portocarrero, Beltrán and Romero1992); Uruguay: Azar et al (Reference Azar, Bertino, Bertoni, Fleitas, Garcia, Sanguinetti, Sienra and Torelli2009); (c) other countries from 1990 to 2010 from ECLAC database: www.eclac.cl.
Expenditures were generally higher than revenues, but the ratio between public expenditures and GDP was also low until recent decades (Figure 2). Bolivian central government's spending was around 5 per cent of GDP until the late 1950s, when it started growing steadily. Despite this increase, central government spending was still below 15 per cent of GDP in the late 1970s. During the early 1980s, central government's spending soared, which led to serious macroeconomic disorder that was only controlled in the last months of 1985. Some important reforms were implemented thereafter and central government spending started to grow again on sounder bases up to ca. 25 per cent of GDP in the late 2000s. Differences between central and general government's expenditures during the 1990s were somehow higher than in the case of revenues, but still modest until the mid-2000s.
BOLIVIAN CENTRAL AND GENERAL GOVERNMENT'S EXPENDITURES AS A SHARE OF GDP (LEFT-AXIS) AND PER CAPITA (RIGHT-AXIS), 1900-2010 (%; BS. 2000).
Source: See Figure 1.
Beyond the low level of both Bolivian public revenues and expenditures until recently, the graphs also stress the intense fluctuations in both variables. The intensity of these fiscal fluctuations can be measured by estimating the volatility of real public revenues and expenditures (Table 2)Footnote 13. The estimations stress that, in general terms, the volatility of both variables tended to decrease over time and to be higher in the case of revenues. However, during the 1930s, 1950s and 1980s, volatility levels sharply increased compared to the previous decades and, moreover, during the 1950s and 1980s volatility was higher in expenditures than in revenuesFootnote 14. Since the 1990s, by contrast, volatility levels of both public revenues and expenditures experienced a significant decrease and reached the lowest levels in the history of Bolivian public finances.
PUBLIC REVENUE AND EXPENDITURE VOLATILITY, 1880-2010 (TEN YEAR AVERAGES)

Notes: N.d.: no data.
Sources: Volatility has been calculated on the basis of the new database as the standard deviation of  $$\[--><$>\ln ({{X}_t}/{{X}_{t{\rm{ - 1}}}})<$><!--$$
, being X revenue or expenditure in real terms; see Jacks, O'Rourke and Williamson (2011).
Therefore, the previous evidence shows that Bolivian public finances were particularly restricted for a long time by their small size relative to the aggregate economy as well as by the volatility of the resources available. In order to understand the reasons for the persistence of these restrictions as well as the driving forces of the recent changes, the next section analyses the composition of both public revenues and expenditures.
4 BOLIVIAN PUBLIC SPENDING: WHERE WAS IT ALLOCATED AND HOW WAS IT FINANCED?
The present section focuses on the composition of Bolivian public finances throughout the period under study. In the case of expenditures, Figure 3 shows that, at the beginning of the 20th century, the Bolivian central government was concentrated on general administration, defense and economic expenditures. However, during the second half of the 1900s, the share of social expenditure within central government spending started to increase and reached 10 per centFootnote 15. This structure remained stable until the Chaco War (1932-1935), when defense spending soared to 80 per cent of total spending. After the war, the relative importance of defense expenditures decreased significantly, whereas social spending started to increase once more. The relative importance of the latter grew once more after 1956 in a process that, despite some oscillations, lasted until the beginning of the 21st century, when it reached a level of around 50 per cent of central government spendingFootnote 16.
CENTRAL GOVERNMENT'S EXPENDITURE COMPOSITION, 1900-2010 (SHARE OF TOTAL EXPENDITURE, %)
Sources: See text.
Notes: From 1971 to 1984, General Public Services includes Public Order.
Hence, the increasing relevance of social public expenditure is clearly one of the most important features of the history of Bolivian public finances over most of the 20th century. The initial push was associated with the centralisation of education and the educational reform embraced by the liberal governments (Cajías Reference Cajías2011)Footnote 17. Further increases were driven by the centralisation of health spending during the years of the so-called Military-Socialist regimes (1936-1939) as well as by an important increase in education spending (Barragán and Peres-Cajías Reference Barragán and Peres-Cajías2007)Footnote 18. These last changes were linked with the emergence of new economic and political groups (such as urban middle classes or the mining and urban workers) and the response to their political demands by some of the governments that held power after the Chaco War (Wilkie Reference Wilkie1969; Dunkerley Reference Dunkerley2003; Klein Reference Klein2011, pp. 178-208).
The revolution of 1952 represented a new landmark in the prioritisation of social spending. The revolution brought about an aggressive redistribution of land, the nationalisation of the three largest mining companies and the establishment of universal franchise. These changes involved a considerable increase in the intervention of the state in the economy and were justified as the best way to achieve two of the main goals of the revolution: economic redistribution and the diversification of the economy. Under these circumstances and the constant pressure from the social movements which made the revolution possible — namely urban and rural workers — social spending grew substantially once the initial macroeconomic imbalances provoked by the revolution were corrected (Dirección Nacional de Informaciones 1962). Although some of the priorities of the revolution were radically modified during the time of military dictatorships (1964-1982) and beyond, the ideological differences among these different military governmentsFootnote 19, social public expenditure and, particularly, education spending continued to increase during the 1960s and 1970s.
Once democracy had been restored (1982), the expansion of social expenditure was not only driven by education spending but also by health and welfare expenditures. From 1985 to the early 2000s, this increase was related with the implementation of a new economic model which, following the Washington Consensus guidelines (Williamson Reference Williamson2004), paid particular attention to social public spendingFootnote 20. In contrast, the expansion of social public expenditure from the mid-2000s onwards is associated with the interest of Evo Morales’ administration — which explicitly rejects the Washington Consensus paradigm — in the expansion of social services across the entire country (PNUD 2010). This process highlights, once more, that the current importance of social public expenditure appears as the accumulation of policies applied by different governments which very often embraced opposing ideologiesFootnote 21.
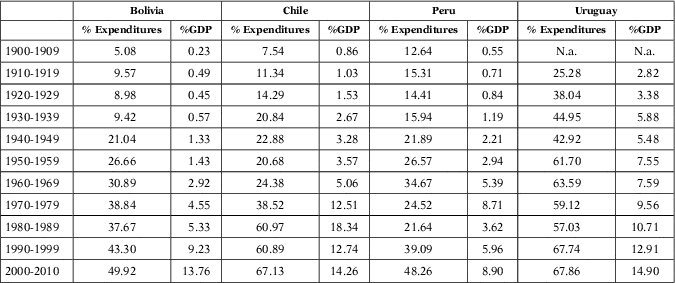
The significance of this phenomenon can be better understood by looking at the evolution of social public expenditure in other Latin American countries (Table 3)Footnote 22. The comparison shows that the share of social spending within total expenditure was smaller in Bolivia than in the rest of countries throughout the first third of the 20th century. Thereafter, the increase in Bolivia closed the gap with both Chilean and Peruvian levels. Moreover, during the 1950s and 1960s, the relative importance of social spending in Bolivia was higher than in Chile. This fact changed from the 1970s onwards, but the relative importance of social spending within total expenditure in Bolivia has remained slightly superior to the Peruvian figure. Nevertheless, it must be noticed that the Bolivian ratio of social spending to GDP did not approach the figures presented in the rest of countries until the 1990s.
SOCIAL PUBLIC SPENDING IN LATIN AMERICA AS A SHARE OF CENTRAL GOVERNMENT'S TOTAL EXPENDITURE AND AS A SHARE OF GDP, 1900-2010 (%, TEN YEAR AVERAGES)
Notes: N.a.: Not available.
Sources: See Table 1.
Therefore, the comparative perspective suggests that the priority of social spending within total expenditure must not be neglected in the Bolivian case from the 1940s onwards, once it achieved ratios similar to some of the most developed countries in the region. However, it also suggests that the economic impact of this increasing fiscal priority would not necessarily be outstanding given the low level of expenses in relation to the aggregate economy. The presence over long periods of this disparity between a high priority on social spending and scarce resources, introduces different research questions into the debate. The following paragraphs analyse the difficulties faced by successive Bolivian governments in order to finance these increases in social spending by looking at the composition of public revenues.
To start with, Figure 4 presents the composition of public revenues and shows that international trade taxes were the most important revenue from the last quarter of the 19th century to the early 1980sFootnote 23. Thus, indirect internal taxes accounted for a significant share of Bolivian public revenues only from the late 1980s onwards. These taxes represent more than half of total current revenue nowadays. Meanwhile, and particularly since 2005, non-tax revenues have become important for both central and general government. By contrast, with the only exception of the 1940s, direct taxes have always had a minor importance and, similarly, social contributions have commonly represented <10 per cent of current revenueFootnote 24.
CENTRAL GOVERNMENT'S REVENUE COMPOSITION, 1882-2010 (SHARE OF TOTAL CURRENT REVENUE, %)
Source: See text.
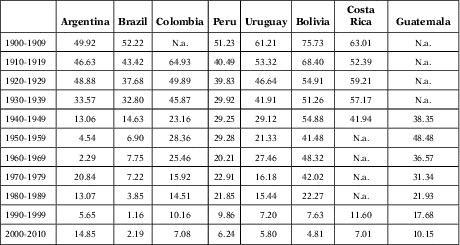
The centrality of international trade taxes in the history of Bolivian public finances may be highlighted, again, by means of a regional comparison (Table 4). The table confirms that these taxes were the most important revenue in Latin America until the Great Depression (Coatsworth and Williamson Reference Coatsworth and Williamson2004). However, it also indicates that there were different patterns of fiscal transition in the region from international trade to indirect internal taxes (Cortés-Conde Reference Cortés Conde2006)Footnote 25. In this context, the Bolivian government's persistent dependence on international trade taxes until the early 1980s may be interpreted as an extreme case of the external tax dependence that prevailed in the poorer Latin American economiesFootnote 26.
INTERNATIONAL TRADE TAXES IN LATIN AMERICA, 1900-2010 (SHARE OF CENTRAL GOVERNMENT'S CURRENT REVENUE, TEN YEAR AVERAGES)
Notes: N.a.: Not available.
Sources: (a) Bolivia, see text; (b) Guatemala: ICEFI (2007); (c) Costa Rica from 1900 to 1948 from Román (Reference Román1995); (d) Rest of countries from 1900 to 2000 and Costa Rica from 1992 to 2000 from MOxLAD database: http://moxlad.fcs.edu.uy/; (e) All countries from 2001 to 2007 from ECLAC database: www.eclac.cl.
This external dependence, however, was not necessarily based on the same type of taxes over time. Indeed, as in other Latin American cases, I found that export taxes played an important role in several episodes of Bolivian economic historyFootnote 27. Thus, between the last quarter of the 19th century and the early 1980s, the Bolivian central government was sometimes dependent on custom duties and sometimes on export taxes.
This distinction is not irrelevant since it implies substantial differences in tax bases. Tax dependence on custom duties made the government rely more closely on those economic agents related with imports which, as in the rest of Latin America, can be broadly identified with urban elites and middle classes. By contrast, given the concentration levels of Bolivian exports, a higher tax dependence on export taxes implied a close fiscal relationship between the Bolivian government and a small number of economic agents. This phenomenon was especially extreme from the early 1930s to the early 1950s, when taxes paid by three «Tin Barons» — which accounted for 75 per cent of Bolivian exports — represented the bulk of Bolivian public revenuesFootnote 28.
The identification of the relevant tax bases and taxpayers also provides interesting information in the case of direct taxation. Indeed, according to Gallo (Reference Gallo1991, pp. 76-83), thanks to the control of both the Congress and local institutions, landowning elites were able to resist any increase in rural direct taxation throughout the first half of the 20th centuryFootnote 29. By contrast, during the same period of time, the Bolivian central government tried to consolidate a profit tax on mining activities and, after some failed experiences, this goal was finally achieved in 1923, when, thanks to the pressure of international lenders (Contreras Reference Contreras1990), tax collection increased substantially. Mining producers were later able to reduce tax pressure on their activities (Drake Reference Drake1989, pp. 205-206; Gallo Reference Gallo1991, pp. 108-109) and, as a consequence, the relative importance of direct taxation returned to the levels it had before the fiscal reform of 1923. Direct taxes increased again in the 1940s and, regardless of the conservative or progressive nature of Bolivian governments, became the second most important revenue source throughout that decade. These taxes, however, came overwhelmingly from very specific sources — mining and bank utilities — and, therefore, did not necessarily represent an expansion of the social groups that constituted the main government's tax basesFootnote 30.
Tax bases were also rather narrow in the case of indirect internal taxes. Indeed, until the late 1920s there was no general consumption tax and all indirect internal taxes were excises. Most of these were obtained from specific agents or economic flows and, therefore, their individual contribution to total revenues was negligible; most of the time smaller than 1 per cent of total current revenue (Mc Queen Reference Mc Queen1925, p. 36). Likewise, the new excises created during the 1930s and 1940s did not increase the relative importance of indirect internal taxes but the complexity of a system that was criticised for the high number of different and marginal taxes (Banco Minero de Bolivia 1941, pp. XX-XXIII, Pando Reference Pando1941, p. 1). Excises still represented the bulk of indirect internal taxes from the 1950s to the early 1980s, although their contribution to total revenues increased since the early 1970s thanks to the rationalisation of the system (UDAPE 1985, pp. 69-87). In any case, the prevalence of excise taxes during most of the 20th century would indicate that Bolivian governments’ ability to levy taxes internally was limited to some easily identifiable economic activities (Gallo Reference Gallo1991, p. 100; Barragán and Peres-Cajías Reference Barragán and Peres-Cajías2007, pp. 140-146).
Indirect internal taxation did not represent a clear alternative to international trade taxes until the 1986 tax reform which established a new system with fewer taxes but broader tax bases (Otálora Reference Otálora1995, p. 113; Pereira et al. Reference Pereira, Sheriff and Salinas2012, pp. 57-59). Indeed, driven by the consolidation of a new value added tax, the tax reform ushered in the transition from a fiscal system based on external trade taxes to a new one mainly financed through indirect internal taxes. This process, in turn, made it possible to increase public revenues and reduce volatility; two achievements which were further consolidated by different reforms aimed at improving tax administration (Pereira et al. Reference Pereira, Sheriff and Salinas2012, pp. 74, 113-121).
Meanwhile, taxes and non-tax revenues coming from oil and gas activities have gained a critical new role in Bolivian public finances. On the one hand, non-tax revenues from oil and gas production were vital for the initial recovery of the government's revenues in 1986, when the price of gasoline was increased by 833 per cent and a transfer scheme from «Yacimientos Petrolíferos Fiscales Bolivianos» to the central government was established (Pereira et al. Reference Pereira, Sheriff and Salinas2012, p. 57). On the other hand, the increasing relevance of several taxes on oil and gas activities, which were established when the sector was privatised in the 1990s — the 1194 Law in 1990, and the Impuesto Especial a los Hidrocarburos in 1994 — made it possible to use the domestic price of gasoline as an instrument to curb budget deficits — the so-called gasolinazos (Pereira et al., Reference Pereira, Sheriff and Salinas2012, pp. 62, 74-76, 107). Finally, the new law on gas and oil activities enacted in May 2005 introduced the Impuesto Directo a los Hidrocarburos and increased the oil and gas tax burden to 50 per cent of total production (Pereira et al., Reference Pereira, Sheriff and Salinas2012, p. 111).
Therefore, whereas the extreme dependence of Bolivian public finances on narrow revenue bases has been partially reduced since the mid-1980s, the relevance acquired recently by taxes and non-tax revenues coming from oil and gas activities has stopped this process. The importance of this phenomenon may not be negligible since, as is further explored in the next section, an extreme dependence on specific revenues may increase the vulnerability of state intervention to external shocks which, in turn, may generate negative externalities on the rest of the economy and reduce the potential redistributive impact of social spending.
5 A FIRST ASSESSMENT OF BOLIVIAN PUBLIC FINANCES: A MACROECONOMIC PERSPECTIVE
The analysis of budget deficits may be taken as a first indication of the vulnerability of Bolivian public finances throughout the period under study. Since the database does not consider transactions in non-financial and financial assets and liabilities, here, strictly speaking it is not possible to use the standard definition of budget deficit. However, the database allows us to approximate the evolution of the operating balance. This figure indicates the extent to which current revenue can finance total expenditure and constitutes «a summary measure of the ongoing sustainability of government operations» (IMF 2001, p. 38)Footnote 31. In this regard, the Bolivian data show that, on average, current revenue could only cover 80 per cent of total spending. Actually, in some periods, the gap between both variables was significantly higher than 20 per cent (1919-1922; 1944-1953; 2000-2004) or even 40 per cent (1932-1935; 1979-1985) (Figure 5).
CENTRAL GOVERNMENT AND GENERAL GOVERNMENT OPERATING BALANCES, 1900-2010 (SHARE OF TOTAL EXPENDITURE, %)
Source: See text.
It was not until the end of the First World War when budget deficits became particularly large and could not be covered by internal borrowing (Mc Queen Reference Mc Queen1925; Huber Reference Huber2001). The widening of the budget gap resulted from the expansion of expenditures and the stagnation of revenues derived from the 1920-1922 export crisis. In this context, the Bolivian central government had to resort to external borrowing, among other policies, and obtained the Stiefel Nicolaus loan (US$ 29 million) in 1922 in order to close its fiscal gap.
Meanwhile, in order to ensure repayment of the debt, international lenders required a major fiscal reform. This was enacted in 1923 and implied both an increase in the tax rate of international trade taxes and the creation of new taxes on other activities (Mc Queen Reference Mc Queen1925). International lenders also asked for the control of those sources of public revenues that were pledged to repayment of the debt through the formation of the «Fiscal Permanent Commission» (Contreras Reference Contreras1990). While these fiscal changes represented a clear undermining of Bolivian state sovereignty, they made it possible for central government revenues to increase from 2.5 per cent of GDP in 1922 to 5 per cent between 1924 and 1929.
Given the government's dependence on indirect external taxes, the 1929 external shock made Bolivian public finances unsustainable and current revenues fell in 1931 to just 2.8 per cent of GDP. However, expenditures were more rigid and, as a consequence, budget deficits widened. Because of these fiscal troubles and the closure of international capital markets, the Bolivian government had no option but to default on its external debt payments in September 1931. One year later, defense expenditure rose because of the Chaco War and total expenditure reached 8 per cent of GDP in 1933. In order to finance these additional expenditures, the government increased the fiscal burden on the mining sectorFootnote 32. These measures, however, were insufficient and the government had to resort to internal borrowing from the recently created Bolivian Central Bank (1928). This last measure had a clear incidence on inflation rates, which remained around 25 per cent yearly from 1932 to 1935.
The Military-Socialist regimes tried to maintain a high fiscal burden on mining activities. To this end, they confirmed the special tax laws enacted during the Chaco War, and also increased the rates on the foreign exchange tax. Moreover, in June 1939, President German Busch decreed that mining producers had to sell 100 per cent of their foreign exchange gains to the government. President Busch committed suicide after some difficulties in the implementation of the new tax rate and the measure was short-lived. However, the Bolivian government's attitude towards mining producers did not change and the mandatory sale of foreign exchange gains and high export tax rates for the mining sector continued to be one of the most salient features of Bolivian tax policy during the 1940s (CEPAL 1958, pp. 33-35; Gallo, Reference Gallo1991, pp. 123-128).
This policy was reinforced by the Bolivian economy's inability to increase its food production and the growing political relevance of poor urban consumers, which provoked the reduction of tariffs on foodstuff and, because of their relative importance on total imports, of overall import taxes (Gallo Reference Gallo1991, pp. 67-74). Nevertheless, the increasing fiscal burden on mining activities was not always sufficient to compensate this reduction and total current revenues were sometimes insufficient to cover total expenditures. As a consequence, the Bolivian government often had to rely on loans from the Central Bank which made domestic price levels climb.
During the initial years of the revolution (1952-1956), the new leaders had to confront the same fiscal dilemma that had been faced by former Bolivian governments: how to raise public revenues in the short run in order to curb growing political demands. The solution, once again, did not vary in relation with previous experience and the government applied a multiple exchange rate regime to take advantage of the foreign exchange gains made by the mining sector (Gómez Reference Gómez1978). The measure had some positive effects. For instance, thanks to the reallocation of mining foreign exchange gains, Bolivia completed a process of oil import substitution by 1954 (Zondag Reference Zondag1966). However, it also sharply reduced the revenues of the new public mining company («Corporación Minera de Bolivia», COMIBOL) while its expenditures were growing rapidly. Indeed, the new government decided that COMIBOL had to increase social contributions to its employees and had to hire all those miners who had lost their jobs during the 1950-1951 mining crisis (Zondag Reference Zondag1966). As a consequence, COMIBOL ran into increasing losses, which were paid by the central government with loans from the Bolivian Central BankFootnote 33. These decisions, once more, had clear macroeconomic effects: yearly inflation soared to 245 per cent in 1953 and remained around 100 per cent in 1954, 1955 and 1956.
Under this critical situation, the revolutionary government — in close collaboration with the IMF and the United States — implemented an aggressive Stabilization Plan at the end of 1956, involving the removal of previous policies and a new tax reform. The restoration of macroeconomic stability and the tax reform led to a spurt in current public revenues, but budget deficits persisted. This time, however, these were financed through U.S. donations, which represented 25 per cent of the current plus capital revenues of the Bolivian government (Wilkie Reference Wilkie1969)Footnote 34. Moreover, the support of the United States involved the renegotiation of the external debt service and allowed a new access to international capital markets (Pacheco Reference Pacheco2001). Therefore, budget deficits in the 1960s were financed through U.S. donations initially and through long-term bilateral credits thereafter (Pacheco Reference Pacheco2001), which made it possible to control the evolution of price levels.
During the 1970s, external borrowing grew massively (Villegas Reference Villegas2001) and, despite some tax diversification, Bolivian public revenues were still dependent on international trade taxes. Hence, not surprisingly, external shocks led to dramatic fiscal changes. To start with, the fall in tin exports from 1978 to 1981 (Luna Reference Luna1995, pp. 152-155) generated a reduction in current public revenues from 11 per cent to 9 per cent of GDP. This reduction was not followed by a similar reduction in expenditure because of its rigidity. Then, the rise in global interest rates and the maturity of most commercial external credits led to an increase in external debt payments (Otálora Reference Otálora1995, p. 122). Thus, budget deficits widened and, by 1981, current revenues could only finance 67 per cent of expenditures.
The fiscal gap became unsustainable from 1982 onwards, when Bolivia lost the possibility of borrowing from international capital markets. As a consequence, the government financed the gap again with internal borrowing from the Bolivian Central Bank (Morales and Sachs Reference Morales and Sachs1990) and, as a result, yearly inflation soared to 123 per cent. One year later, current public revenues fell to just 4 per cent of GDP because of a new reduction in tin exports and the Olivera-Tanzi effect on public revenues (Otálora Reference Otálora1995, pp. 96-101). Furthermore, the return of democracy in 1982 fuelled an important increase in political demands. For instance, in order to compensate for inflation losses, public employees asked for wage increases. Given the political fragility of the government, this request — among others — was accepted. Together with the increase in external debt payments, these measures raised government expenditure to 30 per cent of GDP in 1984. The government's short-term solution was both to spend the international reserves and to ask for additional Central Bank loans, but the consequence was hyperinflation: from May 1984 to September 1985 the annual variation of prices was around 1,700 per cent, one of the highest figures in world history.
Despite important recent improvements in the tax system, budget deficits and the sustainability of public finances have remained as great concerns for Bolivia during the last decades. Indeed, the 1996 pension reform had a great impact on government expenditures — around 4 per cent of GDP according to Pereira et al. (Reference Pereira, Sheriff and Salinas2012) — which, in combination with the economic stagnation provoked by the Asian recession, brought about a new episode of fiscal crisis at the beginning of the 2000s. This crisis, however, did not foster other macroeconomic imbalances thanks to sounder fiscal and monetary policies and the funding of the fiscal gap through donations and external creditsFootnote 35.
6 CONCLUSION
Especially after the defeat in the Chaco War (1932-1935), the relative importance of social public expenditure within total spending has tended to increase constantly in Bolivia. Meanwhile, there has been a tendency to finance these expenses through the expansion of very specific sources of revenues, especially international trade taxes and revenues obtained from the exploitation of natural resources. Most of the time, these revenues have been insufficient and, as a consequence, Bolivian governments have presented constant and chronic budget deficits. This fiscal gap could initially be financed with external resources, either external borrowing or donations. However, when these were unavailable, the Bolivian government resorted to credits from the Bolivian Central Bank. This solution fostered several macroeconomic unbalances, of which the hyperinflation process is by far the most salient example.
Bolivian public finances have constructed a more solid base during the last decades. Indeed, the fiscal reform of 1986 made it possible to increase tax bases which, in turn, allowed increasing current revenues and converging steadily and smoothly with the Latin American average. Whereas these achievements may bring more resources to face the fiscal priorities of the Bolivian government some caution is still needed. Specifically, the recent dependence on oil and gas taxes may increase the vulnerability of the system to external shocks which, as has been proved in this paper, may have important negative consequences on the rest of the economy.
APPENDIX 1
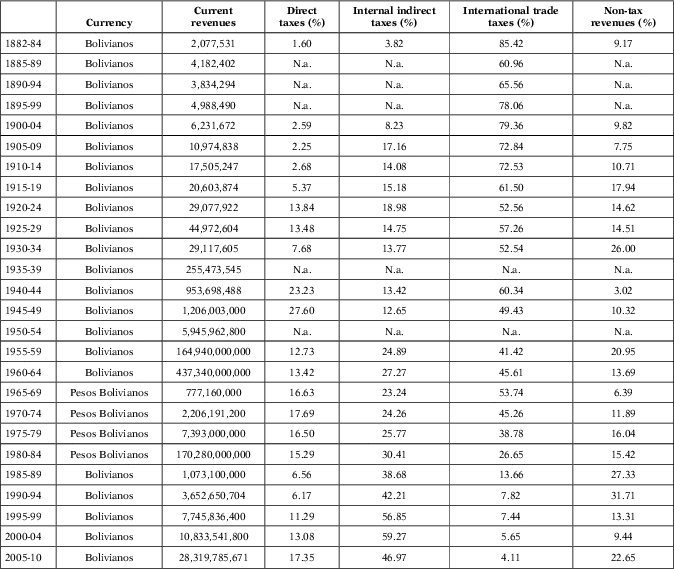
TOTAL CURRENT REVENUES AND RELATIVE IMPORTANCE OF THE MAIN REVENUE CATEGORIES, 1882-2010 (FIVE YEAR AVERAGES)
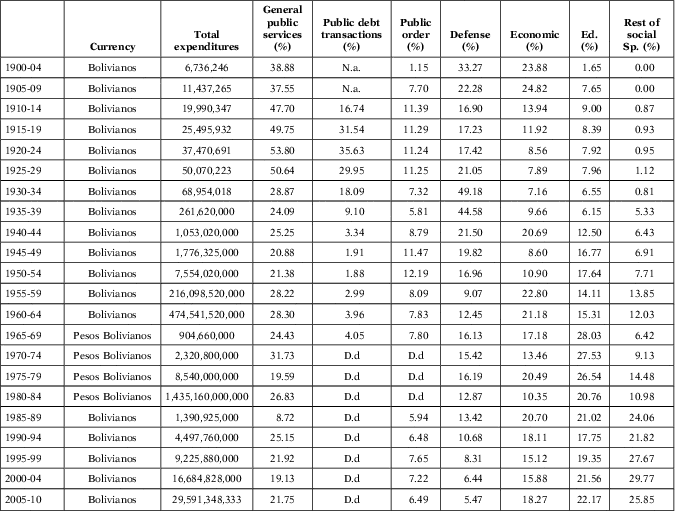
TOTAL EXPENDITURES AND RELATIVE IMPORTANCE OF THE MAIN EXPENDITURE CATEGORIES, 1900-2010 (FIVE YEAR AVERAGES)
BOLIVIAN PUBLIC FINANCES, 1882-2010. THE CHALLENGE TO MAKE SOCIAL SPENDING SUSTAINABLE
Methodological Appendix
As stressed in the main text, the new dataset is based on an exhaustive archival research both in Bolivia and abroad. In Bolivia, data were gathered from the following archives and libraries: Archivo y Biblioteca del Honorable Congreso Nacional, Biblioteca del Banco Central de Bolivia, Fundación Flavio Machicado and Archivo y Biblioteca Nacional de Bolivia. Several collections have also been consulted in Spain: Fons Casa Amèrica (Universitat de Barcelona), Fons de la Cambra de Comerç (Universitat Pompeu Fabra), and Fons d'Estadística (Universitat Autónoma de Barcelona). Some data have also been collected in the United States, specifically at the Cecil Green Library (Stanford University) and the Library of Congress (Washington).
Because of data scarcity, the reconstruction of Bolivian public revenues during the last quarter of the 19th century was made by combining different sources. Since the availability of detailed data was restricted to two single years — Memorias del Ministerio de Hacienda for 1883 and 1884 — except for external trade taxes, whose detail is available for the whole period in the 1900 National Census (Oficina Nacional de Inmigración, Estadística y Propaganda Geográfica 1904, p. XLV), it has been necessary to use Gamarra (Reference Gamarra2007, p. 142) to reconstruct aggregate revenues from 1882 to 1899. The Memorias presented an exhaustive list of all revenues collected by the Bolivian central government. The information was organised in two main groups: «Ingresos presupuestos» and «Ingresos no prespuestos». My database includes only the first group of revenues, because the second consists exclusively of financial revenues and is therefore beyond the scope of the present work. Data in the Memorias were presented in three columns: «presupuesto», «rendimiento» and «recaudado», and I have used the second one — revenue collection during the fiscal year. This information matches with the data presented in the National Census, which does not include all revenues collected, but just custom duties and export taxes.
For the first third of the 20th century, it has been possible to find an exhaustive list of all revenues collected by the Bolivian central government in different sources: the Cuentas Generales de la República de Bolivia (1900-1918), Mc Queen (Reference Mc Queen1925) (1919-1923), Memorias de la Comisión Fiscal Permanente (1924-1929) and Palenque (Reference Palenque1933) (1930-1931)Footnote 36. The linkage of these different sources did not generate any methodological problems since the figures were exactly the same in those years in which the sources coincided. For those years for which it has not been possible to find any information (1903, 1907, 1916 and 1917) the aggregate data were reconstructed using Gamarra (Reference Gamarra2007, p. 142) and Delgadillo (Reference Delgadillo2001).
A priori one would expect that both the availability and quality of primary sources would increase over time. This is clearly false in the case of Bolivian public revenues, for which it has not been possible to identify a single primary source which periodically submitted detailed information on public revenues from 1932 to 1972. Furthermore, most information is restricted to budgeted flows, which, as stated in the main text, may generate considerable biases in the analysisFootnote 37. Therefore, the estimation is based on different primary sources which — albeit their lower level of disaggregation and their lack of continuity — present some data on cash flows.
In this case, however, the linkage of different sources has required a lot of caution. A previous contrast between the information presented by Delgadillo (Reference Delgadillo2001), Gómez (Reference Gómez1978) and MOxLAD pointed to considerable differences among secondary sources and to the existence of different primary sources with different information. For instance, in the case of Delgadillo's sources, the Bolivian Central Bank Yearbooks covered, among the four main official categories or public revenues, just those generated by the «Renta Aduanera» and «Impuestos Internos», ignoring therefore the «Renta de Comunicaciones» and the «Renta Consular»Footnote 38. Similarly, in the case of Mitchell's data — which is the main source of the MOxLAD database — revenues generated by foreign exchange controls are ignored from 1936 to 1939 and from 1952 to 1956. In the following paragraphs I specify the sources that I finally used in my estimation and all the corrections made on the original figures.
Figures for the period 1932-1935 are based on the Memoria del Banco Central de 1936, which was the only source that presented disaggregated data for those yearsFootnote 39. Two sporadic publications which displayed detailed information on Bolivian public revenues were used for the estimation of disaggregated revenues from 1942 to 1944: Finanzas 1942-1943 and Anexo No. 1 of the Memoria del Ministerio de Hacienda Footnote 40. Estimates for the period 1947-1951 are based on the Memoria del Banco Central de 1951. However, in order to consider all the revenues collected by the central government, those coming from the «Renta Consular» and «Renta de Comunicaciones» — available in Boletín Estadístico No. 83 del Ministerio de Hacienda (1959) — were added to the original source. Finally, aggregate data for other years are based on Delgadillo (Reference Delgadillo2001)for 1936 and 1937 and the Boletín Estadístico No. 83 del Ministerio de Hacienda (1959) for the remaining years.
Two different types of sources were available for the period 1952-1963: the UN Statistical Yearbooks and some scattered publications of the Ministry of Finance. Whereas both groups of documents may be useful for reconstructing the structure of public revenues, my database is mainly based on the former, since the information is organised there according to the international standards that have been adopted in this research. For those years for which disaggregated data were not available (1952, 1954 and 1960), aggregate figures were taken from the Boletín Estadístico No. 83 del Ministerio de Hacienda (1959). There are some years of this period for which the information available is very different in the different sources. In those cases I have given preference to UN data.
The UN yearbooks no longer present detailed Bolivian public finance data after 1963. Therefore, aggregate revenues for the period 1964-1969 were reconstructed on the basis of the International Financial Statistics published by the IMF. The UDAPE's (1986) survey allowed a disaggregated reconstruction of public revenues for 1970-1972. The linkage between these two sources was not problematic since they presented more or less the same aggregate figures.
From the 1970s onwards, two long series are available which display disaggregated data of central government's revenues. The first is the aforementioned survey made by UDAPE (1986), which covers the period 1970-1985. The second is the IMF Government Finance Statistics, which presents disaggregated data from 1973 onwards. My database is based on the latter for two reasons: (a) the greater length of the series, (b) its higher adaptation to international standards. However, there is no significant difference between these two sources.
The reconstruction of the revenue structure for both central and general government from 1990 to 2010 benefits from the availability of on-line information Moreover, this information is provided by three different institutions: UDAPE, the Economic Commission for Latin America (ECLAC) and the IMF (although the IMF general government data only starts in 2002). Despite this data abundance, it is still necessary to make a careful analysis of the different sources, because not all of them display the information in the same way. For instance, the structure of revenues in the UDAPE website is based on an idiosyncratic Bolivian classification and, therefore, requires a complete reallocation of the different revenues to adapt them to international criteria. In addition, the statistical information provided by the three sources does not match perfectly. A comparison between the three sources indicates that UDAPE tends to overestimate tax revenues by classifying as taxes some revenues that can hardly be considered as such by international standards. I have finally relied on the ECLAC series, because they organise the information according to international classifications, and have a greater time span in the case of the general government statistics than the IMF. Moreover, since the aggregate figures of both ECLAC and IMF are very similar, the link of the ECLAC data with the estimates for the previous period does not involve any difficulty.
As for public spending, I have used the Cuentas Generales de la República de Bolivia for the reconstruction of each ministerial expenditure from 1900 to 1909. This information has been linked with Palenque (Reference Palenque1933), which is also based on the Cuentas Generales for 1911-1931. For the period 1932-1966 I have used the disaggregated data provided by Wilkie (Reference Wilkie1969). The linkage between Palenque's and Willkie's series is not problematic since differences between both series are always lower than 1 per cent in those years in which both series coincided (1930 and 1931). On the other hand, my series is ca. 2 per cent higher than Wilkie's because I included earmarked expenditures («Gastos destinados»; those expenditures that were directed to very specific destinations and were financed through very specific taxes) among «Other expenditures». For 1967-1972, I used the information available in Estadísticas Económicas de USAID, which presents the same data as Wilkie, but with a higher degree of aggregation. Finally, the 1973-2010 period has been reconstructed by using the IMF Government Financial Statistics CD-database.
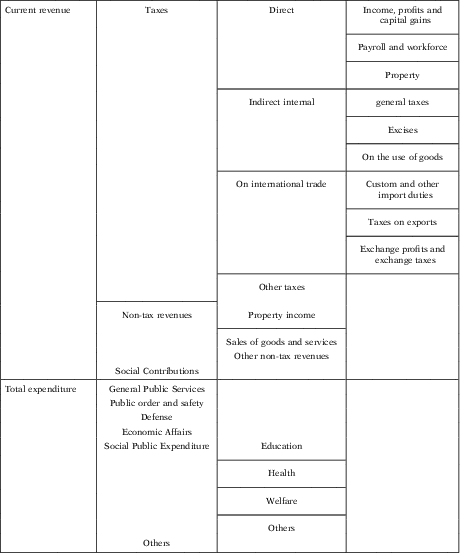
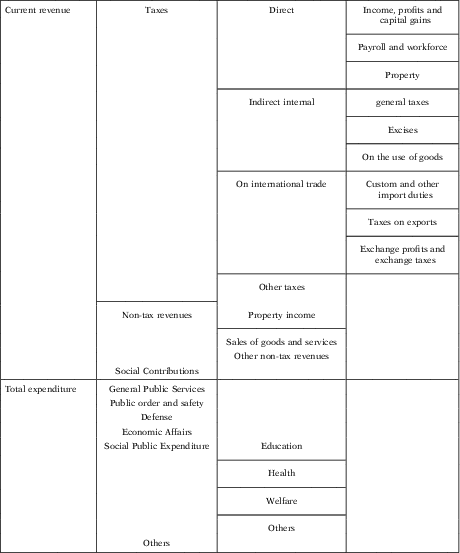
The distribution of revenue and expenditure among different categories has followed the most widely accepted international definitions (IMF 2001). The database is organised according to an adapted version of the IMF functional classification (IMF 2001) which considers three general categories with several sub-categories in the case of revenues and six categories and three sub-categories in the case of expenditures (Table A3).
CURRENT REVENUE AND TOTAL EXPENDITURE CLASSIFICATION
The new database represents substantial progress in comparison with the previously available evidence in the Bolivian historiography. In the case of revenues, for instance, whereas Delgadillo (Reference Delgadillo2001) offers aggregate data for 1900-1960 and Gómez (Reference Gómez1978)for 1900-1970, my revenue estimation provides detailed data from 1882 to 2010Footnote 41. As shown in Figure A1, my figures are identical to those previous estimations from 1900 to 1937. After this year some differences emerge between the series, which are not surprising given the higher uncertainty of the public finance statistics available for that period. The highest differences are found between 1957 and 1963, and can be explained by the fact that Gómez's data include donations, a category which was particularly important during those years but has been deliberately removed from my estimation which focuses on current revenues. In fact, after 1964, once the relative importance of donations started to decrease, both estimations tend to converge again.
ALTERNATIVE ESTIMATES OF BOLIVIAN CENTRAL GOVERNMENT′S REVENUES, 1900-1970 (MILLIONS BS. 2000)
Sources: Delgadillo (Reference Delgadillo2001), Gómez (Reference Gómez1978) and my own figures.
Notes: The three series have been deflated using the price index presented in the main text.
Figures A2 and A3 compare my estimation with the equivalent figures reported by the widely utilised MOxLAD database. The similarity between both revenue series (Figure A2) is only broken during the late 1970s because of a decrease in MOxLAD series that is difficult to explainFootnote 42. In the case of expenditures (Figure A3), some level differences are occasionally identifiable from 1900 to 1985 which are also difficult to explain, but might be the result of differences in either the unit of observation or the primary sources used in the estimationFootnote 43. These differences disappear from 1985 onwards, when both series are based on the IMF statistics.
MOXLAD AND MY ESTIMATES OF BOLIVIAN CENTRAL GOVERNMENT'S REVENUES, 1882-2010 (TEN MILLIONS BS. 2000)
Sources: MOxLAD database: http://moxlad.fcs.edu.uy/, and my own figures.
Notes: Both series have been deflated using the price index presented in the main text.
MOXLAD AND MY ESTIMATES OF BOLIVIAN CENTRAL GOVERNMENT'S EXPENDITURES, 1900-2010 (TEN MILLIONS BS. 2000)
Source and note: See Figure 2.
In addition, my database provides disaggregated figures for different categories of both public revenues and expenditures. To date and to my knowledge, this is the first disaggregated estimation with such a long time span and, as discussed in the main text, it constitutes an essential instrument to obtain an adequate understanding of the role of the state in the Bolivian economy since the late 19th century.
References
Statistical Sources
IMF
Finanzas del Ministerio de Hacienda (1942)
Estadística Financiera (1959-1963)
Informe de Labores del Ministerio de Hacienda (1966-1967)
International Financial Statistics (1960-1972)
Government Finance Statistics (1973-2007)
REPÚBLICA DE BOLIVIA
Finanzas del Ministerio de Hacienda (1942)
Estadística Financiera (1959-1963)
Informe de Labores del Ministerio de Hacienda (1966-1967)
Boletín Estadístico No. 83 del Ministerio de Hacienda (1959)
Cuentas Generales de la República de Bolivia (1900-1918)
Memorias del Ministerio de Hacienda (1872-1917)
Memorias de la Comisión Fiscal Permanente (1924-1929)
Memorias del Banco Central de Bolivia (1929-2007)
REPÚBLICA DE BOLIVIA. OFICINA NACIONAL DE INMIGRACIÓN, ESTADÍSTICA Y PROPAGANDA GEOGRÁFICA (1904) Censo General de la Población de la República de Bolivia de 1900. Taller Tipo-Litográfico José M. Gamarra: La Paz.
UN
Statistical yearbooks (1948-1970)
USAID
Estadísticas Económicas de Bolivia (1967-1972).
Websites
Economic Commission for Latin America and the Caribbean: http://www.eclac.cl/
Montevideo and Oxford Latin America Database: http://moxlad.fcs.edu.uy/
Unidad de Análisis de Políticas Ecómicas: http://www.udape.gob.bo
Publications
Delgadillo, H. (2001): «Apéndice Estadístico», in H. Huber Abendroth; N. Pacheco; C. Villegas; Á. Aguirre, and H. Delgadillo, La deuda externa de Bolivia--125 años de renegociaciones y cuantos más? : desde la operación secreta del gobierno y los Meiggs hasta la iniciativa HIPC. La Paz: CEDLA/OXFAM, pp. 401-539.
Gamarra, M. P. (2007): Amazonía Norte de Bolivia, economía gomera (1870-1940). Bases económicas de un poder regional. La casa Suárez. La Paz: CIMA.
Gómez, W. (1978): La minería en el desarrollo económico de Bolivia, 1900-1970. La Paz: Editorial Los Amigos del Libro.
Mitchell, B.R. (2003). International historical statistics: the Americas, 1750-2000. Palgrave Macmillan: Houndmills.
MC Queen, C. (1925): Bolivian public finance. Washington: Department of State.
Otálora, C. R. (1995): «La Política Fiscal Boliviana entre 1975 y 1989», in J. A. Morales and G. La Torre (eds), Inflación, estabilización y crecimiento. La experiencia boliviana de 1982 a 1993. La Paz: IISEC/UCB, pp. 83-141.
Palenque, J. (1933): «Análisis numérico del presupuesto nacional», in Estadística Boliviana. Primera Parte. Años 1911-1931. La Paz.
Udape (1985): Diagnóstico de Situación del Sistema Tributario en Bolivia. UDAPE: La Paz
Udape (1986): Las estadísticas fiscales de Bolivia, período 1970-1985. La Paz: UDAPE.
Wilkie, J. W. (1969): The Bolivian revolution and U.S. aid since 1952; financial background and context of political decisions. Los Angeles: Latin American Center, University of California.