Introduction
The RADARSAT geophysical processor system (RGPS) produces observations of sea-ice motion, ice deformation and estimates of ice thickness from sequential synthetic aperture radar (SAR) imagery of the Arctic Ocean. The goal of the RGPS program is to provide high-resolution systematic observations of the Arctic Ocean sea-ice cover to help improve our current understanding of the effect of sea ice on climate. At the time of writing, two winters of Arctic Ocean data (1996/97, 1997/98) have been processed. The results from the RGPS products of the first winter have been summarized in Kwok and Cunningham (in press). In this paper, we compare the remote-sensing observations from the two winters in terms of ice-cover advection, ice area and volume production and multi-year (MY) ice coverage. The second winter is of particular interest since it coincides with the year-long Surface Heat Budget of the Arctic Ocean (SHEBA) field experiment, one component of a program whose goals are to understand the ice–albedo feedback and cloud radiation feedback mechanisms and to use that understanding to improve the treatment of sea ice in large-scale models. The RGPS dataset provides a large-scale context, in terms of ice kinematics and deformation, for interpreting the small-scale observations from the SHEBA camp.
Data Description
The RGPS dataset provides measurements of ice motion and deformation, and estimates of ice age and thickness distributions produced from repeat surveys of Lagrangian elements or cells of sea ice in sequential SAR imagery. Each initial cell dimension is 10 km on a side, and the sampling interval between observations is nominally 3 days, but is dependent on data-acquisition opportunities. Two sets of RGPS cell observations are used here: ice deformation and ice-thickness histogram. The ice-deformation product contains the geographic location, the area and the velocity gradients of each cell at every time-step. The record of the derived thickness histograms and MYice-coverage estimates at these cells are stored in the ice-thickness histogram product. These RGPS products are available at the following website: http://www-radar.jpl.nasa.gov/rgps/radarsat.html.
The RGPS estimates the thickness distribution of sea ice using the openings and closings of the ice cover since the initial observation. The thickness distribution within an RGPS cell, prior to the first observation, is not known. New ice is assumed to grow in openings, and sea ice is ridged or rafted when the ice cover converges. Thus, only the ice volume and thickness of the seasonal ice cover are estimated. During closing events, when the known ice volume in the seasonal thickness distribution, gs(h), has been exhausted in the ridging/rafting process, the sea ice in the remainder of a cell is ridged. To account for the coverage of ridged areas of unknown thickness, a separate category called area of FYridges (FYr) is maintained in the RGPS record. This allows us to keep track of the coverage of FY ridges over a cell, even though the volume stored in this FYr category is not known. The area changes of the ice cover represent the best available estimates of ice-cover divergence. For large regions (100 km by 100 km), the estimated error is only small fractions of a per cent. At the outset, we are aware that there are sources of uncertainty in the ice-volume and ice-thickness calculations that remain unquantified, but at this time there are no adequate in situ or remote-sensing data for a comprehensive evaluation of the volume and thickness estimates. Severalinvestigators (R. Lindsay and others, http://psc.washington.edu/)are moving towards a comparison of the estimated ice thickness with Advanced Very High Resolution Radiometer (AVHRR) retrievals and submarine ice-draft measurements. Details of the RGPS analysis procedures, data products and discussions of the uncertainties can be found in Kwok and Cunningham (in press).
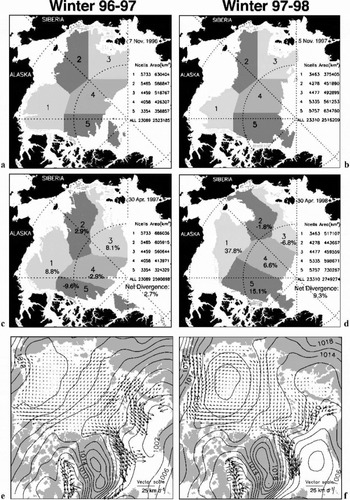
In the following analyses, we divide a large initial region of the Arctic Ocean covered by RGPS cells into five subregions (Fig. 1) to examine the large-scale variability and relative contribution of each subregion to the area change, seasonal ice-volume production and MY ice coverage. Henceforth, we designate subregion i as Si. In terms of ice dynamics, the five subregions sample the different parts of the Beaufort Gyre. The sea-ice cover of the Beaufort, Chukchi and East Siberian Seas in S1, S2 and S3 has higher areal fractions of MY ice in the north than in the south, and is located in the southern arm of the anticyclonic circulation pattern. The central Arctic and Canada Basin ice covers (S4 and S5) generally have high areal fractions of MY ice. In particular, S5 is generally a convergent region where the sea ice is pushed up against the Canadian Arctic Archipelago.
The spatial coverage of the five subregions (S1–S5). (a) 7November 1996; (b) 21April1997; (c) 5November 1997; (d) 30 April 1998. The areas of the subregions and the number of cells in each subregion are also shown. Also shown are the mean December–March ice motion for (e) winter 1996/97 and (f) winter 1997/98. Contour intervals are 2 hPa.

The area of FYridges (FYr) is shown as a separate category.
Ice-Cover Deformation And Area Production
Here, we compare the seasonal development of the area of the ice cover in the region sampled by the RGPS cells during the two years. The regional area at each time-step is the sum of the area of all cells covering that region. Only cells that are observed throughout the period are included in the calculations, so that the area changes are meaningful. The coverage of the five subregions at the beginning of November and the end of April is shown in Figure 1. Initially, the region is delineated by the approximate location of the ice edge in the south and available radar coverage in the north. In the discussions that follow, we will also refer to the mean winter (December– March) ice motion of the two years, also shown in Figure 1.
On 7 November 1996 there are 23089 cells covering an area of 2.526106 km2, or ~36% of the Arctic Ocean. At the end of the period (30 April 1997), the same cells cover an area of 2.596106 km2, a net divergence of ~2.7%. Over the 6 month period, S1 and S2 advected west towards the Siberian coast as part of the Beaufort Gyre. The southern boundary of S3 next to the New Siberian Islands has pulled away from the coast and moved north toward the Pole. S4 remained relatively undeformed, but rotated clockwise with the Beaufort Gyre. Its western boundary moved toward the Pole as part of the Transpolar Drift Stream. A noticeable zonal compression of S5 as a result of the convergence of the ice cover on the Canadian Arctic Archipelago is evident. Part of S5 has broken off and advected eastward. Some of the cells fromS5 have actually exited the Arctic Ocean through the Fram Strait. Overall, there are net increases in area in S1 (9%), S2 (3%) and S3 (8%) and net decreases in area in S4 (–3%) and S5 (–10%).
During the second winter, the initial area of the domain, ~2.516106 km2, is approximately the same as in the previous year. The Beaufort and Chukchi ice edge is further north. Thus, the number of RGPS cells covering S1 and S2 is smaller than in the previous winter. The area change, deformation and motion of the ice cover, as illustrated in Figure 1, are quite different during the SHEBA winter. The strong westward motion of the southern arm of the Beaufort Gyre has pushed S1, where the SHEBA ice camp was located, far towards Wrangel Island. The net divergence (~38%) of that subregion is more than four times that of 1996/97. A coherent clockwise rotation of S3, S4 and S5, due to the strength and location of the Beaufort high-pressure cell, is evident when compared to the earlier year. In 1996/97, S3, S4 and S5 advected toward the Canada Basin due to the prevailing east–west ice motion as shown in the motion field. Remarkably, S4 and S5, which one typically expects to be convergent, have net divergences of 6.6% and 15%. The reverse is true for S2 and S3, where net convergences of –1.8% and –6.7% were observed at the end of the 6 months. As a result of the significant divergence in S1, the entire domain at the end of April 1998 covers ~2.75×10⁶ km2, a net divergence of 49%. Comparing the two years, the area changes of all subregions except forS1 have opposite polarities.
Sea-Ice Volume Production
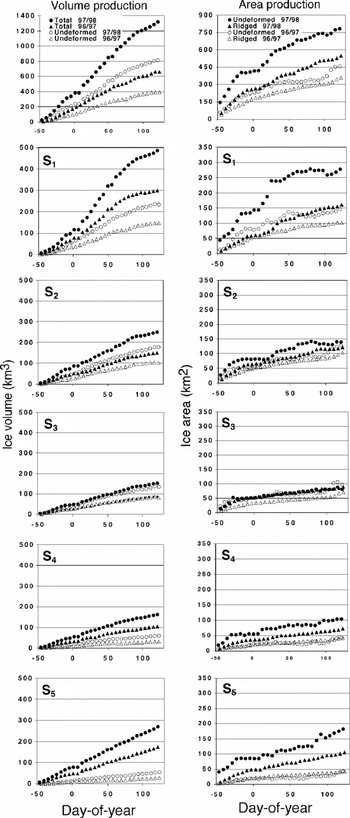
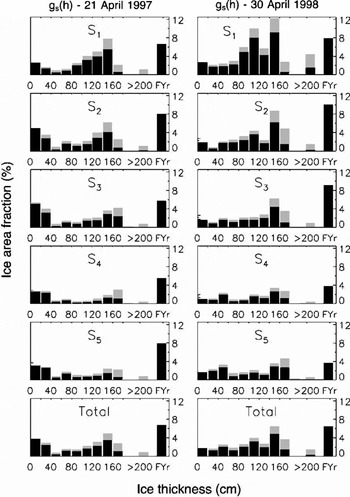
The seasonal ice-thickness distributions, gs(h), are estimated from cell area changes using an ice-growth model and an assumed mechanical redistribution function of sea. The ice-growth rate is approximated as a function of the number of freezing degree-days experienced by each age category using Lebedev’s parameterization (Reference Maykut and UntersteinerMaykut, 1986), h = 1.33F0.58, where h is ice thickness (cm) and F is the accumulated freezing degree-days (K) derived from the International Arctic Buoy Program/Polar Exchange at the Sea Surface (IABP/POLES) 2 m air temperature (Reference Rigor, Colony and MartinRigor and others, 2000). The thickness redistributor uses a combination of rafting and pressure ridging to account for decreases in cell area. Ice 540 cm thick is rafted instead of ridged. Rafted ice is twice its original thickness and occupies half the area, while ridged ice is five times its original thickness (Reference Parmerter and CoonParmerter and Coon, 1972) and occupies a quarter of the area. In the RGPS products, the seasonal thickness distributions of undeformed and ridged/rafted ice are tracked separately. The area covered by undeformed ice and ridged/rafted ice and the seasonal volume production of these two categories in each of the subregions are shown in Figure 2. The seasonal thickness distributions at the end of April are shown in Figure 3. Table 1 compares the volume production over the two years.
Seasonal ice-volume and area production in the entire domain and the five subregions. The coverage and volume of the FYr ice are not shown here.

The seasonal ice-thickness distribution, gs(h), at the end of April. The coverage of ridged/rafted ice is shown in light gray.

Comparion of seasonal sea-ice volume production (km3), 1996/97 and 1997/98 (November–April)

Inwinter1996/97, S1 and S2 have larger fractions of sea ice in the 0–20cm range compared to S4 and S5. At the end of April, the undeformed ice in S1 covers ~21% of the area, while S4, a region of net convergence over the 6 month period, has the smallest value, 10%. Undeformed ice occupies ~18% of the total area. The average thickness of undeformed ice over the region is ~0.85m, with the average thickness highest in S1 (1.09 m) and lowest in S5 (0.63m). The undeformed ice in S5 is thinner because thinner ice categories created by recent openings lowered the average. At the end of April, the total seasonal ice volume stored in the undeformed ice of S1–S5 is ~390 km3. Ridged/rafted (deformed) ice covers ~10% of the area at the end of April. Fifty per cent of that area is covered by FYr and is a direct result of ridging ice area of unknown volume and thickness. As mentioned earlier, this is a consequence of not knowing the initial thickness distribution of each cell. S1 has the largest fractional coverage of ridged ice, while S4 has the smallest. The average thickness of deformed ice in the region is 1.53 m, with a total volume of ~270 km3. Not surprisingly, the thickest ridged ice is found in S5, off the Canadian Arctic Archipelago. At the end of the season, the total volume of undeformed and deformed ice is 660 km3.To obtain an estimate of the total ice volume stored in undeformed ice, deformed ice and FYr, we assume that the average thickness of the FYr is the same as that of deformed ice. With that assumption, approximately 923 km3 (or 0.38 m, relative to the area of the domain at the end of April) of seasonal ice, accounted for by our estimates, is produced over the entire area over the 6 months. The highest volume production found in the Beaufort region (S1) is three times that of the central Arctic Ocean (S4) (Fig. 2; Table1).
The sea-ice area and volume production during the SHEBA year is dramatically higher than in the previous year (Fig.2), and this is true in all subregions except S3. The largest volume production can be seen in S1 where 591 km3 (undeformed, deformed and FYr) of ice is produced over the 6 months. Here, the volume of stored undeformed and deformed ice, respectively, is 301 and 186 km3, covering ~53% and ~31% of the area. The equivalent thickness of undeformed ice in S1 at 1.08m is, however, comparable to that of the previous year (1.09m). Even though S1 has the highest ice production, the largest change in ice production can be seen in S5, from 97 km3 to 326 km3, a more than three-fold increase. The overall volume production, 1705 km3 (equivalent to 0.62 m when divided by the final area of the domain), is 1.8 times that of the previous year. In terms of ice thickness, the quantity is slightly smaller at 1.6 because the final areas of the domain at the end of the season are different.
We attribute the much higher ice-volume production during the SHEBA year to the higher net divergence (9%) in 1997/98, with the largest contribution from area increases in S1 (38%) and S5 (15%). The seasonal thickness distributions for the two years accounted for by the RGPS procedures are shown in Figure 3. Ice-volume production reflects the character of the ice motion and deformation in the region. Thermodynamic growth is highest in openings and undeformed ice areas. Ridging only serves to redistribute ice into thicker categories, resulting in slower growth rates. Thus, the divergences in S1 and S5 contribute to the abundance of undeformed ice and the resulting volume production.
Over the entire region and during the two years, the coverage by thin ice (0–20cm) is typically 52–3%, but the average is slightly higher during the second year. This is the most crucial thickness range that produces the most ice growth, the most turbulent heat flux to the atmosphere and the most salt flux to the ocean.
My Ice Coverage
Here, we discuss the MY ice-coverage estimates obtained from SAR backscatter within the RGPS cells. A simple backscatter-based procedure (Reference Kwok, Rignot, Holt and OnstottKwok and others, 1992) is used to classify a SAR image pixel as covered by one of two types of sea ice: MYor first-year. If ice that survives the summer is correctly classified as MY ice, then the MY ice coverage during the winter should be nearly equivalent to the ice concentration of the previous summers minima, differing by an amount due to melt, ridging and export of ice from the Arctic. As we consider the MYcoverage in Lagrangian elements in the winter, ice export and melt are not issues in the winter MYice area balance within RGPS cells. Since no MY ice is created during the winter, we expect that the MY ice coverage within a Lagrangian region will remain constant and can only decrease due to ridging. This condition is a good test of whether the RGPS interpretation of the radiometry is sound. Certainly, the presence of wind-blown open water and frost flowers on thin ice has been shown to cause the ice classifier to overestimate the area of MY ice even though the winter signature of MY ice has been shown to be stable (Reference Kwok and CunninghamKwok and Cunningham, 1994). These misclassification events can be identified as positive spikes or humps, i.e. noise in the retrieval process. A 6 month record of MY ice retrieval would allow us to filter out the noise to obtain the background or true MY ice area. Here, it is important to note that MY coverage is discussed in areas rather than concentrations or fractions, as the fractions/concentrations vary with divergence or convergence even though the total MY area remains constant.
The trend in the MYcoverage for the two years is shown in Figure 4. Over the period 1996/97, MY sea ice covers ~2.086106 km2 or 83% of the initial area of the entire region. S1 has the largest variability in MY ice area (~126103 km2) and the lowest concentration (69% relative to initial area) of MY ice. All subregions exhibit negative trends in MY area. The largest decrease can be seen in S5 (7%), the region of largest net convergence. The total decrease in MY coverage over the 6 months is ~836103 km2, or ~4% of the total AMY.We attribute this decrease in AMY to three factors: (1) the ridging of MY ice; (2) the piling of first-year ice onto MY ice during the ridging process; and (3) an actual trend in the MY ice signature due to changes in surface conditions (e.g. formation of hoar frost, thickness of snow cover, etc.). The ridging of MY ice is not unlikely at the end of the fall, especially when the first-year ice that survived the summer, classified now as MY ice,may not be that thick. But the expectation that only a small fraction of this ice participates in ridging should be valid. First-year ice definitely piles up onto MYice during the ridging process, so this is not unexpected. However, there are no observational data that would allow us to quantify this effect. A more detailed discussion of this can be found in Kwok and Cunningham(in press).
The record of the multi-year (AMY) coverage for the winters of 1996/97 (solid line) and 1997/98 (dashed line).

Over the period 1997/98, MY sea ice covers ~2.08 ×10⁶ km2, or 83% of the initial area of the entire region, almost identical to that of the previous year. The differences in the MY ice coverage of the five subregions relative to their initial areas are within 2% of each other, except for S5 where the fraction was lower during winter 1996/97 by ~6%. Similar to winter 1996/97, there is a decrease in the MY coverage of ~1156103 km2, or ~5.6% of the total AMY, slightly higher than the previous year. We attribute this decrease to the factors discussed above.
Summary
In this paper we present a first comparison of the RGPS dataset from two winters (November–April), 1996/97 and 1997/98. The changes in the ice-cover area, volume production and the multi-year ice coverage over the 6 month period are examined. These measurements and estimates are obtained directly from ice motion and the backscatter fields derived from RADARSAT data (Kwok and Cunningham, in press). The seasonal ice-thickness distributions are derived from the record of cell divergence using prescribed models of ice growth and mechanical redistribution.
The contrast in the ice area and volume production is quite remarkable. Between the two years, the net divergence of the ice cover and the net volume production of the second year are much higher. The net divergence is 3 times (2.7% vs 9.3%), and the net seasonal ice-volume production is 1.6 times (0.38m vs 0.62 m), that of the first year. Examining the subregions,we find the largest contributions to these increases from S1 and S5, with net divergences of 38% and 15%, initially occupying the Beaufort Sea and an area west of the Canadian Arctic Archipelago. We attribute the increased ice production to the large net divergence, as thermodynamic ice growth is highest in openings and in areas with undeformed and thus thinner seasonal ice. Ridging only serves to redistribute ice into thicker categories, resulting in slower growth rates.
Available mass-balance observations that are taken along a transect of varying ice thickness (Reference KoernerKoerner, 1973) give an annual growth of ~ 1.1m. This annual mean is approximately double that of the growth estimates for 3 m ice, of ~0.5m (Reference UntersteinerUntersteiner, 1961). Our growth estimates for seasonal ice should be comparable to that of the difference between the two estimates above (i.e. 1.1m– 0.5 m=0.6 m). Indeed, scaling our 1996/97 and 1997/98 estimates of ~0.38m and ~0.62m from 6 to 8 months gives annual growths of ~0.5m and ~0.8m, comparable to the above difference. Admittedly, this is a rather crude comparison but it does serve as a check of our ice-growth estimates.
The final locations of these subregions reflect the mean atmospheric-pressure pattern and ice-motion field of the Arctic Ocean over the winter. During the SHEBA year, the Beaufort high-pressure cell is centered north of the Chukchi Sea, resulting in strong zonal winds and westward ice motion north of the Alaska coast. S1, where the SHEBA ice camp was located, advected far west toward Wrangel Island. The weaker high-pressure cell centered farther south during the first year resulted in a much weaker ice-motion pattern in the southern arm of the Beaufort Gyre.
The retrieved MY ice coverage for both years is consistent in that it remains near constant throughout the season, except for the small negative trends observed in both years. The possible causes of these trends are discussed. The total coverage also remained almost identical at ~2.086106 km2, or 83% of the initial area of the entire region. This is an encouraging result, as we do not expect large fluctuations in MY ice coverage over 2 years, and gives us confidence that the RGPS interpretation of the radiometry is sound.
Acknowledgements
This work was performed at the Jet Propulsion Laboratory, California Institute of Technology, under contract with the National Aeronautics and Space Administration. I wish to thank G. F. Cunningham for his software support during the preparation of this paper. The RGPS is a joint project of the Alaska SAR Facility and theJet Propulsion Laboratory.