INTRODUCTION
Winter wheat and soybean are cultivated extensively in China. In 2010, c. 3·56 and 0·16 million hectares of wheat and soybean were grown in Shandong Province, with a mean grain yield of 5780 and 2459 kg/ha, respectively. The Huanghuaihai Plain, an alluvial flood plain located in a sub-humid continental monsoon zone in Northern China, is one of the most important winter wheat and summer soybean production areas with an annual accumulated temperature (⩾0 °C) of 4800 °C, an annual average rainfall of 600 mm, a cumulative annual solar radiation of over 5200 MJ/m2 and a frost-free period of >200 days. The average precipitation in Taian, China, is 697 mm/year (1971–2008), and the greatest monthly precipitation (182 mm) and temperature (25·7 °C) occur during the hot summer months of July and August.
During the growing season, the water requirements of winter wheat (c. 400–500 mm) exceed the average rainfall received, therefore requiring supplemental irrigation; in contrast, summer soybean is generally grown without irrigation. Spacing between rows (row spacing) influences the plant population's structure and yield (Eberbach & Pala Reference Eberbach and Pala2005; Zhou & Chen Reference Zhou and Chen2011), whereby inter-plant competition can occur when the supply of a single essential factor for growth falls below the aggregate demands of all the plants (Avola et al. Reference Avola, Tuttobene, Gresta and Abbate2008; Abadouz et al. Reference Abadouz, Hasanzadeh Gorttapeh, Rahnema and Behradfar2010). If sown sufficiently close to one another, a plant can influence its neighbour and modify its soil or atmospheric environment, thereby decreasing the growth rate (De Bruin & Pedersen Reference De Bruin and Pedersen2008; Zhou et al. Reference Zhou, Chen and Ouyang2011a ). The main competition factors for plants include light, water and nutrients (Brant et al. Reference Brant, Neckář, Pivec, Duchoslav, Holec, Fuksa and Venclová2009); therefore, the row spacing of plants influences their yield (Herbert & Baggerman Reference Herbert and Baggerman1983; Farnham Reference Farnham2001; Asokan et al. Reference Asokan, Murthi and Mahadevaswamy2005; Kazemeini et al. Reference Kazemeini, Edalat and Shekoofa2009; Cox & Cherney Reference Cox and Cherney2011; Stevovic et al. Reference Stevovic, Stanisavljevic, Djukic and Djurovic2012). In addition, a lower yield is associated with increasing soil water deficits (Mishra et al. Reference Mishra, Rathore and Tomar1999).
Improving water-use efficiency (WUE) to optimize the benefits of irrigation is of paramount importance to farmers (Mishra et al. Reference Mishra, Rathore and Tomar1995; Ritchie & Basso Reference Ritchie and Basso2008), as irrigation water is becoming an increasingly scarce resource in many areas of Northern China (Jiang Reference Jiang2009). Consequently, appropriate irrigation scheduling and planting patterns are necessary to optimize the yield and maximize net return; furthermore, management practices to maintain yield while minimizing external input requirements are necessary to ensure economic and environmental sustainability (Hill et al. Reference Hill, Nelson, Tilman, Polasky and Tiffany2006). Wheat–legume rotation systems with additional nitrogen input during the wheat growth phase not only maintain sustainable production systems but are also more efficient at utilizing limited rainfall than continuous wheat systems (Pala et al. Reference Pala, Ryan, Zhang, Singh and Harris2007). The appropriate application of water (i.e. rainfed and irrigated conditions) and row spacing has a large influence on the yield and optimal wheat and soybean plant populations (Zhou et al. Reference Zhou, Chen and Ouyang2011a ).
Previous investigations of WUE have primarily dealt with crops grown under limited water conditions and have not considered the relationship between crop row spacing and WUE (Lehrsch et al. Reference Lehrsch, Whisler and Buehring1994; Bowers et al. Reference Bowers, Rabb, Ashlock and Santin2000), with the crop yield obtained merely reflecting the amount of stored soil water, rainfall, irrigation water and plant population distribution patterns. Indeed, agricultural practices should be developed for different ecological regions, considering that plant water consumption during reproductive periods depends mostly on plant growth in addition to soil and climatic conditions. Therefore, an optimal row spacing and plant density have been implemented under various water regimes (Bhullar et al. Reference Bhullar, Saini, Kapur and Singh2002; Lambert & Lowenberg-DeBoer Reference Lambert and Lowenberg-DeBoer2003; Uçan et al. Reference Uçan, Killi, Gençoğlan and Merdun2007; Zhang et al. Reference Zhang, Chen, Sun, Pei and Wang2008; Fang et al. Reference Fang, Turner, Yan, Li and Siddique2010; Tarkalson et al. Reference Tarkalson, King, Bjorneberg and Taberna2011). The objective of the present study was to determine the effect of row spacing on the WUE of winter wheat and summer soybean under rainfed and irrigated conditions. An evaluation of the combined responses of winter wheat and soybean to water and row spacing could help identify the optimal allocation of available resources among crops in this cropping system to maximize net returns. The present study aims to: (i) evaluate the effect of row spacing and its interaction with the water supply for wheat and soybean cropped in a warm, temperate continental monsoon climate and (ii) identify the optimum row spacing for a soybean–wheat rotation system in annual double cropping in Northern China.
MATERIALS AND METHODS
Site description
This research was conducted at the Agronomy Experimental Station of Shandong Agricultural University, Taian (36°09′N, 117°09′E, 134 m asl) in Northern China. The site is representative of the Huanghuaihai Plain, the main winter wheat growing region in North China. At this station, the long-term (1971–2008) average rainfall and temperature are 697 mm and 12·8 °C, respectively, with c. 200 mm of total rainfall during the winter wheat growing season (October–June). The 4 ha study area is mapped as silt loam (pH 6·9) and has slopes of 0°–3° (USDA 1979). At the experimental site, the average nutrients at a depth of 0–20 cm were tested from 2006 to 2008 before the winter wheat planting, with a soil organic matter content of 16·3 g/kg and total, P and K concentrations of 1·3 g/kg, 35 mg/kg and 95 mg/kg, respectively.
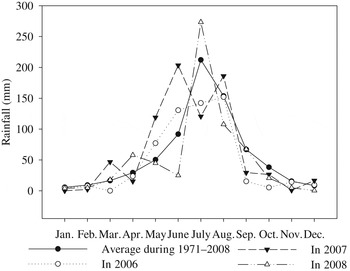
Weather data were collected from the Taian Agrometeorological Experimental Station located 500 m from the experimental site. The data for the long-term monthly rainfall from January to December (1971–2008) are shown in Fig. 1. During the winter wheat growing season, the total rainfall values in 2006/07 and 2007/08 were 213 and 170 mm, respectively; during the summer soybean growing season, the total rainfall values in 2006, 2007 and 2008 were 439, 539 and 448 mm, respectively.
Average monthly rainfall during 1971–2008 and monthly rainfall from 2006 to 2008.

Experimental design
The experiments were conducted during the respective crop growing seasons from June 2006 to September 2008. As part of a continuous winter wheat–summer soybean rotation experiment, the previous crop plants (soybean or winter wheat) were hand-harvested and their residues were removed. The experimental design was a randomized complete block for both winter wheat and soybean with three replications. The field plots were superimposed on the same position each year. Each plot was 3×3 m in size. It was a split-plot arrangement of treatments for winter wheat. Water conditions were allocated as main plots and spacing between rows were split-plots. Winter wheat (cvar Shannong 919) was hand-planted at 408 seeds/m2 on 6 October 2006 and 10 October 2007, and the seedlings were thinned by hand 5 days after emergence to obtain uniform final plant population densities (204 plant/m2). The experiment consisted of four plant population distribution patterns under rainfed and irrigated conditions. The row spacing×spacing between plants schemes used were 7×7 cm (row spacing 7, a uniform grid pattern), 14×3·5 cm (row spacing 14), 24·5×2 cm (row spacing 24·5) and 49×1 cm (row spacing 49). Summer soybean seeds (cvar Ludou 4) were hand-sown and were superimposed on the same plot location after the irrigated wheat was harvested, at a seeding rate of 62 seeds/m2 on 12 June 2006, 13 June 2007 and 18 June 2008. All the plots were thinned to 31 plant/m2 5 days after soybean emergence to obtain uniform final plant population densities. The experiment consisted of five plant population distribution patterns under rainfed conditions. The row spacing × spacing between plants schemes used were 18×18 cm (row spacing 18, a uniform grid pattern), 27×12 cm (row spacing 27), 36×9 cm (row spacing 36), 45×7·2 cm (row spacing 45) and 54×6 cm (row spacing 54). The seeding of winter wheat and soybean was at 2–3 cm and 3–4 cm soil depths, respectively. The plots were managed using a no-till production system. Dicot weeds in the winter wheat plots were controlled chemically by applying the herbicide 0·84 kg/ha 2-methyl-4-clorophenoxyacetic acid (MCPA); other winter wheat and weeds of soybean weeds were removed by hand.
To prevent the lateral flow of soil water, concrete slabs were inserted at 200 cm deep at a width of 15 cm on all sides of each plot, and plastic film (0·1 mm thick) was placed along the concrete wall. For the irrigated winter wheat plants, 60 mm of water was applied at Zadoks growth stages (GSs) 35 (stem elongation stage), GS49 (booting stage) and GS71 (milk development stage) on 31 March, 25 April, 14 May 2007, on 2 April, 2 May and 18 May 2008, respectively (Zadoks et al. Reference Zadoks, Chang and Konzak1974). Water was conveyed from the outlet of a pump to the plots using plastic pipes, and a flow meter was used to measure the amount of water applied. The winter wheat plants were harvested on 5 June 2007 and 13 June 2008 and summer soybean on 25 September 2006, 25 September 2007 and 24 September 2008. The number of stems in the winter wheat was determined using a 1 m2 quadrat per plot at the GS29, GS35, GS47 and GS57. The crop yield was measured with two 1 m2 quadrats per plot.
Soil moisture measurements
Aluminium access tubes (45 mm internal diameter) for use with a neutron moisture meter were installed 1·3 m deep between the rows near the centre of each plot prior to sowing (one tube per plot). The soil moisture content (SMC) was monitored every 7–10 days throughout the crop growing seasons at 10 cm intervals from 20 to 120 cm below the soil surface using a local field-calibrated CNC503B Neutron Moisture Probe (Super Energy Nuclear Technology, Ltd., Beijing, China). The moisture content of the top 20 cm of the soil profile was determined using a CS620 portable time-domain reflectometry system (Campbell Scientific Australia Pty. Ltd., Townsville, Australia).
Computation and statistical analyses
The evapotranspiration (ETa) in each treatment was computed using climate data obtained from the Taian Agrometeorological Experimental Station with the following equations:
 $$ETa = {\rm \Delta} W + I + R-SI-Q$$
where ETa is the total amount of seasonal evapotranspiration (mm), ΔW is the change in the stored soil water (mm, Kang et al. Reference Kang, Wang, Liu and Yuan2004), I is the amount of irrigation water (mm), R is the amount of rainfall (mm), SI is the depth of deep percolation (mm), and Q is the amount of surface run-off (mm). SI was estimated using the approach proposed by Gong & Li (Reference Gong and Li1995). Based on the observations for the winter wheat growing seasons, the surface run-off was negligible.
 $$SI = W_i -FK$$
where W i is the water stored in the i soil layer (mm) and FK is the field capacity (mm).
 $$WUE = Y/ETa$$
where Y is the grain yield (kg/ha) of the crops.
 $$NR = TI-TC$$
where NR is the net return, TI is the total income (the value of the harvested winter wheat and soybean) and TC is the total costs (including the costs of all inputs, such as winter wheat and soybean seed, fertilizer, pesticide and labour).
 $$AEWUE = (Yw \times EVw + Ys \times EVs)/(Etaw + Etas)$$
where AEWUE is the annual energy-water use efficiency; Yw and Ys, EVw and EVs, and Etaw and Etas are the yield, energy value (EV) and Eta of winter wheat and soybean, respectively, and EVw and EVs are 15 730 and 20 670 kJ/kg, respectively.
In the combined analyses, each site–year was considered as a fixed effect, where they were considered to be unique based solely on the same site. Water conditions and spacing between rows also were considered fixed effects. Replications were considered random effects. All the data were analysed using the FIXED model for the analysis of variance (ANOVA) (Everitt & Hothorn Reference Everitt and Hothorn2006). The experimental data were analysed using ANOVA to determine whether significant differences existed among the means of the different treatments.
RESULTS
Winter wheat stem number
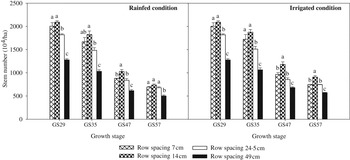
The changes in the wheat stem number due to row spacing and the time of year were similar between the rainfed and irrigated treatments (Fig. 2), with irrigation and row spacing demonstrating a great impact on individual plants during growth. The stem number at the GS29 and GS35 were greater than those in the GS47 and GS57. After irrigation, the SMC increased by 11–56% during GS35 and GS57 (data not shown); under these water conditions, crop growth was improved and the stem populations were larger than under the rainfed conditions from GS35 to GS57. The stem number at the different row spacings can be ranked as row spacing 14>row spacing 7>row spacing 24·5>row spacing 49; row spacing 7 and row spacing 14 resulted in higher stem numbers than the other row spacing treatments, whereas there were significantly fewer stems at row spacing 49 (P<0·05). The results show that the number of winter wheat stems at wide row spacings was the lowest in all the treatments. From the GS29 to GS57, the stem numbers at row spacing 7, row spacing 14, row spacing 24·5, and row spacing 49 rapidly decreased to 65, 65, 63 and 61% under the rainfed conditions, respectively, with no significant differences observed. Similarly, stem numbers at the same row spacing were reduced to 63, 57, 59 and 55% for the irrigated conditions, with row spacing 7 being significantly higher than the other treatments and row spacing 49 being significantly lower than row spacing 7 and row spacing 14 (P<0·05).
Stem number at different growth stages of winter wheat under rainfed and irrigated conditions. The values are averages of the 2006/07 and the 2007/08. The error bars are the s.e. Within a growth stage, the treatment means with the same lowercase letters are not significantly different according to P⩽0·05.

Changes in soil water storage and soil moisture content in winter wheat
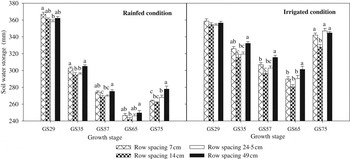
The changes in the winter wheat soil water storage (SWS) averages in 2006/07 and 2007/08 are given in Fig. 3. At the same row spacing treatment, the SWS of the irrigated condition was significantly higher than that of the rainfed condition (P<0·05). The average SWSs of the row spacing 7, row spacing 14, row spacing 24·5 and row spacing 49 treatments were 291, 286, 288 and 294 mm, respectively, for the rainfed conditions, and they were 325, 315, 323 and 330 mm, respectively, for the irrigated conditions. The row spacing 49 treatment showed the highest SWS (Fig. 3). The SWS at the GS35 was greater than that at other GSs, and the minimum was observed at the GS65. The SWS of the different treatments showed a descending trend with advancing GS.
Changes in soil water storage in a winter wheat field. The values are the average at a 0–120 cm soil depth in the 2006/07 and 2007/08 growing seasons. The error bars are the s.e. Within a growth stage, the treatment means with the same lowercase letters are not significantly different according to P⩽0·05.

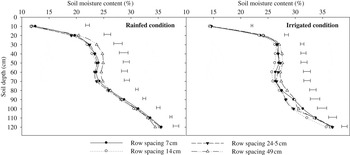
Irrigation had a significant effect on SMC: after irrigation, SMC was evidently enhanced, particularly at the 10–40 cm soil depth (P<0·05). The SMC increased by 18% for the entire winter wheat growing season. The curve shape for SMC resembles the letter Z for the different treatments for 2006/07 and 2007/08, and the inflection point of the curve can be observed at the 40 and 70 cm soil depths. The average SMCs for both the rainfed and irrigated conditions at the 0–120 cm soil depths, from seeding to maturity, can be ranked as row spacing 14<row spacing 24·5<row spacing 7≈row spacing 49. No significant differences were recorded between the treatments. The SMC of row spacing 14 was the lowest and that of row spacing 24·5 was mid-range. No evident difference was found in the SMC values between row spacing 7 and row spacing 49 (Fig. 4).
Changes in the soil moisture content in a winter wheat field. The values are the average of the 2006/07 and 2007/08 growing seasons. Error bars=s.d.

Changes in soil water storage and soil moisture content in soybean
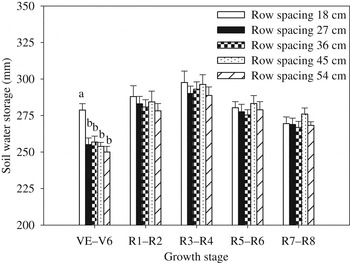
During the 2006–08 growing seasons, the ranking based on the SWS average values for the different treatments was row spacing 18>row spacing 45>row spacing 27>row spacing 36>row spacing 54, with the respective values being 283, 279, 275, 275 and 273 mm, respectively. Spacing between rows had no significant effect on SWS during growth except for vegetative stages VE–V6 (Ritchie et al. Reference Ritchie, Hanway, Thompson, Benson and Ames1994). Prior to reproductive stages R3–R4 (Ritchie et al. Reference Ritchie, Hanway, Thompson, Benson and Ames1994), the SWS value was the highest in the row spacing 18 treatment with the results of all other treatment being similar. The row spacing 18 treatment showed a 4% higher SWS than the averages for the other treatments. From R5–R6 to R7–R8, the SWS of the row spacing 45 treatment produced the highest SWS, and no evident differences were found among the other treatments. The maximum SWS of the different treatments appeared at R3–R4, which may be related to the increase in rainfall pre- and post-R3–R4 (Fig. 5).
Changes in the soil water storage in a soybean field. The values are the average at a 0–120 cm soil depth in the 2006–08 growing seasons. Error bars=s.d. Within a growth stage, the treatment means with the same lowercase letters are not significantly different according to P⩽0.05.

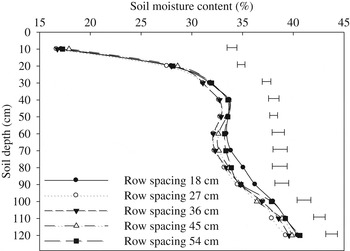
The shapes of the curves for SMC in the different treatments during the 2006–08 growing seasons are similar to that of wheat, and the inflection points of the curves appear at the 40 and 70 cm soil depths (Fig. 6). The SMC in the lower layers was greater than in the upper layers for each row spacing treatment. The SMC was significantly enhanced in the 20–40 cm and 70–120 cm soil depths (P<0·05). For the entire summer soybean growing season, the ranking based on the SMC average at 0–120 cm was row spacing 18>row spacing 54>row spacing 45>row spacing 27≈row spacing 36. Therefore, the plant population distribution patterns influenced the SMC differences between the treatments, but no significant differences were recorded.
Changes in soil moisture content in a soybean field. The values are the average of the 2006–08 growing seasons. Error bars=s.d.

Evapotranspiration, yield and water-use efficiency of winter wheat
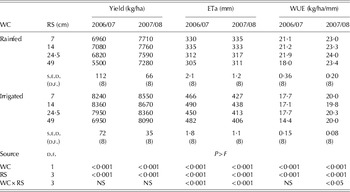
In 2006/07 and 2007/08, the yield and ETa of the winter wheat irrigated plots were higher than those of the rainfed plots, whereas the WUE values were lower. The linear equation of yield v. row spacing was as follows: y (yield, kg/ha)=−24·535×(row spacing, cm) +7666·7, R 2=0·3219 (P<0·05, rainfed) and y=−23·241× +8696·2, R 2=0·5368 (P<0·001, irrigated); the linear equation of ETa v. row spacing was as follows: y (Eta, mm)=−0·6378× (row spacing, cm) +337·21, R 2=0·7796 (P<0·001, rainfed). The trend analysis was not significant between ETa and row spacing (irrigated), WUE and row spacing (rainfed and irrigated). The yield and ETa for row spacing 14 were the highest among the treatments, being 16 and 8% (rainfed) and 13 and 5% (irrigated) higher than those of the row spacing 49 treatment, respectively. The yield resulting from row spacing 49 was significantly lower than those of the other treatments (P<0·05). These results show a consistent change in the individual plants during GS57. The average ETas for the two growing seasons of row spacing 7, row spacing 14, row spacing 24·5, and row spacing 49 were 332, 334, 314 and 308 mm (rainfed) and 446, 464, 432 and 444 mm (irrigated), respectively (Table 1). The WUE of row spacing 24·5 was higher than that in the other treatments. The ranking of treatments by WUE was row spacing 24·5>row spacing 7≈row spacing 14>row spacing 49 (rainfed) and row spacing 24·5≈row spacing 7>row spacing 14>row spacing 49 (irrigated), respectively. The total amount of rainfall for 2006/07 and 2007/08 was 213 and 170 mm, respectively, but the yields were reversed. From October to December 2007, the total amount of rainfall for July was 42 mm, which is 13 mm more than that of 2006, and this high amount of rainfall improved the tillering of the winter wheat. There was 119 mm of rainfall in May 2006, and this factor may have been responsible for the lack of relationship between yield and rainfall. Furthermore, the amount of rainfall and irrigation water did not affect the trend in yield changes of the different planting styles for winter wheat. In contrast, water conditions and row spacing had a significant effect on all traits, with the water conditions×row spacing interaction being significant only for Eta (P<0·001).
Effects of row spacing (RS) on the yield, evapotranspiration (ETa) and water-use efficiency (WUE) of winter wheat

WC, water condition.
Evapotranspiration, yield and water-use efficiency of soybean
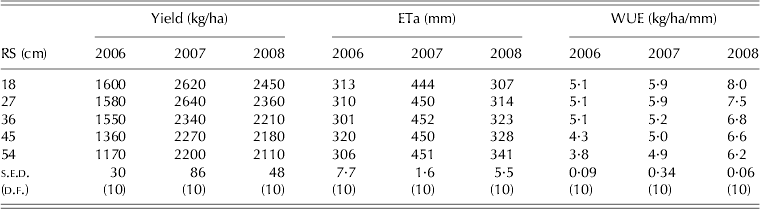
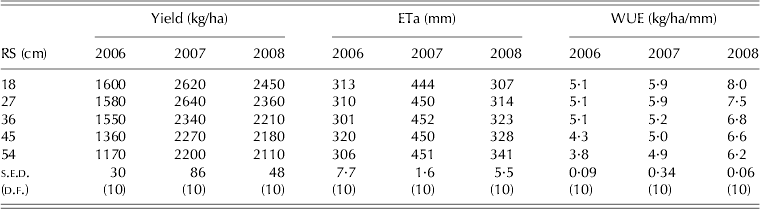
The row spacing showed observable effects on the soybean yield, Eta and WUE during the course of the present study (Table 2). Significant negative correlations were observed between the yield and row spacing over the 3 years and with the following linear equation: y=−11·682× +2461·1, R 2=0·9299 (P<0·001). The yields of the row spacing 18 and row spacing 27 treatments were significantly higher than those of the row spacing 45 and row spacing 54 treatments (P<0·05), whereas no significant differences were observed among the row spacing 36, row spacing 45 and row spacing 54 treatments in 2007 and 2008. The yields of the row spacing 18 and row spacing 27 treatments were 37 and 35% (in 2006), 19 and 22% (in 2007), and 16 and 12% (in 2008), respectively, higher than those of the row spacing 54 treatment. Negligible (and in most cases, not significant) differences in ETa were observed between the treatments in 2006 and 2007, with larger differences observed in 2008. Significantly negative correlations were observed between WUE and row spacing with the following linear equation: y=−0·0404× +7·1532, R 2=0·9334 (P<0·001). The WUE of the row spacing 18 and row spacing 27 treatments was significantly higher than that in the row spacing 45 and row spacing 54 treatments, respectively (P<0·05). The yield for the three years can be ranked as 2007>2008>2006, with rainfall amounts of 539, 448 and 440 mm, respectively. In 2008, the total amount of rainfall for July was 273 mm, which was crucial to the growth and yield of the soybean plants. Thus, the WUE value for 2008 was greater than that of 2006 and 2007. The rainfall did not lead to a trend in yield changes for the different planting treatments.
Effects of row spacing (RS) on the yield, evapotranspiration (ETa) and water-use efficiency (WUE) of soybean
Annual energy-water use efficiency and net return
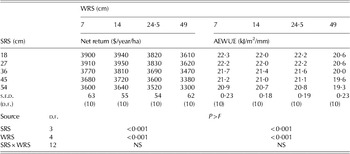
Plant population distribution patterns evidently influenced AEWUE and the annual net return (Table 3), and similar characteristics were observed for the changes in the rainfed plots. Under the same row spacing of winter wheat, the ranking by net return and AEWUE per year for the soybean–wheat system was row spacing 18≈row spacing 27>row spacing 36>row spacing 45>row spacing 54. A significantly negative correlation was observed between net return and row spacing and between AEWUE and row spacing, with r values of −0·9816 and −0·9908, respectively (P<0·05). The averages for row spacing 18 and row spacing 27 were 7 and 6% higher than those of row spacing 45 and row spacing 54, respectively. Under the same soybean row spacing, the ranking by annual net return for winter wheat was row spacing 14>row spacing 7>row spacing 24·5>row spacing 49; the ranking by AEWUE was row spacing 14≈row spacing 24·5>row spacing 7>row spacing 49. The r values between net return and row spacing, and between AEWUE and row spacing, were −0·9540 (P<0·05) and −0·8479, respectively, and the average AEWUE and annual net return for row spacing 14 was 10 and 7% higher, respectively, than those of row spacing 49. The wheat and soybean row spacings were significant for every trait, but the effect of their interaction was not significant for net return and AEWUE.
The net return and annual energy-water use efficiency (AEWUE) of the combination of irrigated winter wheat with rainfed soybean
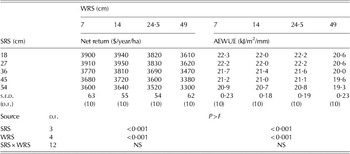
SRS, soybean row spacing.
WRS, wheat row spacing.
DISCUSSION
For winter wheat, the stem number in narrow row spacings was greater than in wide ones. This result can be attributed to increased interplant competition and greater plant mortality in the latter, where the spacing between plants in wider row spacings is much closer than in narrower ones. These results are similar to those obtained by Henderson et al. (Reference Henderson, Johnson and Schneiter2000): intense competition was observed in the late GS, with stem number decreasing, and irrigation improved the crop growth conditions and increased the number of stems.
During the winter wheat growing season, row spacing did not exhibit any observable effects on SMC; indeed, the differences in SMC throughout the growth period were caused by irrigation and rainfall. The SMC of the row spacing 14 treatment was low, which may be attributable to ETa. The soil profile water status greatly affects the density and depth of root penetration and often restricts the full utilization of the available soil water (Angadi & Entz Reference Angadi and Entz2002; Zuo et al. Reference Zuo, Shi, Li and Zhang2006). An upward hydraulic gradient in the root zone and an upward capillary flux may have occurred in the deeper soil layers (Bandyopadhyay et al. Reference Bandyopadhyay, Mallick and Rana2005). Therefore, although there was a slight decline in SMC at the 60 cm soil depth, no SMC scarcity was found for the roots at the 90–120 cm soil depth. The variation in SWS was similar to that in SMC. Soil water storage showed a decreasing trend with advancing GS, which may have been related to the rapid crop growth and increased water consumption in the middle and late periods of crop growth.
During the soybean growing season, soil evaporation and crop transpiration affected SMC and were the major factors affecting SMC at the different soil layers. As shown by the changes in the plant population distribution patterns, the effects of soil evaporation and crop transpiration on SMC varied between the row spacing treatments used. The lack of adequate moisture necessary for a plant to grow normally and complete its life cycle (Zhu Reference Zhu2002) is often a key factor that limits plant growth, productivity and survival (Namirembe et al. Reference Namirembe, Brook and Ong2009; Kamiloğlu Reference Kamiloğlu2011). The differences in the SMC profiles across the treatments within the years studied reveal that changes in plant arrangement produce different water extraction benefits under rainfed conditions. The SWS of row spacing 18 was comparatively higher during R3–R4, probably because of the reduction in soil water evaporation due to the uniform pattern created. Additionally, wider row spacing decreased the water requirement of individual plants at reproductive stages R5–R8, whereas inter-plant competition inhibited plant growth during vegetative stages VE–V6.
Irrigation increased the winter wheat ETa. Previous work demonstrated that the GS01–GS35 is a critical period that influences the plant population size (Zhou et al. Reference Zhou, Li, Yu, Wu and Chen2007). The row spacing 14 treatment produced the largest plant population size, whereas row spacing 49 yielded the lowest; in effect, the row spacing 14 ETa was significantly higher compared with the other treatments. In the present study, irrigation increased the yield and ETa but decreased WUE. The present results are similar to previous findings showing that grain yield is related to ETa (Schneider & Howell Reference Schneider and Howell1997; Huang et al. Reference Huang, Gallichand and Zhong2004). A row spacing of 12 cm resulted in a higher spatial plant distribution and increased crop ground cover, leaf area index, dry matter and light interception (Drews et al. Reference Drews, Neuhoff and Köpke2009). Consequently, a relatively uniform distribution (row spacing 14) promoted crop yield even at a high ETa.
Soil water lost to the atmosphere via soil evaporation from beneath the crop canopy is highly variable and varies with row spacing and the growing season (Yunusa et al. Reference Yunusa, Sedgley, Belford and Tennant1993; Eberbach & Pala Reference Eberbach and Pala2005). The water-use efficiency of the row spacing 18 and row spacing 27 treatments was significantly higher than that of the row spacing 45 and row spacing 54 treatments, respectively, and these findings are attributed to the narrow row treatments used. A greater yield with equivalent levels of water extraction results in a greater WUE. Thus, the row spacing 45 and row spacing 54 treatments showed evident inter-plant competition, creating a field microclimate. The leaf water status varies greatly among different row spacings (Zhou et al. Reference Zhou, Qi, Yang and Chen2011b , Reference Zhou, Sun, Yang, Chen and Liu2012). Indeed, negative correlations were observed between WUE and row spacing, whereas significantly positive correlations were found between WUE and yield, similar to the results of Ethredge et al. (Reference Ethredge, Ashley and Woodruff1989) and Holshouser & Whittaker (Reference Holshouser and Whittaker2002).
Annual energy-water use efficiency helps in the comparison of the differences in the planting systems used under annual double cropping, such as a wheat–soybean or wheat–maize rotation. Evapotranspiration was greater in the row position than in the inter-row position and the high ETa resulted in water loss, impaired water supply and decreased yield (Ohashi et al. Reference Ohashi, Saneoka and Fujita2000; Timlin et al. Reference Timlin, Pachepsky and Reddy2001). In a wide row spacing, the competition among plants within a row may increase and the use of water resources may not be maximized; a narrow row spacing often increases crop competitiveness and improves the plant population structure and field habitat. The narrow row spacing resulted in a lower ETa and higher yield than the wide row spacing. Thus, the net return and AEWUE of the wheat and soybean combination with uniform plant population distribution patterns were better than those of the other patterns.
CONCLUSIONS
The 2-year study on wheat demonstrated that the yield of irrigated winter wheat was significantly higher than that of rainfed winter wheat. Thus, the production of winter wheat in the Huanghuaihai Plain cannot be achieved without irrigation because of the scarce precipitation in the area during the growing season. Moreover, row spacing affected the yield and ETa of the winter wheat plants and a high wheat yield may also be achieved in Northern China by reducing row spacing. The row spacing 7 yield was higher than the row spacing 24·5 and row spacing 49 yields. However, this planting pattern is difficult to practice in agricultural production in which seeds are sown by tractor operations. Given these findings and based on the yield and WUE, row spacing 14 is optimal for this region.
This 3-year study on soybean demonstrated that the enhanced productivity and WUE of rainfed soybean can be achieved in Northern China by reducing the row spacing and widening the space between plants. Similar SMC values across treatments within the 3 study years indicate that changes in the plant arrangement of summer soybean yield no benefits for extracting more water under rainfed agriculture. The conclusion of the present study regarding soybean is that row spacing of ⩽27 cm is optimal for this region.
Significant negative correlations were observed among the net return, AEWUE and row spacing values under the same row spacing of winter wheat and soybean. The plant population distribution affected the WUE, yield and net return of winter wheat and soybean, and the relatively uniform population distribution pattern was better than the other patterns. Based on the results of our study, combining soybean-row spacing 18 or soybean-row spacing 27 with winter wheat-row spacing 14 is optimal for the wheat–soybean cropping system in North China.
Sincere acknowledgments are due to Shujuan Sun, Guomin Yang, Lin Qi for field assistance. This research was supported by the National High Technology Research and Development Programme of China (grant no. 2013AA102903), the Special Fund for Agro-scientific Research in the Public Interest (grant no. 200903040) and the National Key Technology Support Programme of China (grant no. 2012BAD14B07).