Introduction
The decline in dairy herd fertility is virtually worldwide (Lucy, Reference Lucy2001; Bousquet et al., Reference Bousquet, Bouchard and Du Tremblay2004; Evans et al., Reference Evans, Dillon, Buckley, Berry, Wallace, Ducrocq and Garrick2006; Royal et al., Reference Royal, Smith and Friggens2008; Yaniz et al., Reference Yániz, López-Gatius, Bech-Sàbat, García-Ispierto, Serrano and Santolaria2008; Kerby, Reference Kerby2009; Maas et al., Reference Maas, Garnsworthy and Flint2009), with a negative association between the level of milk production and fertility (Harrison et al., Reference Harrison, Ford, Young, Conley and Freeman1990; Butler Reference Butler1998), as well as a negative genetic correlation between the level of milk production and fertility (Boichard et al., Reference Boichard, Barbat and Briend2002; Wall et al., Reference Wall, Brotherstone, Woolliams, Banos and Coffey2003; Winding et al., Reference Winding, Calus, Beerda and Veerkamp2006; Flint, Reference Flint, Ahmad and Derecka2009). Excess inbreeding due to selective pressure may contribute to the decline in fertility (Wall et al., Reference Wall, Brotherstone, Kearney, Woolliams and Coffey2005; Pollot & Coffey, Reference Pollott and Coffey2008).
Fertility is a complex parameter that depends on physiological and environmental factors, such as nutrition and management. Environmental factors are easy to control, while physiological factors are more complex and can depend on the female, male or both. Problems of the female are well known while male hypofertility is more subtle, is difficult to define and measure, and it can have a huge impact on the population due to artificial insemination (AI).
Fertility of the bull may depend on the quality of semen and on the level of intrinsic fertility of the bull itself. Reduced fertility due to poor semen quality can, in some way, be controlled and improved by acting on certain seminal features (concentration, motility, morphology, membrane integrity) (Pace et al., Reference Pace, Sullivan, Elliot, Graham and Coulter1981; Den Daas, Reference Den Daas1992; Saacke et al., Reference Saacke, Nadir and Nebel1994, Reference Saacke, Dalton, Nadir, Nebel and Bame2000; Hammerstedt, Reference Hammerstedt1996; Mehmood et al., Reference Mehmood, Anwar and Naqvi2009), while it can not be improved if it is associated with the intrinsic factors of the bull.
In order to make optimal use of semen, a production centre must rationalize the dosage of insemination straws, keeping into consideration the fertility of a bull (Galli et al., Reference Galli, Bornaghi, Basetti, Martignoni, Balduzzi and Moretti1990). Despite this need, no single measurement or in vitro based test is currently available that provides a reliable estimate of bull fertility, although a combination of several sperm trait assessments seems to be more informative (Amann, Reference Amann1989; Farrell et al., Reference Farrell, Presicce, Brockett and Foote1998; Zhang et al., Reference Zhang, Larsson, Lundeheim, Håård and Rodriguez-Martinez1999; Januskauskas et al., Reference Januskauskas, Johannisson and Rodriguez-Martinez2003; Pillips et al., Reference Phillips, Mcgowan, Johnston and Mayer2004; Giritharan et al., Reference Giritharan, Ramakrishnappa, Balendran, Cheng and Rajamahendran2005; Hallap et al., Reference Hallap, Nagy, Jaakma, Johannisson and Rodriguez-Martinez2006; Gillan et al., Reference Gillan, Kroetsch, Chis Maxwell and Evans2008; Kastelic & Thundathil Reference Kastelic and Thundathil2008).
At present, the most popular method worldwide for fertility estimation is related to non-return rate (NR), and is accurate only if a vast amount of data, randomized and corrected for main factors of environmental variability, is available. Therefore, with the NR it is possible to estimate the level of fertility only after the widespread use of a bull, and the need to rapidly acquire information on fertility remains unresolved.
Over a large series of inconclusive approaches, a promising way to provide a proper estimation of fertility is the use of an index of heterospermic fertility, proposed by Beatty et al. back in Reference Beatty, Bennett, Hall, Hancock and Stewart1969. This approach includes the use of inseminating doses containing populations of sperm of two different bulls, placed directly in competition in the female genital tract. Using appropriate experimental designs, all pairs of bulls are compared and the number of offspring from each bull is compared with all the other (Martin & Dziuk, Reference Martin and Dziuk1977). This competitive index eliminates factors related to the environment, operators and sperm number (Berger Reference Berger1995), and is not influenced by male–female interaction (Berger & Dally, Reference Berger and Dally2001). The limit is the complexity and the cost of experimental design in the field. Sperm oocyte binding in vivo assessed by collection of zygotes soon after fertilization (Saacke et al., Reference Saacke, Nadir and Nebel1994) showed an important association with the fertility of the bull, but this experimental approach was too complex to allow actual application.
An interesting in vitro alternative was proposed for the rabbit (Parrish & Foote, Reference Parrish and Foote1985) and cat species (Niu et al., Reference Niu, Greube, Ji and Jewgenow2006). Using these methods, fluorochrome-labelled spermatozoa from two bulls are simultaneously exposed to oocyte zona pellucida (ZP) in vitro, and allow immediate evaluation of sperm binding capacity. Application of this approach to bovine has given controversial results (Henault & Killian, Reference Henault and Killian1994; Braundmeier et al., Reference Braundmeier, Demers, Shanks, Saacke and Miller2002) but may still allow in vitro evaluation of fertility.
The aim of this work was to evaluate an in vitro test that combined the power of a statistical evaluation of competitive ZP-binding ability of spermatozoa with a simple and accurate method for sperm counts, and then to compare this to field fertility (ERCR).
Materials and Methods
Experimental design
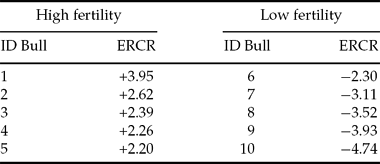
Ten Holstein Friesian bulls were identified on the base of their estimated field fertility and assigned to two groups of high and low fertility (Table 1). Semen quality and kinetic parameters were assessed.
Estimated relative conception rates (ERCR) of sample bulls

Semen samples were randomly assigned with an internal code so that blind procedures could be used, and an in vitro heterospermic insemination approach based on ZP-binding by differentially stained sperm was applied to 45 pairs of bull semen. The test was then repeated using a second batch of semen samples. To minimize any effect of the stain the fluorochromes used for each of the two sperm samples were switched between batches.
Finally, an index of competitive binding ability was developed using the data obtained in vitro and the results were compared with values of fertility estimated in vivo.
Calculation of fertility reference in the field
An updated file reporting the 56-day non-return rate in lactating cows in service in Italy (data and data processing provided by Associazione Nazionale Allevatori di Frisona Italiana ‘ANAFI’, Italy) was used to calculate the field fertility index of bulls, using a modification of the model designed by Clay & McDaniel (Reference Clay and McDaniel2001). Briefly, the model is described as follows:

where: NR56 = 56-day non-return status after AI (1 no return; 0 re-inseminated); FYM = farm–year–month of insemination; ECM = energy-corrected milk production adjusted to 3.5% fat and 3.2% protein content; five classes (<5.5 to 9, 10 to 14, 15 to 19 and >20 kg). P = parity (1, 2, 3); DOI = days open at first mating; 6 classes (<42, 42 to 62, 63 to 83, 84 to 104, 105 to 126, >126 days); ERCR = random effect of service sire estimated using a complete data set consisting of 1,091,377 records (771,235 cows and 2450 bulls); OSIRE = origin of the service sire (1, foreign; 2 progeny; 3 proved); AIS = AI centre (a number of 14 AI centres were used); PE = permanent cow effect; e = residual.
As indicated by Clay & McDaniel (Reference Clay and McDaniel2001), only bulls with an adequate number of inseminations (range from 938 to 9769) were used in this work.
In summary, the model assigned the bulls a value of fertility measured as a percentage of non return cows inseminated with their semen, purified of the main factors of variability.
Semen analysis
Two batches of frozen semen of the 10 selected bulls were evaluated for quality parameters. Kinetic parameters (total motility, progressive motility and mean velocity) were assessed by a computerized image analyser (CASA system, HTM-IVOS version 12; Hamilton Thorne). Spermatozoa with an average path velocity (VAP) > 25 μm/s were defined as motile (MT), while the sperm with a straight-line velocity/path velocity > 0.8 were defined as progressively motile (MP). Sperm integrity (IS), with particular regard to abnormalities (acrosome anomalies, total sperm anomalies and proximal cytoplasmic drops) was evaluated by visual estimation under interferential–differential contrast microscope (magnification: ×1250) after fixation in 0.2% glutaraldehyde solution in PBS without calcium and magnesium (1:2 v/v). Furthermore, concentration (CONC) analysis and a viability test to assess membrane integrity (IM) were performed using NucleoCounter SP-100 (ChemoMetec A/S).
Oocyte recovery and maturation
Ovaries were collected from a local abattoir and transported to the laboratory in PBS supplemented with penicillin and streptomycin, at 20–25°C. Follicles of 2–8 mm in diameter were aspirated with an 18-gauge needle connected to a vacuum pump and oocytes were selected on the basis of morphology and the presence of homogeneous layers of cumulus cells in HEPES-buffered tissue culture medium (TCM199, Sigma-Aldrich) supplemented with 0.1% bovine serum albumin (BSA, no. A9418, fraction V, Sigma). Groups of a 100 to 120 selected oocytes were then matured for up to 24 h in 2 ml bicarbonate-buffered TCM199 supplemented with follicle stimulating hormone (FSH)/luteinizing hormone (LH) (0.05 IU/ml, Pergovet) and 10% fetal bovine serum (FBS, Sigma), in 5% CO2 and 95% humidified air at 38.5°C.
Sperm staining
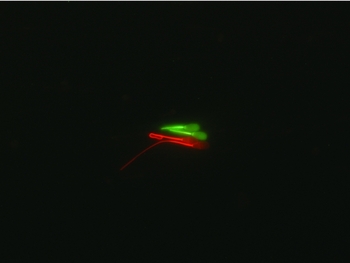
Frozen semen samples were thawed at room temperature for 30 s in water bath and washed by 10 min centrifugation at 500 g in 10 ml HEPES-buffered Ca2+-free TALP medium (H-TALP) (pH 7.4) supplemented with 0.6% BSA. Sperm pellets were then differentially resuspended in 1 ml H-TALP medium containing either CellTracker(tm) Red (10 μM) (Invitrogen Ltd), or a combination of CellTracker(tm) Green (25 μM) (Invitrogen) and Fluo-4 AM (2.5 μM) (Invitrogen) and incubated for 1 h at room temperature in a non-static system. CellTracker(tm) is a supravital stain that reacts with thiols and is transformed into a cell-impermeant fluorescent dye-thioether. Green (CMFDA) and red (CMTPX) fluorescence in the cells is reasonably photostable during microscopic examination. CMFDA and CMTMX probes were brightly fluorescent for at least 72 h after incubation. Fluo-4 AM is a fluorescent Ca2+ indicator dye that offers a bright fluorescence emission in response to Ca2+ binding. Concentration of stains was empirically determined to ensure that the spermatozoa are visible and that the populations can be well discriminated (Fig. 1). The dyes were dissolved in DMSO and subsequently diluted in H-TALP. In order to eliminate possible differences due to the potential toxicity of DMSO, the diluent in all working solutions was adjusted to the same concentration.
Fluorescence microscopy (×60) showing spermatozoa stained with red (CellTracker™ Red) or green (Fluo-4 AM and CellTracker™ Green) dyes.

After staining, motile sperm were selected by 20 min centrifugation at 500 g on discontinuous Percoll gradients (45–90%). The 90% Percoll fraction was obtained combining 9 ml of Percoll (no. P1644, Sigma) and 1 ml of 10 × Tyrode's solution (46.75 g NaCl/l, 2.3 g KCl/l, 0.4 g NaH2PO4/l, 20.9 g HEPES/l; pH 7.4). In the isotonic 90% Percoll was then added 2.1 g NaHCO3/l, 3.7 ml 60% Na-lactate/l and 7.8 mg MgCl2.6H2O/l. For Percoll gradients preparation, 2 ml of Percoll 90% was carefully pipetted under 2 ml of Percoll 45%, which was obtained by mixing 1 ml of Percoll 90% with 1 ml of H-TALP. After centrifugation, sperm pellets were resuspended in 5 ml H-TALP medium and washed by 10 min centrifugation at 500 g. Finally the sperm concentration of the pellet was determined using a haemocytometer.
In vitro heterospermic insemination
For each competitive assay the semen of the two bulls to be tested was differentially stained and then suspended in 1 ml of IVF medium containing 10 μg/ml heparin and 10 μl penicillamine, hypotaurine and epinephrine (PHE, 100×) (Rosenkrans et al., Reference Rosenkrans, Zeng, McNamara, Schoff and First1993), at a concentration of 0.15 × 10⁶ sperm/ml per bull. The total concentration of semen in IVF was 0.3 × 10⁶ sperm/ml. The sperm suspension was poured into wells in 300 μl volumes and 25 matured oocytes (1500 sperms/oocyte) were added and co incubated in 5% CO2 and 5% O2 in humidified air at 38.5°C (Galli et al., Reference Galli, Crotti, Notari, Turini, Duchi and Lazzari2001) over a period of 1 h. Prior to insemination, mature oocytes were vortexed to completely deprive them of granulosa cells.
According to the scheme, each bull was tested nine times for each of the two batches, using different harvests of oocytes.
Slide preparation
At the end of co-incubation, using a plastic pipette, groups of 25 oocytes per pair tested were harvested and washed three times in TALP-Wash Medium, in order to remove loosely attached sperm. The last step involved a double wash in distilled water containing 0.6% BSA. With a glass Pasteur pipette pulled on the flame, the oocytes were then individually collected and placed on slides in single drops and air dried at room temperature in the dark. The drops of distilled water containing single oocytes were identified under a stereo microscope and marked, to facilitate their identification.
During this drying phase, the oocytes suffered a gradual flattening, which led the entire surface of the ZP to adhere to the slide, forming a thin film. Stored in the dark, spermatozoa were clearly visible for up to three days after preparation.
Slide analysis
Oocytes were analysed under a fluorescence microscope using a filter set for green (excitation 465–495; emission 515–555) and red (excitation 540–580; emission 600–660) fluorescence, at ×40 magnification. When necessary, a ×60 immersion objective lens was also used.
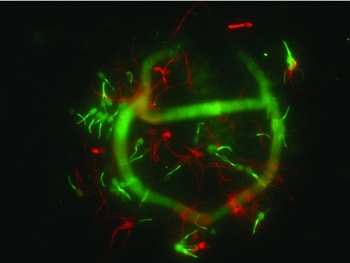
Sperms stained with each fluorochrome bound to the ZP were counted (Fig. 2).
Fluorescence microscopy (×40) showing spermatozoa stained with red (CellTracker™ Red) or green (Fluo-4 AM and CellTracker™ Green) dyes bound to the zona pellucida. Spermatozoa are displayed on a single focus plane after air drying.

Evaluation of stain toxicity
A preliminary test was conducted to assess whether the different stains could interfere in the sperm/ZP bond. The evaluation was conducted using the protocol described, as briefly specified below:
Semen of control bulls was thawed and after the first wash was divided into two equal volumes. The two aliquots were stained with green and red dye respectively, and after the staining procedure, motile sperm were selected using Percoll gradients. In addition, this procedure was effective for the removal of excess dye. The two populations, red and green, were adjusted to the same concentration and used for insemination. Spermatozoa attached to the ZP were counted. The trial was performed using three different bulls and a total of 79 oocytes were used.
Calculation of competitive binding index (CBI)
The index of in vitro competitive binding was calculated based on the relative frequencies for each bull, considering all the confrontations using the following model:
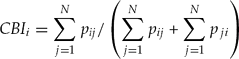
where: CBIi = CBI of i-th bull; Pij = absolute frequency of sperm of the i-th bull in the competition with the j-th bull by the N competitions; Pji = absolute frequency of sperm of the j-th bull in the competition with the i-th bull by the N competitions. Bulls were then classified according to the CBI.
Statistical analyses
Descriptive statistics of quality seminal parameters was calculated and variables were subjected to Pearson linear regression analyses using R programming and statistical packages (Crawley, Reference Crawley2007). Statistical analysis of stain toxicity results was performed using the chi-squared and the Fisher tests.
In order to evaluate any effect that number of oocytes could have on ranking of bulls, a dataset was organized by creating for each bull and for each of the two batches, five classes of oocytes (OOCYTE) of increasing group size (5, 10, 15, 20 and 25 oocytes, respectively classes 1 to 5). The five classes were generated by extrapolating from the data obtained with 25 oocytes in the competitive assays conducted on each batch. The CBI for the 10 bulls was then calculated for the five oocyte classes on batch 1 and 2 (BATCH), and the dataset was subjected to statistical analysis using the following general linear model:

where: CBIijk = ijk-th data value; OOCYTEi = differential effect of the i-th level of factor OOCYTE (i = 1–5); BATCHj = differential effect of the j-th level of factor BATCH (j = 1, 2); eijk = error associated with the ijk-th data value with N (0, σ).
The effect of the bull on CBI within the same class of oocytes was also evaluated using the following linear model:

where: CBIijk = ijk-th data value; OOCYTEi = differential effect of the i-th level of factor OOCYTE (i = 1–5); BULLj(i) = differential effect of the j-th level of factor BULL (j = 1–10) nested to i-th level of OOCYTE; eijk = error associated with the ijk-th data value with N (0, σ).
To assess the extend of influence of semen batches, bull effect was evaluated within single batches using the following model:

where: CBIijk = ijk-th data value; BATCHi = differential effect of the i-th level of factor BATCH (i = 1, 2); BULLj(i) = differential effect of the j-th level of factor BULL nested to i-th level of BATCH; eijk = error associated with the ijk-th data value with N (0, σ).
The effect of oocytes number on the final ranking of bulls calculated on pooled data of the two batches was finally statistically evaluated with the following:

where: CBIij = ij-th data value; eij = error associated with the ij-th data value with N (0, σ). In all the models m = overall mean.
Results
Semen analysis
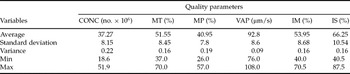
Descriptive statistics of seminal quality of the 10 bulls is reported in Table 2. The results of linear regression analyses between the individual seminal variables or their linear combination and ERCR highlighted only one notable association between IM and ERCR (adjusted R2 = 0.2955; F = 8.97; DF = 1.18; p = 0.007769). These data alone could not predict bull fertility.
Descriptive statistics of quality parameters of two semen batches of bulls used in heterospermic insemination trials

CONC, concentration per paillette; IM, membrane integrity; IS, sperm integrity; MP, progressive motility; MT, total motility; VAP, average path velocity.
Evaluation of stain toxicity
The total number of spermatozoa differentially stained (red vs. green) counted on the surface of the oocytes was 1890 vs. 1984 (total oocytes no. = 79; three control bulls).
The chi-squared test (χ2 = 3.7808, p = 0.151) and Fisher test (p = 0.1506) showed no significant statistical difference between the two stains.
In vitro heterospermic insemination
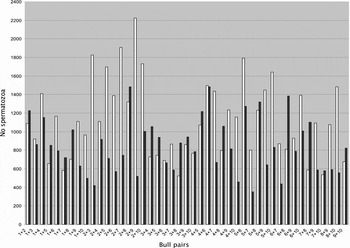
The absolute number of spermatozoa counted in the 45 combinations of bull pairs is reported in Fig. 3.
Number of spermatozoa counted in the 45 combinations of bull pairs. Each combination was tested on two semen batches and spermatozoa were counted on 50 oocytes (25 oocytes per batch).

The number of spermatozoa bound to a single oocyte for each bull, regardless of the stain, ranged from 0 to 60. Thus, for each competitive assay (25 oocytes per batch, 50 oocytes per assay) the total number of sperms counted per bull showed a wide distribution.
Calculation of the competitive binding index
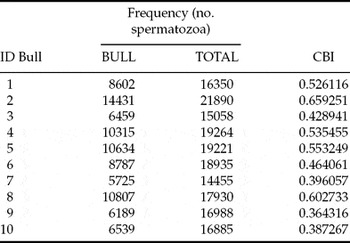
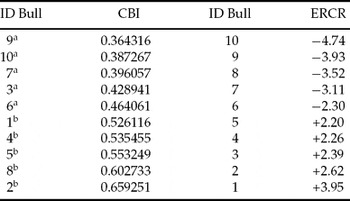
The frequencies of the 10 bulls and the deriving values of the CBI are presented in Table 3. The classification of the 10 bulls on the basis of CBI and their classification according to ERCR are reported in Table 4.
Frequencies of bulls and deriving values of competitive binding index (CBI)

Frequencies are expressed as number of spermatozoa counted on the surface of oocytes. BULL represents the sum of spermatozoa of a single bull in all its combinations, TOTAL is the sum of BULL and the number of spermatozoa of all the bulls confronted with it.
Competitive binding index (CBI) classification of the 10 bulls calculated on two semen batches in confront with classification according to ERCR

aBulls (CBI < 0.50; ERCR <0) are classified respectively as low binding ability and low fertility bulls. bBulls (CBI > 0.50; ERCR > 0) are classified as high binding ability and high fertility bulls, respectively.
The CBI rank was subdivided into two classes of high (CBI > 0.50) and low (CBI < 0.50) binding ability. The comparison between CBI and ERCR shows only two bulls with a different classification in the two ranks: bull 3 with low score in CBI and high in ERCR and bull 8 with the opposite situation, high score in CBI and low in ERCR.
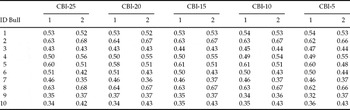
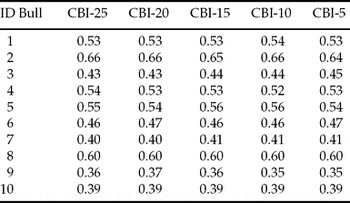
After statistical analysis by general linear model, the number of oocytes per assay did not affect the computing of CBI for none of the bulls when associated to each of the two batches (p > 0.5) (Table 5). Similarly, the effect of bull expressed as level of significance, remained completely unvaried with decreasing the number of oocytes for all the 10 bulls.
Competitive binding index (CBI) values of the 10 bulls calculated separately for batch 1 and batch 2, using data relative at 25, 20, 15, 10 and five oocytes per single competitive assay

For each bull, values in different columns show no statistical difference (p > 0.5) within the same batch.
Considering the estimate of variability among batches, when effect of bull was associated to the batch a high significance (p > 0.001) was reported equally in batch 1 and batch 2 for eight bulls, whereas two bulls (bull 3 and 6) highlighted a difference between the two batches showing a high significant effect in batch 1 (p > 0.001) and a no statistically significant effect (p > 0.05) in batch 2.
For ranking the bulls CBI was therefore calculated by pooling data from the two batches, and the statistical evaluation of the influence of oocytes number on the CBI was confirmed not to be significant (p > 0.5) for all the bulls, even if number of oocytes per assay is reduced to 5 (Table 6).
Competitive binding index (CBI) of the 10 bulls calculated with data pooled from two semen batches using data from 25, 20, 15, 10 and five oocytes per single competitive assay
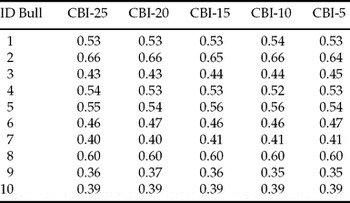
For each bull, values in different columns are not statistically different (p > 0.5).
Discussion
As heterospermic insemination was proposed as a tool for predicting male fertility, numerous researches have been aimed at simplifying its use for a more practical application. When experiments were conducted in vivo, a good consistency was generally evidenced (Parrish & Foote Reference Parrish and Foote1985; Stahlberg et al., Reference Stahlberg, Harhzius, Weitze and Waberskila2000; Flint et al., Reference Flint, Chapman and Seidel2003). Alternatively, in vitro redefinition of the approach resulted in more conflicting outcomes. A test based on different fluorochrome-labelled spermatozoa gave a positive correlation between in vivo fertility and penetration of zona-free bovine oocytes (Henault & Killian Reference Henault and Killian1994). By contrast Braundmeier and colleagues (2002) in vitro competitive zona binding assay could rank the bulls, but did not correlate with the 56-day no return rates, zona binding in vivo, or the number of accessory spermatozoa detected on in vivo produced embryos. Their contrasting findings are probably due to the different experimental designs and data interpretation.
Generally, a main notable difference between reports is the source of oocytes. Especially in non-domestic species, in which a sufficient number of oocytes can not be easily recruited at once, several regimens for storing oocytes have been adopted. As a consequence, ZP-binding tests include the use of immature, metaphase II-arrested, chilled overnight or even fixed oocytes, in which the success of these storing procedures seems to vary between species. In our study the use of fresh in vitro matured oocytes was adopted, as the beneficial use of IVM oocytes for application of ZP-binding assay has been reported in different species (Marco-Jiménez & Vicente Reference Marco-Jiménez and Vicente2004; Hermansson et al., Reference Hermansson, Axnér and Ström Holst2007) as also supported by the fact that mature and immature oocytes differ in the glycoproteins of the zona pellucida, along with the number of sperm receptors (Lucas et al., Reference Lucas, Martìnez, Roca, Vàzquez, Gil, Pastor and Alabart2003). In these studies the authors also thought that the damage from extensive artificial manipulation to be the cause of drastic reduction in sperm binding capacity.
A large variability in response to in vitro tests between different ejaculates of the same bull has been generally reported (Otoi et al., Reference Otoi, Tachikaw, Kondo and Suzuki1993; Zhang et al., Reference Zhang, Larsson, Lundeheim and Rodriguez-Martinez1997, Reference Zhang, Larsson, Rodriguez-Martinez, Lauria, Gandolfi, Enne and Gianaroli1998b). Variation in sperm-binding capacity between single oocytes and between oocyte batches was also reported using homospermic ZP-binding assays in canine (Ström Holst et al., Reference Ström Holst, Larsson, Linde-Forsberg and Rodriguez-Martinez2000) and bovine (Zang et al., Reference Zhang, Larsson and Rodriguez-Martinez1995) species. Successful application of homospermic ZP-binding tests were therefore applicable only when large numbers of oocytes per batch and several batches per test were used (Zang et al., Reference Zhang, Larsson and Rodriguez-Martinez1995; Reference Zhang, Larsson, Lundeheim and Rodriguez-Martinez1998a) or by performing hemi-zona assays (Franken et al., Reference Franken, Lombard, Acosta, Oehninger, Kruger and Hodgen1993; Fazeli et al., Reference Fazeli, Zhang, Steenweg, Larsson, Bevers, Van Den Broek, Rodriguez-Martinez and Colenbrander1997), in which both the halves of microsurgically bisected ZPs were used to compare control sperm and test sperm populations. Whilst ZP dissection minimizes the variability related to oocytes its application imposes a precise microdissecting-based and time-consuming technique and its use in humans has recently been debated (Magerkurth et al., Reference Magerkurth, Töpfer-Petersen, Schwartz and Michelmann1999).
Considering the variability due to ejaculates and oocytes, in the present work the information for calculating the CBI of each bull was drawn from data obtained using two semen batches and, within each batch, using nine independent tests of the bull throughout the combinations with all the others. While the competitive approach overcame the variability in oocyte quality within single pair tests, variations in oocyte batches had to be randomized to ensure that the same bull was tested on different days on different oocyte batches. Overall, the experimental design included extensive testing of all subjects, thus giving a reasonably accurate characterization of ZP binding ability.
The range of number of spermatozoa bound to oocyte per bull reported in this work is compatible with those reported by other authors: e.g. from 0 to more than 200 spermatozoa (Fazeli et al., Reference Fazeli, Zhang, Steenweg, Larsson, Bevers, Van Den Broek, Rodriguez-Martinez and Colenbrander1997), and 26.9–141.9 (73.2 ± 31.3, Zhang et al., Reference Zhang, Larsson, Lundeheim, Håård and Rodriguez-Martinez1999). The number of sperms/oocyte is principally due to the concentrations of sperm, insemination duration and method of removing loosely attached semen before counting. This last step, which includes manual washing of oocytes by pipetting, is subjectively performed in the laboratories. When assessments are based on the absolute number of sperms bound to the ZP, such differences among oocytes may have a great impact on the outcome of the test and therefore require the use of a large number of oocytes. In this work we clearly showed that through the heterospermic approach, which is based on evaluation of relative differences, this problem is completely overcome so that the same result using a very large number of oocytes (2250 oocytes) could be obtained using only a fifth of this number. This finding provides suggestions for possible future review of the experimental design that could be addressed by a drastic scaling at single pair assay level with the benefit of allowing the implementation of alternatives, e.g. a larger scale testing for batches.
Quality assessment of seminal parameters confirms the lack of significant correlation between field fertility and seminal features. Even though this observation is traditionally accepted, any investigation of intrinsic sperm fertility should not leave out the consideration of the possible pathological status of sperm samples that are used as a model. In this work, neither the high nor the low fertility sperm samples could reveal their fertility potential after traditional screening for quality parameters. However, when samples were compared with the same oocytes, differences in functional traits became evident. In particular, ZP-binding ability of high fertility bulls was generally superior to that of low fertility ones. These differences were sufficient to rank the bulls into two categories and, for eight bulls out of 10, their classification were in accordance with the in vivo estimates.
The discrepancy in the classification reported for two bulls deserves some consideration: firstly, regarding the bull with low ERCR and high binding ability as determined in vitro, the simple explanation could be that, for this bull, the ability to bind with the ZP is not the limiting trait responsible for its hypo-fertility, nor can this trait (or even more traits) be identified among those seminal parameters that we have screened in this work. Of interest is the low sperm membrane integrity of both semen batches for this bull (46% and 49%, data not presented) as compared with the average for all the other bulls (53.95 ± 8.68). By contrast, the other bull with defective ZP-binding ability performed normally when was used in AI. An explanation could be hypothesized due to current of AI practice, which proposes the use of straws that are generally packaged with a sperm content that exceeds that needed (Pace et al., Reference Pace, Sullivan, Elliot, Graham and Coulter1981). In this study the authors have identified that the best range is 2–8 million spermatozoa, beyond which there is no significant increase in field fertility, while more recent works (Den Daas, Reference Den Daas1997; Seidel et al., Reference Seidel, Schenk, Herickhoff, Doyle, Brink, Greenm and Cran1999) have shown that this number can be reduced even more without affecting the fertility. In this regard, the low semen concentration used in the present work to perform in vitro tests seems to be adequate for detecting a sperm functional deficiency that paradoxically, for some subjects, can be compensated by the AI use of straws produced with a non-rational and excessive number of spermatozoa. This observation is supported by the high semen concentration per paillette reported on average for the bulls used in this work.
Some technical observations concern the need to run an accurate count of spermatozoa over the entire ZP surface, given the spherical shape of the oocyte. The only method proposed in the literature, which includes fixation and crushing of oocytes with a coverslip, is in our view not fit for our purpose. Although flattened, such oocytes are still so thick that several focal planes must be counted, making this operation onerous and it did not allow the use of immersion objectives. Furthermore, sperm attached on the lower surface had a loss of fluorescence due to the presence of cytoplasm. Drying eliminated completely the three-dimensional effect of oocytes and displayed all the spermatozoa in one single plane. Use of distilled water prevented crystal formation during evaporation, while the BSA allowed the manipulation of oocytes that was otherwise impossible in this medium.
In conclusion, the significant congruency that appeared after comparing the ERCR and CBI ranking allows consideration of competitive binding as a valid support in estimating the fertility of young bulls and, if confirmed in other species, could lead to a drastic reduction of the number of oocytes required when their availability is a limiting factor.
Given the complex nature of fertility and the argumentation discussed about the possible occurrence of some ‘false positives’ or ‘false negatives’, it shows how integrated use of different approaches while attempting to estimate fertility is increasingly important. The characterization of each subject, which should include systematic screening for both qualitative and functional traits, could enable users to better compensate some minor functional reproductive deficits or, where not possible, could provide early identification and removal of those subfertile sires before entering a breeding programme. CBI could provide useful information to support the optimization in semen production centres for a more rational use of semen straws in AI. However before this protocol can be widely accepted it should be validated on a more extensive group of specimens.
Acknowledgements
The authors wish to thank Dr Giorgio Burchiellaro, General Director of the Associazione Nazionale Allevatori di Frisona Italiana (ANAFI), for providing ERCR data. This work has received financial support from the Regione Lombardia (research plan 2007–2009).