
Introduction
Functional materials change specific physicochemical properties under the action of external stimuli such as light, electric field, magnetic field, temperature, pressure, or interaction with atoms/molecules. Metal oxides are particularly known for this behavior.[ Reference Ogale, Venkatesan and Blamire 1 ] Their distinct properties and functions make metal oxides a class of scientifically as well as technologically relevant materials. Metal oxides consist of a large number of binary, ternary, and multinary compounds known for a wide range of specific attributes including dielectric, semiconducting, magnetic, ferroelectric, piezoelectric, catalaytic, and superconducting behavior. They are used in applications linked to everyday life (for example, food and medicines) as well as in devices in a wide range of areas such as electronics, optoelectronics, photovoltaics, photocatalysis, and environmental sensing. A distinct feature of the metal oxides is the strong dependence of their properties on stoichiometry and crystal defects.[ Reference Kalinin and Spaldin 2 ] In particular, many of the useful properties of transition metal oxides arise from defects created due to oxygen deficiency and variable valency of cations. For example, oxygen deficiency in perovskites plays a key role in the high-temperature superconductivity exhibited by these materials.[ Reference Bednorz and Muller 3 , Reference Wu, Ashburn, Torng, Hor, Meng, Gao, Huang, Wang and Chu 4 ] Oxides such as alumina and zirconia are extensively used in industries for their structural stability under corrosive and high-temperature environments. In many applications, the metal oxides are considered as low-cost alternatives to rare and expensive non-oxides as they, when properly engineered, exhibit properties similar to those non-oxides. For example, titanium dioxide (titania; TiO2) is an essential component of the potentially low-cost dye sensitized and solid-state hybrid solar cells[ Reference O'Regan and Gratzel 5 , Reference Liu, Johnston and Snaith 6 ] whereas zinc oxide is regarded as an alternative material for gallium nitride in optoelectronic devices.[ Reference Janotti and Van de Walle 7 ]
The emergence of techniques for fabricating and characterizing nanostructured functional oxides further widened the scope of their application. The nanoarchitectures such as nanowires and nanotubes of oxides exhibit exceptional properties useful for new generation devices in various fields. For example, zinc oxide nanowires were reported to show phenomena such as quantum confinement effects[ Reference Yin, Gu, Kuskovsky, Andelman, Zhu, Neumark and O'Brien 8 ] and room temperature ultraviolet (UV) lasing.[ Reference Huang, Mao, Feick, Yan, Wu, Kind, Weber, Russo and Yang 9 ] This nanoarchitecture of zinc oxide was found to be useful for devices such as dye sensitized solar cells,[ Reference Law, Greene, Johnson, Saykally and Yang 10 ] broadband light-emitting diodes (LEDs),[ Reference Bao, Zimmler, Capasso, Wang and Ren 11 ] UV detectors,[ Reference Soci, Zhang, Xiang, Dayeh, Aplin, Park, Bao, Lo and Wang 12 ] and piezoelectric nanogenerators.[ Reference Wang and Song 13 ] The nanoscale feature size provides very high surface area to volume ratio and enables a significant fraction of atoms to sit at the surface. The applications such as electrocatalysis, photocatalysis, and chemical sensing in which surface reactions control the charge carrier concentration and transport through the bulk, could take advantage of this property. Furthermore, the enormous enhancement in the geometric surface area per unit flat area (also called roughness factor) aid them find use in fields such as solar cells and solar fuel generation. For example, titania nanotube arrays were reported to have promising properties related to environmental sensing,[ Reference Paulose, Varghese, Mor, Grimes and Ong 14 ] photovoltaics,[ Reference Varghese, Paulose and Grimes 15 ] photocatalysis,[ Reference Varghese, Paulose, LaTempa and Grimes 16 ] and energy storage.[ Reference Lu, Wang, Zhai, Yu, Gan, Tong and Li 17 ]
While both nanowire and nanotube geometries are attractive for practical applications, the nanotube geometry provides higher surface area than wires for a given diameter, as the tubes possess both inner and outer surfaces. Furthermore, unlike the case of wires, the structural integrity of the tubes can be maintained even if the wall is thinned to a few nanometers. In semiconducting oxides used for applications such as photocatalysis and chemical sensing, thin walls help the charge carriers to remain in close proximity to the surface and take part in surface reactions. The array geometry (vertically aligned nanotubes or nanowires) is particularly useful as it could help improve the optical properties of the material and provide facile pathways for the conduction of charge carriers along the length to the substrate region. A nanotube array of length 20 µm, pore diameter 100 nm, and wall thickness 20 nm could enhance the surface area about thousand times.[ Reference Shankar, Mor, Prakasam, Yoriya, Paulose, Varghese and Grimes 18 ] The nanotube arrays can also be used for particle/molecular filtration purposes.[ Reference Paulose, Prakasam, Varghese, Peng, Popat, Mor, Desai and Grimes 19 ] Furthermore, the nanotube growth is a very scientifically intriguing phenomenon.
Over the past two decades, a large number of physical, chemical, electrochemical, and hybrid fabrication routes, including physical or chemical vapor deposition, electrospinning, molecular beam epitaxy, pyrolysis of organics, template-assisted synthesis, solvo/hydro thermal treatment, sol–gel, anodic oxidation, and electrodeposition have emerged for the growth of functional oxide nanostructures, especially for nanowires and nanotubes. Nevertheless, only a handful of these technologies have shown commercial viability and anodic oxidation is one among them. Anodization is an industrial technique used for large-scale low-cost protective oxide coatings. It is now known for its ability to yield ordered self-assembled nanoarchitectures such as nanoporous films and nanotubes over large areas. The process is simple, economical, and scalable. It offers environmentally friendly fabrication routes also. We discuss here the basic anodization process and various oxide nanotubes developed using the technique and some of their useful properties and applications.
Anodization
Background
Anodization is basically a process for forming a thick oxide layer on the surface of a metal by applying a potential. The electrochemical way of anodization was apparently developed in the 19th century.[ Reference Buff 20 ] In 1923, Japanese researchers Kujirai and Ueki filed a patent for making anodic alumina coating in the United States Patent Office.[ Reference Kujirai and Ueki 21 ] During that period of time, the technique was reported to be used in England as an industrial process for making protective coatings on duralumin.[ Reference Lerner 22 ] Since then numerous recipes and methodologies have been developed for making oxides of various metals such as aluminum, titanium, tantalum, zirconium, etc. that form stable oxides. Anodization has been traditionally used for making corrosion/abrasion resistant and decorative coatings. The process consists of dipping the metal to be oxidized in an electrolyte and applying a positive potential to it (anode) while providing a negative potential to another electrode (cathode) made of materials such as platinum, steel or graphite that do not react with the electrolyte. Anodization in an electrolyte typically increases both the thickness and density of the oxide layer compared with the oxide film formed on a metal surface exposed to air. Chromic acid or sulfuric acid or both were commonly used in the industry as the electrolyte for the anodization of aluminum in the early stages of its development. The electric field and charged species in the electrolyte assist the initiation and growth of oxide layer on metal surface. While dense and porous films were routinely produced on valve metals in laboratories and industries, the potential of the technology in yielding ordered nanoarchitectures was revealed when Masuda and Fukuda fabricated highly ordered nanoporous aluminum oxide films on aluminum.[ Reference Masuda and Fukuda 23 ] Since then ordered nanoporous films, nanotubes, nanowires, and other nanoarchitectures of various metal oxides have been developed using the technique. One of the most useful attributes of the technique is its ability to yield self-assembled nanotube array films and self-standing membranes. As a result of these tremendous advancements in the field, anodization has become a highly sought after technique for the fabrication of oxide nanostructures.
Nanotube growth
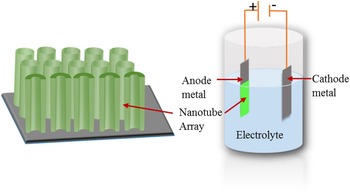
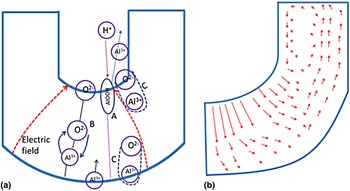
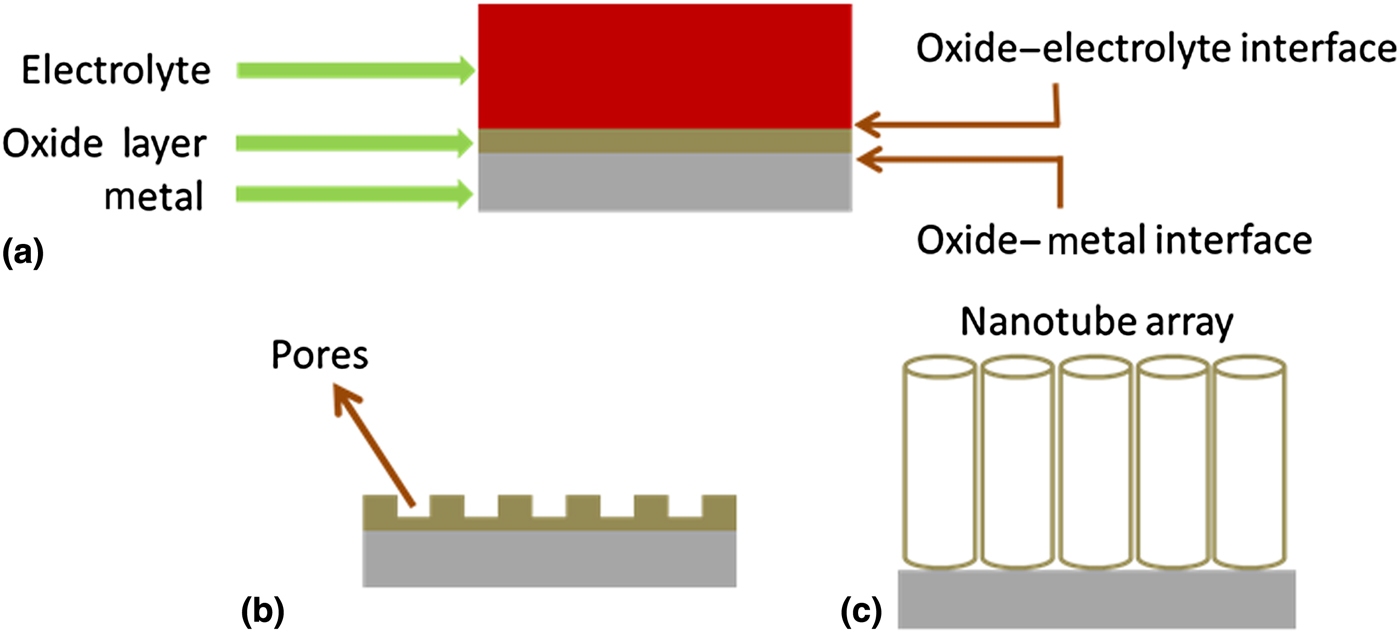
Figure 1 shows the sketches of the nanotube array architecture and a simple anodization setup for fabricating the nanotubes and other anodic structures. The metal to be anodized is connected to the positive terminal of the power supply and immersed in an electrolyte. The negative terminal is connected to an appropriate cathode material such as platinum, steel, or graphite. The composition of the electrolyte (and hence its properties) and the electric field applied between the electrodes are crucial in deciding the morphology of the evolved structure. The anodic porous film formation has been conventionally viewed as a result of the interplay between the electric field assisted oxidation of the metal, electric field assisted dissolution of the oxide and chemical dissolution of the oxide.[ Reference Hoar and Mott 24 , Reference O'Sullivan and Wood 25 ] Various theoretical models were formulated in line with this view.[ Reference Lee and Park 26 ] According to the conventional model, which is generally known by the label ‘field-assisted dissolution model’, the oxygen ions (O2−) from dissociated water in the electrolyte are responsible for the metal oxidation [see Fig. 2(a)].[ Reference Parkhutik and Shershulsky 27 ]
 $${\rm 2}{\rm H}_{\rm 2}{\rm O}_{({\rm l})} \to {\rm} {\rm O}^{{\rm 2} -} ({\rm ox}){\rm} + {\rm O}{\rm H}^ - ({\rm ox}){\rm} + {\rm 3}{\rm H}^ + ({\rm aq}).$$
The dissociation takes place at the oxide–electrolyte interface. These oxygen and hydroxyl ions migrate through initially formed oxide layer and carry out oxidation at the metal–oxide interface. The reciprocating action comes from metal ions (for example, Al3+ for aluminum) that migrate out toward the oxide–electrolyte interface, so that the charge neutrality is maintained.
 $${\rm Al} \to {\rm A}{\rm l}^{{\rm 3} +} + {\rm 3}{\rm e}^ -. $$
These cations get oxidized and dissolved in the electrolyte.
 $${\rm A}{\rm l}^{{\rm 3} +} ({\rm ox}) \to {\rm A}{\rm l}^{{\rm 3} +} ({\rm aq}).$$
Simple chemical dissolution of the oxide may also take place. The defects or surface irregularities on the oxide layer initially formed leads to pitting in the initial oxide layer due to chemical dissolution. The enhanced field due to reduced oxide thickness in the pits makes the oxidation and dissolution go faster at the pore bottom and as a result the pore bottom advances into the metal interior, while the side walls where the field is low stay intact. At equilibrium the rate of oxidation at the metal–oxide interface and the rate of oxide dissolution at the pore bottom proceed at the same rate.
A two-electrode anodization setup for fabricating the nanotube architecture.

(a) The processes involved in the porous oxide growth as per the dissolution model: (A) oxide dissolution by proton-assisted electric field enhanced mechanism; (B) movement of oxygen ions and aluminum ions through barrier oxide by the field-stimulated mechanism; (C) oxide growth at both internal and external oxide interfaces as a result of ionic species movement. (b) The stress-assisted material flow model.

A model that has recently received significant attention is the ‘flow model’. Although the stress induced movement of material in the oxide layer has long been considered as a process during anodization, recently Skeldon et al. brought more evidences for this mechanism using their tungsten tracer study.[ Reference Skeldon, Thompson, Garcia-Vargara, Iglesias-Rubianes and Blanco-Pinzon 28 , Reference Garcia-Vergara, Skeldon, Thompson and Habazaki 29 ] According to this model, pore formation occurs as a consequence of flow of material in the oxide layer (called barrier layer) under the porous layer toward the wall regions due to the growth stresses and field-assisted plasticity of the film material [Fig. 2(b)]. Later, Houser and Hebert gave theoretical support for this model by considering the oxide as a Newtonian fluid.[ Reference Houser and Hebert 30 ] They suggested a combination of ionic migration in the oxide and stress-driven diffusion of metal atoms as responsible for the development of ordered pores in anodic alumina.
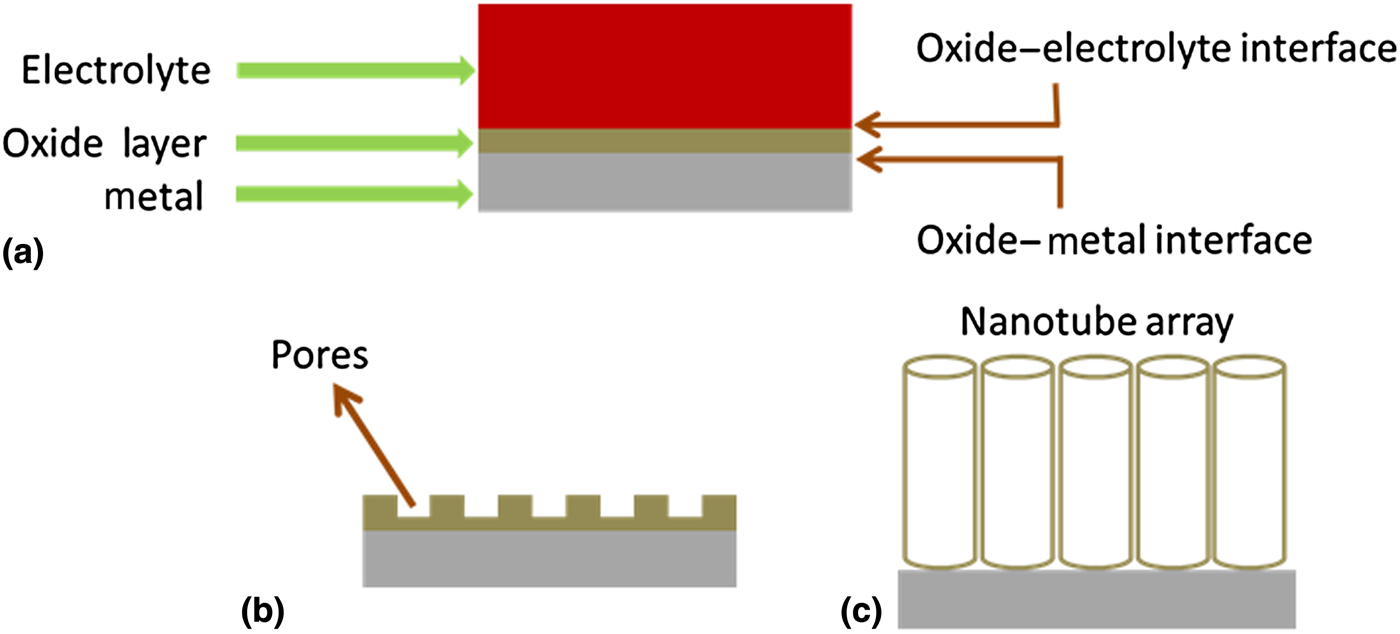
A schematic diagram illustrating the nanotube array formation is given in Fig. 3. The attempts to use anodic oxidation for the growing high surface area ordered nanoporous structures apparently led to the development of nanotubes and other nanoarchitectures of various kinds at the early stages of anodic nanostructure research. Both the electric field-assisted dissolution model and the flow model are not fully capable of explaining the formation of nanotubes and other nanoarchitectures. It is likely that both the processes are involved in the porous structure and nanotube formation. The factor that makes the nanotube array different from an ordered porous architecture is the well-defined and separated wall structure of nanotubes. While the mechanism of nanotube pore formation and growth can be believed to be similar to that of porous structure growth, the separation of the walls is a distinct and scientifically fascinating phenomenon that has not yet been clearly understood. Pu et al. assumed that during anodic growth of porous alumina, defects such as voids and cracks formed at the cell (single pore with walls) boundaries and at the junctions of three neighboring cells provide easy paths for film cleavage and detachment of cells, which facilitate alumina nanotube formation.[ Reference Pu, Bao, Zou and Feng 31 ] Based on the electric field-assisted dissolution model, Mor et al. proposed the first empirical model for the growth of titania nanotube architecture in aqueous hydrofluoric acid (HF) electrolyte.[ Reference Mor, Varghese, Paulose, Mukherjee and Grimes 32 ] They studied morphology change with duration of anodization and hypothesized that the pore formation by pitting of an initially formed oxide layer occurs first, which is followed by pore separation due to the charge build up in the inter-pore region and associated field-assisted oxidation and dissolution. Since then various models have been proposed to explain the formation of nanotube structure by taking anodic titania nanotube array as a model system.[ Reference Regonini, Bowen, Jaroenworaluck and Stevens 33 ] Based on transmission electron microscope (TEM) studies Su and Zhou concluded that titanium oxide hydroxide formation occurs at the oxide–metal interface and inter-pore regions and the dehydration of the hydroxide phase at the inter-pore region gives rise to the nanotube geometry.[ Reference Su and Zhou 34 ] Recently, Berger et al. proposed a model based on variation of the composition across the nanotubes studied using Auger Electron Spectroscopy.[ Reference Berger, Albu, Schmidt-Stein, Hildebrand, Schmuki, Hammond, Paul and Reichlmaier 35 ] Based on their observation of a fluorine-rich layer at the nanotube–nanotube interface regions, they hypothesized that plastic flow of a fluoride-rich layer formed at the bottom of the porous layer toward the outer regions of pore walls and their eventual dissolution into the electrolyte lead to the pore separation and nanotube formation. While the mechanism of oxide pore growth and wall separation appears to be the same for many metals in various electrolytes, a recent work by Katwal et al. illustrated that some metals and anodization conditions could provide alternate routes for oxide nanotube formation, although the nanotube geometry was different from conventional nanotube arrays.[ Reference Katwal, Paulose, Rusakova, Martinez and Varghese 36 ] A comprehensive model for nanotube growth is yet to be developed.
A general scheme depicting the three basic processes involved in anodic nanotube array growth: (a) oxide layer formation, (b) pore formation, and (c) pore separation and nanotube growth.
Self-organized binary metal oxide nanotubes and applications
Aluminum oxide
Aluminum oxide (alumina; Al2O3) is a versatile material due to its abundance in nature, thermal and chemical stability, high melting point, hardness and stiffness, very poor thermal and electrical conductivities, and dielectric properties. It is used for a wide range of applications. For example, it is used for wear resistant coatings on cutting tools, as grinding medium, as a component in materials such as glass and cement, for fabricating seals and washers, for electrical/thermal insulation in high-temperature furnaces, as a corrosion-resistant material and as a catalyst support. It is known as a low loss high-quality factor dielectric material at microwave frequencies. Alumina films are used as gate dielectric in electronic devices. Because of the ability to adsorb water molecules reversibly at room temperature, porous alumina films, and sintered bodies are widely explored for their capacitive/resistive humidity-sensing characteristics.
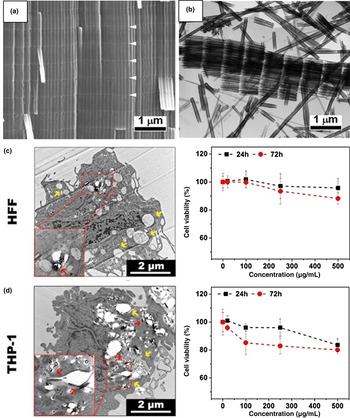
The work of Masuda and Fukuda in creating highly ordered nanoporous alumina films made more than a century-old anodization a very popular technique beyond the realm of electrochemistry.[ Reference Masuda and Fukuda 23 ] Ordered porous alumina became the primary choice as a template material. It had been extensively used as a template for the growth of nanowires, nanorods, nanodots, and nanotubes as well as nanotube/nanowire arrays of various other functional oxides, non-oxides, and multinary compounds even before the technique started yielding alumina nanotubes. Pu et al. first developed alumina nanotubes from aluminum-coated silicon substrates anodized in dilute sulfuric acid (15 wt%) at 10 °C by applying 40 V between the electrodes.[ Reference Pu, Bao, Zou and Feng 31 , Reference Zou, Pu, Bao and Feng 37 ] Later, Lee et al. used pulse anodization combining both mild and hard anodization processes and fabricated highly ordered alumina nanotube arrays on aluminum substrates.[ Reference Lee, Scholz and Gosele 38 ] The anodization was performed in 0.3 m sulfuric acid under galvanostatic conditions. A high-current (368.42 mA/cm2) and a low-current (3.16 mA/cm2) pulse was alternately applied to obtain respectively the hard and mild anodization conditions. Hard anodization was considered primarily responsible for the nanotube formation. Each nanotube was formed in segments [see Fig. 4(a)] and the pulse width during hard anodization (varied from 2 to 6 s) determined the length of these segments. They obtained discrete nanotube segments by detaching the nanotube array film weakly attached to the aluminum substrate using a mixture of 0.2 m CuCl2 and 6.1 m HCl [Fig. 4(b)]. Recently, Wang et al. modified the process slightly and obtained very short individual nanotubes (length 485 ± 180 nm and diameter 90 ± 10 nm).[ Reference Wang, Santos, Evdokiou and Losic 39 ] They performed anodization first in 0.3 m H2SO4 in potentiostatic mode at 25 V at 6 °C to obtain a thick oxide layer and then did a short-time pulsed anodization in galvanostatic mode in 0.3 m H2SO4 with 10% ethanol at 1 °C.
(a) SEM and (b) TEM images of the anodic alumina nanotubes grown by pulse anodization at a pulse duration of 2 s. The white arrows in (a) show the interfaces of nanotube segments, the length of which is determined by pulse duration. Reprinted with permission from.[ Reference Lee, Scholz and Gosele 38 ] Copyright (2008) American Chemical Society. The cell viability and uptake characteristics after the treatment of the nanotubes in HFF and THP-1 cell lines are given in (c) and (d), respectively. The yellow arrows indicate the formulation of autophagsome evidencing autophagy induction and the red arrows show the nanotubes localized in the autophagosome structure. Reprinted with permission from.[ Reference Wang, Kaur, Chen, Santos, Losic and Evdokiou 40 ] Copyright (2015) American Chemical Society.

While nanoporous alumina films (without the walls separated) fabricated using the same procedure were investigated for their photonic properties,[ Reference Law, Santos, Nemati and Losic 41 ] the alumina nanotubes were used primarily for drug delivery and cancer treatment due to its bio compatibility and non-toxicity. For example, Wang et al. developed an alumina nanotube-based drug delivery system for cancer therapy.[ Reference Wang, Kaur, Chen, Santos, Losic and Evdokiou 40 ] They found that the cell viability was relatively unaffected by alumina nanotubes at a dose of 100 µg/mL after 72 h treatment in human fibroblast cells (HFF) and human monocyte cells (THP-1) proving the fact that the material was non-toxic at this dose. The material could activate autophagy in various cell types including human breast cancer cells. Figures 4(c) and 4(d) show the % of cell viability versus concertation of Al2O3 nanotubes. The team used these nanotubes as drug carriers to load thapsigargin, an endoplasmic reticulum stress inducer, and co-treated the cells with an autophagy inhibitor 3 methyladenine for enhanced killing of breast cancer cells in vitro. Although a few such reports about the study of alumina nanotube properties for use in medical field could be seen in the literature, the potential of the material has so far been largely unexploited for other applications such as electronic devices where aluminum oxide already affixed footprints.
Titanium dioxide
Titanium dioxide (titania) is one of the very few metal oxides associated with everyday life of common people. It is used as an additive in food, pigments, paints, cosmetics, sunscreen, etc. Nevertheless, it is widely known for strong photocatalytic properties useful for destroying microorganisms such as bacteria and for self-cleaning and solar fuel generation applications. As a semiconductor it finds use in hybrid solar cells and chemical sensing. The biocompatibility of titania makes it attractive for biomedical applications such as drug delivery. Although a variety of techniques have been developed to grow nanostructures of TiO2, not many have received as much attention as anodic oxidation. This is evident from the fact that several hundreds of articles are being published every year on anodically grown TiO2. One of the main reasons for the wide-spread interest in anodization is its ability to yield titania nanotube arrays of tunable dimensions that has been found useful for a number of applications.
Dense and porous films of titanium oxide were fabricated and studied extensively in both academia and industry for various applications over several decades in the 20th century. In 1984, Assefpour-Dezfuly et al. while studying the effects of surface treatments on the anodic oxide morphology noticed tubular structures in titanium anodized in an aqueous electrolyte containing chromic acid and ammonium fluoride (NH4F).[ Reference Assefpour-Dezfuly, Vlachos and Andrews 42 ] About one and a half decade later, Zwilling et al. also reproduced similar structures when anodization of titanium and its alloys was performed in chromic acid, but by replacing NH4F with HF.[ Reference Zwilling, Darque-Ceretti, Boutry-Forveille, David, Perrin and Aucouturier 43 ] In 2001, Gong et al, demonstrated that well-defined titania nanotubes with tunable dimensions could be fabricated using only water and small quantities of HF.[ Reference Gong, Grimes, Varghese, Hu, Singh, Chen and Dickey 44 ] The material received considerable attention soon after the structural properties and device performance were revealed.[ Reference Varghese, Gong, Paulose, Ong and Grimes 45 , Reference Varghese, Gong, Paulose, Grimes and Dickey 46 ] A number of electrolytes, including fluorine free electrolytes, and fabrication conditions, were discovered for obtaining these nanotubes in different sizes and morphologies.[ Reference Beranek, Hildebrand and Schmuki 47 – Reference Rani, Roy, Paulose, Varghese, Mor, Kim, Yoriya, LaTempa and Grimes 49 ] The length of these first generation nanotubes grown in HF containing aqueous medium was limited to around 500 nm nanometers and hence, the applications were also limited.[ Reference Gong, Grimes, Varghese, Hu, Singh, Chen and Dickey 44 , Reference Beranek, Hildebrand and Schmuki 47 ] The breakthrough came in 2004 from two parallel efforts. Cai et al. demonstrated that by controlling pH of the electrolyte, the nanotube length could be increased to several microns.[ Reference Cai, Paulose, Varghese and Grimes 50 ] The length increased with increase in electrolyte pH and reached about 6 µm at pH = 5.[ Reference Paulose, Varghese, Shankar, Mor and Grimes 51 ] At the same time, Macak et al. replaced HF with NaF and used with (NH4)2SO4 to obtain nanotubes of length up to 2.4 µm.[ Reference Macak, Sirotna and Schmuki 52 ] Although the scope of application widened with the development of these micron-length second generation nanotubes, the applications were still limited due to restricted length and hence, surface area and robustness. For example, length of these second-generation nanotubes was inadequate for their use in highly efficient dye-sensitized solar cells that require lengths >10 µm for providing sufficient dye-covered area for light absorption.[ Reference Paulose, Shankar, Varghese, Mor and Grimes 53 ]
In 2005, Ruan et al. introduced fluorine containing organic electrolytes for nanotube fabrication and demonstrated that μm-length nanotubes could be fabricated without water added to the electrolyte.[ Reference Ruan, Paulose, Varghese, Mor and Grimes 54 ] They used an ethanol–dimethyl sulfoxide (DMSO)–HF electrolyte and obtained nanotubes of length about 2.3 µm. This was another turning point in the anodic titania nanotube research. Later, Macak et al. grew nanotubes of length up to 7 µm using 0.5 wt% HF in glycerol.[ Reference Macak, Tsuchiya, Taveira, Aldabergerova and Schmuki 55 ] Nevertheless, the ultimate breakthrough occurred in 2006 when Paulose et al. showed that nanotube of almost any length and a wide range of diameters could be fabricated using organic electrolytes such as ethylene glycol (EG), formamide, DMSO, etc. containing fluorine and small amounts of water.[ Reference Paulose, Prakasam, Varghese, Peng, Popat, Mor, Desai and Grimes 19 , Reference Paulose, Shankar, Yoriya, Prakasam, Varghese, Mor, Latempa, Fitzgerald and Grimes 56 , Reference Prakasam, Shankar, Paulose, Varghese and Grimes 57 ] These third-generation nanotubes maximized the potential of the nanotubes for real-world applications. Figure 5 shows the scanning electron microscope (SEM) images of the nanotubes in three generations. Soon self-standing nanotube array membranes of various shapes emerged and these were found useful for medical applications.[ Reference Paulose, Prakasam, Varghese, Peng, Popat, Mor, Desai and Grimes 19 ]
SEM images of three generations of titania nanotube arrays. The lateral and top views are respectively given on the left and right. (a) A first-generation nanotube array film of length ~200 nm prepared in an aqueous electrolyte containing 0.5% HF. (b) A second-generation nanotube of length ~6 µm prepared by maintaining the pH of an aqueous electrolyte containing KF at 5. (c) A third-generation nanotube of length ~40 µm grown in an EG electrolyte containing 0.3 wt% NH4F and 2 vol% water. The images in (c) are adapted with permission from.[ Reference Paulose, Varghese, Shankar, Mor and Grimes 51 ] Copyright (2005) Cambridge University Press.

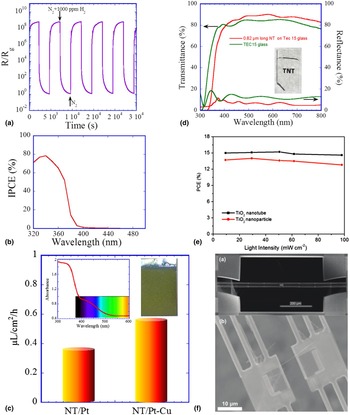
The potential of the anodically formed functional oxide nanotube architecture for practical applications was first revealed in 2002, when Varghese et al. presented their work on hydrogen-sensing characteristics of titania nanotube arrays in the Ninth International Meeting on Chemical Sensors in Boston.[ Reference Varghese, Gong, Paulose, Ong and Grimes 45 , Reference Varghese, Gong, Paulose, Ong, Dickey and Grimes 58 ] The titania nanotubes fabricated having length 200–400 nm and pore diameter from 22 to 76 nm and wall thickness 13–27 nm were studied for their chemiresistive response to parts per million (ppm) level hydrogen at 290 °C.[ Reference Varghese, Gong, Paulose, Ong and Grimes 45 ] The nanotubes of length 200 nm and pore diameter 22 nm showed an exceptional performance of four orders of change in the magnitude of resistance for 1000 ppm hydrogen in nitrogen. Furthermore, these nanotube-based sensors were found to have strong ability to remove organic contaminants from the surface upon UV irradiation.[ Reference Mor, Varghese, Paulose and Grimes 59 ] The development of second- and third-generation nanotubes as discussed above later led to the development of ultrahigh sensitivity hydrogen sensors and clinical devices for monitoring blood hydrogen for disease diagnosis.[ Reference Paulose, Varghese, Mor, Grimes and Ong 14 , Reference Varghese, Yang, Kendig, Paulose, Zeng, Palmer, Ong and Grimes 60 ] The sensors fabricated using nanotubes of length ~1 µm, pore diameter 30 nm and wall thickness 13 nm heat treated at 480 °C exhibited remarkable response of more than eight order change in magnitude in the resistance/conductance upon exposure to 1000 ppm H2 at room temperature [see Fig. 6(a)]. The material was also found to be selective to hydrogen without any foreign catalysts. Such an unprecedented environmental sensing characteristic was attributed to the enhanced surface area, nanoscale wall thickness less than the Debye length, and inter-tubular connecting points.
(a) The chemiresistive response of a titania nanotube array (~1 µm long) film when the ambient was switched between N2 and 1000 ppm H2 in N2 at room temperature. (b) The external quantum efficiency of a titania nanotube array photoanode (measured in 0.5 m KOH solution). (c) The concentrations of methane generated from CO2 and water vapor using a nitrogen-doped titania nanotube array photocatalyst using sunlight. The inset shows the photograph of a nitrogen-doped nanotube sample and the absorbance spectrum. NT/Pt and NT/Pt–Cu represent respectively nanotubes loaded with platinum and copper + platinum co-catalysts. The figure is adapted with permission from.[ Reference Varghese, Paulose, LaTempa and Grimes 16 ] Copyright (2009) The American Chemical Society. (d) The UV–vis spectra of a TEC15 glass and TiO2 nanotube array (0.8 µm long) coated TEC15. The antireflection property of the nanotube array film is evident. The photograph of the nanotube sample is in the inset. The figure is adapted with permission from.[ Reference Varghese, Paulose and Grimes 15 ] Copyright (2009) Nature Publishing Group. (e) The effect of different light intensities on the efficiencies of perovskite solar cells based on titania nanotube arrays and nanoparticle films. The figure is adapted with permission from.[ Reference Qin, Paulose, Ibrahim Dar, Moehl, Arora, Gao, Varghese, Gratzel and Nazeeruddin 61 ] Copyright (2015) Wiley–VCH Verlag GmbH & Co. (f) The SEM image of a suspended micro-device used for studying the thermal, electrical, and structural properties of individual nanotubes. The figure is adapted with permission from.[ Reference Brahmi, Katwal, Khodadadi, Chen, Paulose, Varghese and Mavrokefalos 62 ] Copyright (2015) The Royal Society of Chemistry.

The self-cleaning properties of the titania nanotube array-based hydrogen sensors, in fact, revealed that the material possessed exceptional photocatalytic properties.[ Reference Mor, Carvalho, Varghese, Pishko and Grimes 63 ] The driving factors are the high surface area for light absorption and surface reactions and nanoscale wall thickness that facilitate minority carriers (holes) to reach the surface before getting recombined with electrons. Numerous reports have been published on the photocatalytic properties of titania nanotubes, many of them on efficient photocatalytic cleaning of the organic contaminants such as methyl orange. Nonetheless, the real potential of the material for aiding a sustainable future was revealed when the material showed promising characteristics for solar fuel generation. For example, the work performed using the first- and second-generation nanotubes showed that the titania nanotubes could generate hydrogen from water at high efficiencies under UV irradiation.[ Reference Mor, Shankar, Paulose, Varghese and Grimes 64 , Reference Varghese, Paulose, Shankar, Mor and Grimes 65 ] A remarkable feature is the high quantum efficiency offered by the titania nanotube arrays in the above-band gap energy (short wavelength) region. As shown in Fig. 6(b) the external quantum efficiency (measured in 0.5 m KOH electrolyte without electric bias) in the UV region is about 80%, indicating clearly the role of nanosize walls in facilitating facile pathways for charge transfer to the surface.[ Reference Shankar, Basham, Allam, Varghese, Mor, Feng, Paulose, Seabold, Choi and Grimes 66 , Reference Varghese and Grimes 67 ] Nevertheless, the nanotubes do not show any activity under visible light irradiation as the band gap is 3.0–3.2 eV (absorption edge ~390–410 nm). As a result the efficiency of the sunlight-driven hydrogen generation by nanotubes was limited to about 0.6%.[ Reference Varghese and Grimes 67 , Reference Paulose, Mor, Varghese, Shankar and Grimes 68 ] In a recent work, Liu et al. fabricated ‘black TiO2 nanotubes’ by reducing the lattice by implanting hydrogen ions and generated hydrogen using visible light without applying an electric bias and with no co-catalyst. The amount of hydrogen generated was, however, low (~16 µL/cm2/h).[ Reference Liu, Haublein, Zhou, Venkatesan, Hartmann, Mackovic, Nakajima, Spiecker, Osvet, Frey and Schmuki 69 ]
The nanotube arrays were also reported to be superior compared with other nanostructures in generating hydrocarbon fuels by recycling carbon dioxide. Varghese et al. demonstrated that under sunlight the nanotubes could convert carbon dioxide and water vapor to hydrocarbon fuels at a rate nearly 20 times greater than the previously reported conversion rates [Fig. 6(c)].[ Reference Varghese, Paulose, LaTempa and Grimes 16 ] They incorporated nitrogen in nanotubes while performing anodization and shifted the absorption edge from ~400 to 540 nm [Fig. 6(c) inset]. Platinum or copper or both were loaded on the nanotube surface to assist the carbon dioxide reduction process.
Development of transparent films of nanotube arrays on transparent substrates such as glass was a major technological advancement in the anodic titania nanotube research that facilitated the material's entry into applications such as photovoltaics.[ Reference Varghese, Paulose and Grimes 15 , Reference Mor, Varghese, Paulose and Grimes 70 ] Mor et al. first deposited film of titanium on conducting glass by radio frequency sputtering followed by anodization in aqueous HF electrolyte till the metal layer was consumed and became partially transparent due to the remaining metal film. They finally heat treated in oxygen at 400 °C to form transparent films.[ Reference Mor, Varghese, Paulose and Grimes 70 ] As mentioned earlier, these films comprised first-generation nanotubes had limited applications due to the length restrictions. In a later work, the high optical quality nanotubes of length tens of microns were developed through the deposition of similar thickness titanium films using a specially designed sputtering and anodization processes.[ Reference Varghese, Paulose and Grimes 15 ] The nanotube film enhanced the transmittance of the conducting glass substrate and behaved as an anti-reflection coating [see Fig. 6(d)]. The dye-sensitized solar cells fabricated by replacing the electron transport film consisting of random network of titania nanoparticles with titania nanotube arrays exhibited high quantum efficiency in almost the entire light absorption region of the N719 dye used in the cell. In the standard configuration, such a behavior is obtained by using a layer of light-scattering particles at the top of nanoparticle film. Very recently, highly stable, and efficient organic–inorganic hybrid perovskite solar cells were developed using these nanotubes.[ Reference Qin, Paulose, Ibrahim Dar, Moehl, Arora, Gao, Varghese, Gratzel and Nazeeruddin 61 ] Long stability tests revealed that the degradation of the unsealed nanotube array cells was less than that in well-sealed nanoparticle-based cells. The cup-like geometry of the nanotubes served as envelope around the perovskite absorber material and protected it from external influences such as humidity. Figure 6(e) shows the light intensity dependence of efficiencies of these cells.
Titania nanotubes were proven highly useful for a wide range of other applications also. For example, in 2008 Liu et al. reported on anodic TiO2 nanotube arrays annealed in N2 for efficient lithium ion intercalation.[ Reference Liu, Xiao, Zhang, Garcia, Zhang, Guo, Champion and Cao 71 ] They fabricated TiO2 nanotubes using electrolyte consisting of 0.1 m KF and 1.0 m NaHSO4 at constant 20 V for 1 h and the samples were annealed in dry N2 atmosphere at 300, 400, and 500 °C for 3 h. The samples annealed at 300 and 400 °C respectively showed high initial discharge capacity of 240 mA-h/g and an excellent cyclic stability. There is tremendous interest in using titania nanotubes for biomedical applications. Studies showed that these nanotubes could be used in bone implants.[ Reference Brammer, Frandsen and Jin 72 , Reference Popat, Leoni, Grimes and Desai 73 ] Recent investigations identified titania nanotubes as a highly promising material for phosphopeptide enrichment in biologic studies.[ Reference Wijeratne, Wijesundera, Paulose, Ahiabu, Chu, Varghese and Greis 74 ]
While most of the work on titania nanotubes were done in film (array) form, recently the thermoelectric properties of the individual nanotubes were studied using a specially designed suspended micro-device[ Reference Brahmi, Katwal, Khodadadi, Chen, Paulose, Varghese and Mavrokefalos 62 ] [Fig. 6(f)]. The actual thermal conductivity of single nanotubes was observed to be only half of the thermal conductivity of the nanotube array films and almost sixfold lower than that of bulk TiO2.
Zirconium oxide
Zirconium oxide (Zirconia; ZrO2) is a heavily used industrial ceramic material. Due to its high melting temperature, high refractive index, chemical inertness, high ionic conductivity, low thermal conductivity, and high-temperature stability, it is used for many applications, including bio-implantation, gas sensors, catalysis, high-temperature equipment fabrication, fuel cell membranes, jewelry, and fabrication of columns for high-performance liquid chromatography, etc. It possesses the most useful mechanical properties among oxide ceramics. Biomedical grade zirconia was developed in 1990s, to solve the problems of alumina brittleness.[ Reference Chevalier and Gremillard 75 ]
Initial efforts to anodize zirconium in similar aqueous fluoride electrolytes used for tiania nanotube fabrication led to the growth of porous structures.[ Reference Tsuchiya and Schmuki 76 ] Distinct zirconia nanotubes were first fabricated by Lee and Smyrl using the same simple electrolyte (0.5 wt% HF in water) used by Gong et al. for titania nanotube development.[ Reference Lee and Smyrl 77 ] In contrast to the case of titania nanotubes, they obtained zirconia nanotubes of length 10 µm in 10 min. Tsuchiya et al later optimized the anodization conditions and grew nanotubes in 1 m (NH4)2SO4 electrolyte containing 0.5 wt% NH4F.[ Reference Tsuchiya, Macak, Taveira and Schmuki 78 ] Since then, studies have been performed on ZrO2 nanotubes for photocatalytic degradation of dyes, bio-medical implantation, hydrophobic and hydrophilic surface coatings, etc. For example, Jiang et al. studied the photocatalytic degradation of methyl orange solution using anodic ZrO2 nanotubes fabricated using 1 m (NH4)2SO4 and 0.25 m NH4F electrolyte at 20 V for 120 min and annealed at 300 °C [see Fig. 7(a) for SEM images].[ Reference Jiang, He, Zhong, Lu, Yuan and Liang 79 ] They demonstrated that the heat treated ZrO2 nanotubes could exhibit similar level of photocatalytic performance as TiO2 nanotubes [Fig. 7(b)]. Their zirconia nanotube photocatalyst was stable upon repeated cycling of the environment.
(a) The SEM images of anodically grown ZrO2 nanotubes. (b) Photocatalytic activity of zirconia nanotubes in comparison with the activities of other nanomaterials in degrading methyl orange. Reprinted with permission from.[ Reference Jiang, He, Zhong, Lu, Yuan and Liang 79 ] Copyright (2014) Elsevier B. V.

Niobium pentoxide
Niobium pentoxide (niobia; Nb2O5) is a relatively abundant wide band gap (~3.4 eV) material useful either as an n-type semiconductor as or as a dielectric medium. Stoichiometric Nb2O5 is useful as a dielectric medium in electrolytic capacitors. As a semiconductor it finds use in gas sensors, dye sensitized solar cells, catalysis and photocatalysis, electrochromic devices, and lithium ion batteries. Its physical properties can be manipulated by tuning the stoichiometry.[ Reference Nico, Monteiro and Graca 80 ]
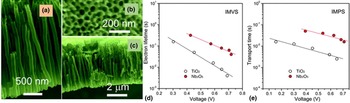
Anodization of niobium in aqueous H2SO4/HF[ Reference Sieber, Hildebrand, Friedrich and Schmuki 81 ] or HF/H3PO4 [ Reference Choi, Lim, Lee, Chang, Kim and Cho 82 ] electrolytes yielded only porous structures. In 2012, Wei et al. first reported the fabrication of self-organized and high aspect ratio of Nb2O5 nanotubes using glycerol electrolyte containing 0.4 m NH4F at constant voltage of 20 V for 2 h.[ Reference Wei, Lee, Shaw and Schmuki 83 ] They observed that the composition of the electrolyte was critical in forming the nanotubes and addition of water or NH4F concentrations higher or lower than the optimum level could destroy the nanotube geometry. Galstyan et al. fabricated well-defined niobia nanotubes using NH4F–H2O electrolyte containing EG and glycerol [Figs. 8(a)–8(c)].[ Reference Galstyan, Comini, Faglia and Sberveglieri 84 ] They found that the crystallization of niobium oxide nanotubes occur at 400 °C. Recently, Liu et al. used these nanotubes as electron transport and dye support layer in dye-sensitized solar cells.[ Reference Liu, Yuan, Liu, Zhu, Lin and Chen 85 ] They anodized niobium foil in 0.74 g NH4F–0.5 H2O–50 mL glycerol electrolyte at 90 V until the foil was completely consumed. The powder was collected from the electrolyte by centrifugation and annealed at 550 °C for 4 h. The powder was mixed with a terpineol–isopropanol–n-butyl alcohol solution to make a viscous paste and then coated onto conducting glass and heat treated so as to form photoanode of the solar cell. An enhanced V oc was observed for Nb2O5 nanotubes compared with TiO2 particles. The electron lifetime and transport time were significantly higher in Nb2O5 compared with TiO2 particles [Figs. 8(d) and 8(e)]. Nonetheless, a reduced efficiency was obtained for Nb2O5 nanotubes due to lower amount of dye loading.
(a) and (c) The cross-sectional and (b) surface views of a surface of niobium oxide nanotube array film. Reprinted with permission from.[ Reference Galstyan, Comini, Faglia and Sberveglieri 84 ] Copyright (2014) The Royal Society of Chemistry. (d) The electron lifetime and (e) transport time in a niobium pentoxide nanotube array film and a titania nanoparticle film used in DSSCs. Reprinted with permission from.[ Reference Liu, Yuan, Liu, Zhu, Lin and Chen 85 ] Copyright (2016) The Royal Society of Chemistry.

Hafnium oxide
Hafnium oxide (hafnia; HfO2) is a high melting point high bulk modulus dielectric material. Its dielectric properties are widely investigated for using it as a gate dielectric in place of or in combination with SiO2 in electronic devices such as field effect transistors (FET). It has a wide band gap of ~5.7 eV and hence it is an insulator. It is also known for optical properties. It is a hard, transparent, high refractive index material that can be used for optical coatings from near UV to mid-infrared (IR) range. The index of refraction can be in the range of 2.0 in the visible range while it goes significantly above 2.0 in the UV region. As a result the material is used in applications such as abrasion-resistant dielectric mirror development.
Anodization of hafnium has long been used to fabricate dense HfO2. In 2005, Tsuchiya and Schmuki reported the fabrication of porous films of HfO2 using 1 m H2SO4 + 0.2 wt% NaF electrolyte at constant voltages ranging from 10 to 60 V in a three electrode geometry.[ Reference Tsuchiya and Schmuki 86 ] In 2009, the same group fabricated HfO2 nanotubes using glycerol +0.35 m NH4F having different amounts of water.[ Reference Berger, Jakubka and Schmuki 87 ] While low water concentration produced only nanoporous structure, concentrations ranging from 10% to 20% yielded nanotubes. Qiu et al. prepared the nanotubes in EG–NH4F electrolyte and found that water to EG ratio should be 2:8 to obtain control over nanotube morphology.[ Reference Qiu, Howe, Cardoso, Polat, Heller and Paranthaman 88 ] The diameter was strongly correlated with anodization voltage. The fabricated nanotubes were hexagonal and had root-like structures at the tube bottom as shown in Fig. 9. They proposed a gas bubble-based nanotube growth mechanism. The team later studied the dielectric properties of as-prepared amorphous nanotubes and those heat treated at 500 °C in argon ambient and found that there was no significant difference in the properties except that the loss tangent was higher for heat-treated samples at intermediate frequency range (kHz region), possibly due to the lattice reduction by argon.[ Reference Qiu, Howe, Meyer, Tuncer and Paranthaman 89 ] The permittivity was estimated to be 18.0 and 17.2 respectively for amorphous and crystalline samples, which were not significantly different from the values reported for HfO2.
SEM images of (a) the top surface and (b) the root-like structure at the bottom of an HfO2 nanotube array film. TEM images of the nanotubes (b) and root-like structure [(d) and (e)] are also shown. Reprinted with permission from.[ Reference Qiu, Howe, Cardoso, Polat, Heller and Paranthaman 88 ] Copyright (2009) IOP Publishing Ltd.

Copper (II) oxide
Copper (II) oxide (CuO) or cupric oxide is an abundant low cost p-type semiconductor that has a bulk band gap of ~1.4 eV. It is one of the first materials in which photosensitivity was observed and since then it has been a favorite material for photovoltaics due to its optimum band gap and abundance. It is used for a number of other applications, including photodetectors, gas sensors, lithium ion batteries, super capacitors, superconductivity at high temperature, and photocatalysis. One-dimensional nanostructures of CuO find substantial demand owing to the application range. Nevertheless, growing nananotubes of CuO by anodization is challenging due partly to the high migration rate of copper ions through oxide under electrochemical conditions compared with the case of valve metals such as aluminum and their affinity to electrolyte species such as OH−. As a result, the efforts to grow nanotubes resulted in the development of copper hydroxide nanotubes, which were heat treated at 150–200 °C to obtain CuO nanotubes.
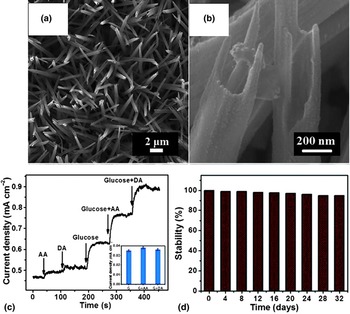
Wu et al. first reported the fabrication of Cu(OH)2 nanotubes by anodizing copper in 2.5–3.0 m KOH solution at a constant current density of 1.5 mA/cm2.[ Reference Wu, Bai, Zhang, Chen and Shi 90 ] They obtained nanotubes or nanoneedles depending upon the temperature and KOH concentration. Temperature 15–28 °C and KOH concentration 2.5–3.0 m were determined to be optimum for yielding nanotubes. Recently, Xu et al. showed that the copper oxide nanotubes obtained by the dehydration of Cu(OH)2 nanotubes could be used for bio-sensing [Figs. 10(a) and 10(b)].[ Reference Xu, Yang, Liu, Liu and Sun 91 ] They heat-treated Cu(OH)2 nanotube arrays on Cu foil at 200 °C for 3 h in nitrogen atmosphere and obtained CuO nanotubes. These nanotubes were used for glucose sensing in the amperometric mode. The experiment was performed at 0.32 V using 1.0 m NaOH alkaline electrolyte. An enhanced sensitivity of 1.89 mA/mm/cm2 with a detection limit up to 0.1 µm was observed for CuO nanotubes compared with CuO nanorods, presumably due to its larger surface area and faster biomolecule diffusion. Moreover, the bio-sensor devices that exhibited excellent stability, good selectivity, and high reproducibility for the detection of glucose were successfully applied to detect glucose levels in human plasma samples. Figures 10(c) and 10(d) show respectively glucose-sensing behavior of anodic CuO nanotube and their stability with time.
(a) and (b) SEM images of CuO nanotubes. (c) Amperometric responses of CuO nanotube array electrode in 1.0 m NaOH at 0.32 V with successive addition of 0.002 mm ascorbic acid (AA) and dopamine (DA), 0.1 mm glucose, the mixture of glucose and AA, the mixture of glucose and DA. (d) Long-term stability of CuO NTs arrays electrode at room temperature. Reprinted with permission from.[ Reference Xu, Yang, Liu, Liu and Sun 91 ] Copyright (2014) The Royal Society of Chemistry.

Iron oxide
Iron (III) oxide or ferric oxide (hematite) is one of the most explored phases of iron oxide. It is attractive because of its abundance, ease in fabrication, and economic viability. Iron oxide is widely studied for bio-medical applications such as drug delivery, bio-sensors, magnetic resonance imaging, and magnetic hyperthermia. Most importantly α-Fe2O3 is an n-type semiconductor with a band gap of 2.2 eV. Its band gap is optimum for solar fuel generation processes such as water photoelectrolysis for hydrogen production. A drawback is the poor electron mobility (0.01–0.1 cm2/V/s) and short diffusion length (2–4 nm) in this material. One of the strategies explored to circumvent this problem is to use nanotubes of Fe2O3. If the wall thickness is made comparable with or less than the carrier diffusion length, then photogenerated charge carriers can reach the surface for surface reactions before getting recombined.
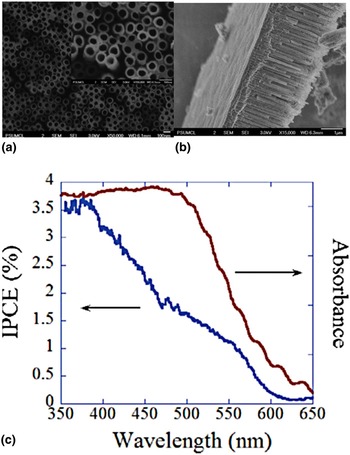
Earlier attempts to make Fe2O3 nanotubes yielded porous structures. In 2006, Prakasam et al. first reported the use of glycerol containing 1% HF, 0.5% NH4F, and 0.2% nitric acid (0.1 m) for anodizing iron at 10 °C to obtain nanoporous structures of iron oxide.[ Reference Prakasam, Varghese, Paulose, Mor and Grimes 92 ] Nevertheless, anodic iron oxide nanotubes were first reported by Rangaraju et al.[ Reference Rangaraju, Raja, Panday and Misra 93 ] They used EG containing 0.1 m NH4F and 3 vol% water and performed anodization of iron at room temperature at 50 V for Fe2O3 nanotube growth. Later, LaTempa et al. studied the effects of anodization temperature and Fe− ion concentration on the nanotube formation (SEM images are shown in Fig. 11).[ Reference LaTempa, Feng, Paulose and Grimes 94 ] The nanotube growth rate increased with temperature. At lower temperatures, F− ion concentration required for the formation of distinct nanotubes was higher. They used the nanotubes for water photoelectrolysis and observed visible light activity as evident from the incident photon-to-current conversion efficiency (IPCE) spectrum in Fig. 11(c). Although the samples responded to wavelengths up to 600 nm, the IPCE dropped drastically at wavelengths above 400 nm. The difference in the charge transfer processes in the UV and visible region was believed to be responsible for the observed characteristics. In the case of direct transition (3.0 eV), charge carrier generation is more favorable, whereas, for indirect transition (2.2 eV), the electrons are trapped at Fe2+ sites so that they do not take part in conduction. The holes from Fe4+ may not contribute to oxygen evolution because of the poor charge transfer rates at semiconductor/electrolyte interface. However, they were optimistic that reduced wall thickness, high crystallinity, and substitutional impurities such as Si4+ might enhance IPCE in the visible region. Since then, many articles have appeared on the use of the material for water splitting.[ Reference Lee, Wang, Kado, Killian and Schmuki 95 , Reference Schrebler, Ballesteros, Gómez, Grez, Córdova, Muñoz, Schrebler, Ramos-Barrado and Dalchiele 96 ]
SEM images showing the (a) top and (b) the lateral views of Fe2O3 nanotubes. (c) UV–vis absorbance and IPCE spectra of iron oxide nanotubes prepared using EG + 0.3 wt% NH4F + 3.0% water at 50 V and annealed in pure argon at 400 °C. Reprinted with permission from.[ Reference LaTempa, Feng, Paulose and Grimes 94 ] Copyright (2009) American Chemical Society.

Tantalum oxide
Tantalum pentoxide (tantala; Ta2O5) is extensively studied for electronic applications because of its high dielectric constant and refractive index, adequate dielectric breakdown strength, reasonably low leakage current, corrosion resistance, piezoelectric behavior as well as chemical and thermal stability. Ta2O5 finds applications as the dielectric medium in FET-type devices and metal–oxide–semiconductor (MOS) capacitors, surface acoustic wave filters, pyroelectric IR sensors, optoelectronic devices and x-ray intensifier screens, antireflective coatings for photovoltaic devices, and aerogels.
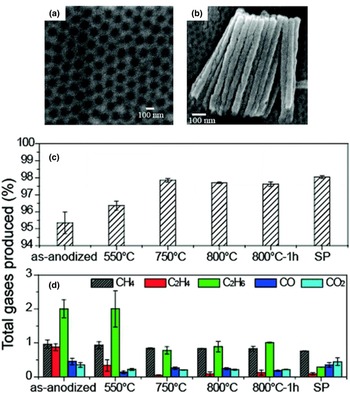
In 2005, Sieber et al. grew nonporous tantalum oxide in an aqueous electrolyte containing H2SO4 and HF.[ Reference Sieber, Kannan and Schmuki 97 ] In 2008, Allam et al. first reported the growth of tantalum oxide nanotube arrays [Figs. 12(a) and 12(b)] via one-step anodization of Ta foil.[ Reference Allam, Feng and Grimes 98 ] They used aqueous electrolytes containing HF:H2SO4 in the volumetric ratios 1:9 and 2:8 with additives such as H3PO4, EG, or DMSO at constant voltage ranging from 10 to 20 V. They observed that the nature of formed nanoarchitecture depended on the applied potential and electrolyte composition. Addition of H3PO4 yielded nanorods, while addition of 5–10 vol% EG or DMOS in the 1:9 ratio (HF:H2SO4) electrolyte produced tantala nanotube array films. For EG as additive, the nanotubes were formed only when the voltage was in the range 15–20 V. El-Sayed and Birss grew tantalum oxide nanotubes using H2SO4/HF electrolyte without any organic additive.[ Reference El-Sayed and Birss 99 ] Goncalves et al. had studied the photocatalytic hydrogen production using these tantala nanotubes.[ Reference El-Sayed and Birss 100 ] They used H2SO4 + 1 vol% HF + 4 vol% water electrolyte for anodization of Ta foils at 50 V for 3 h. The samples heat treated at 800 °C exhibited highest conversion rate of hydrogen (49 mm/cm2/h) compared with those treated at 550 or 750 °C due to enhanced crystallinity and removal of weakly bonded species. Figures 12(c) and 12(d) show the effect of annealing temperature on photocatalytic behavior of Ta2O5 nanotubes.
SEM images of (a) top and (b) lateral views of Ta2O5 nanotubes. Reprinted with permission from.[ Reference Allam, Feng and Grimes 98 ] Copyright (2008) American Chemical Society. (c) Percentage of hydrogen and (d) other gases generated under the photocatalytic activity of Ta2O5 nanotubes (heat treated at different temperatures) in ethanol–water mixture. SP denotes commercially available standard powder of Ta2O5. The nanotubes crystallized at 750 °C. Reprinted with permission from.[ Reference Goncalves, Migowski, Wender, Eberhardt, Weibel, Sonaglio, Zapata, Dupont, Feil and Teixeira 100 ] Copyright (2012) American Chemical Society.

Vanadium oxide
Oxides of vanadium exhibit different electrical and optical properties due the variable oxidation states. For example, V2O5, V3O7, and V4O9 show semiconductor behavior whereas V2O3 and V7O13 possess metallic behavior. In addition, some of the vanadium oxides undergo a reversible metal to semiconductor phase transition such as VO2 and V6O13 at 340 and 150 K, respectively. They have wide range of applications that include lithium ion batteries, gas sensors, photo and electrochromic displays, optical switches, etc. Among them, V2O5 is extensively studied in the field of energy storage devices, catalysis and gas sensors because of its high specific capacity, n-type semiconducting behavior (band gap ~2.2 eV), chemical stability and abundance.
A key challenge for the fabrication of self-organized anodicV2O5 nanotubes was the instability of vanadium oxide in any water-containing electrolytes. In 2011, Yang et al. reported the fabrication of ordered porous structures of V2O5. The structure appeared like nanotubes but not distinct [Figs. 13(a) and 13(b)].[ Reference Yang, Albu, Kim and Schmuki 101 ] They anodized vanadium in EG electrolyte consisting of 300 ppm Ti–0.2 m HF or 14 mm NaBF4–3 m H2O at a constant voltage in the range 40–300 V followed by annealing at 200 °C overnight. For the preparation of 300 ppm Ti–0.2 m HF, they dissolved Ti in HF solution first and then mixed with EG. It was believed that the complex fluoride ions such as [TiF6]2− provided by this solution or [BF4]− supplied by NaBF4 enabled the self-organization. They used annealed V2O5 nanostructure as electrode to test lithium-ion battery performance and investigated charge/discharge in a conventional electrolyte (1 m LiPF6 in a 1:1 ethylene carbonate and diethyl carbonate mixture, with Li metal as the counter and reference electrodes). A capacity of 142 mAh/g was obtained for this structure at 120 V for 2 h [Fig. 13(c)].
SEM images of (a) top and (b) lateral surfaces of a V2O5 nanotube-like structure. (c) Lithium-ion galvanostatic charge/discharge curves of the structure (anodically grown at 120 V for 1 h) at current densities about 37 mA/g. Reprinted with permission from.[ Reference Yang, Albu, Kim and Schmuki 101 ] Copyright (2011) Wiley–VCH Verlag GmbH & Co. KGaA, Weinheim.

Yang et al. later developed VO2 nanoporous/nanotube-like sturctures in a similar way.[ Reference Yang, Lee, Zobel, Mackovic, Unruh, Spiecker and Schmuki 102 ] They found that heat treatment in argon at 400 °C for 3 h was essential for VO2 phase formation. A change in the heat treatment conditions could lead to formation of V2O5 or V6O13. The differential scanning calorimetry experiments showed a hysteresis in the heating–cooling phase transitions corresponding to a reversible supercooling effect.
Tungsten oxide
Tungsten oxide (WO3) is well known for its electrochromic properties. It is one of the few materials in which electrochromism was first found and scientifically studied.[ Reference Deb 103 ] On application of an electric field a transparent WO3 thin film becomes deep blue and it retains its transparency upon withdrawal of the electric field. Voltage-induced reduction of W6+ to W5+ is believed to the cause of the transition. As a result, WO3 is a material of interest for smart windows.[ Reference Wang, Runnerstrom and Milliron 104 ] WO3 is a semiconductor with a band gap of about 2.7 eV. It is also used in photocatalysis, gas sensors, photovoltaics, and similar applications where semiconducting properties are utilized.
Nanoporous tungsten oxide was prepared by Mukherjee et al. in 2003 by anodizing tungsten films in 0.25 m oxalic acid.[ Reference Mukherjee, Paulose, Varghese, Mor and Grimes 105 ] Since then extensive studies have been done on the growth and applications of anodic WO3 films. In 2013, Lai et al. reported the fabrication of WO3 nanotubes via anodization.[ Reference Lai, Hamid and Sreekantan 106 ] They used 1 m Na2SO4 electrolyte containing 0.5 wt% of NH4F at constant 40 V. The electrolyte containing 0.7 wt% of NH4F yielded well-aligned nanotubular structure within 15 min of anodization at constant 40 V. Figures 14(a) and 14(b) respectively show the SEM and the TEM images of anodic WO3 nanotubes. The team revealed the potential of the material as a visible light photocatalyst by studying methylene blue degradation under solar irradiation [Fig. 14(c)].
(a) SEM and (b) TEM images of anodic WO3 nanotubes obtained by anodizing W foil in 1 m Na2SO4 + 0.5 wt% NH4F electrolyte at 40 V for 15 min. (c) Solar photocatalytic degradation of methylene blue dye using (a) no photocatalyst, (b) the compact layer having random pits formed after 10 min of anodization, (c) the nanoporous structure obtained after 30 min, and (d) the nanotube structure formed after 15 min of anodization. Copyright (2013) Lai et al.[ Reference Lai, Hamid and Sreekantan 106 ]

Zinc oxide
Zinc oxide is one of the most fascinating binary materials in the family of functional oxides. It is an n-type semiconductor with conductivity that can be changed to p-type or tuned from semiconductor to metallic by doping. It has a direct band gap of 3.37 eV and a large exciton-binding energy (60 meV) that enables it to have properties such as room temperature UV lasing. It exhibits piezoelectric, ferroelectric, and thermoelectric properties also. As a result zinc oxide finds applications in a wide range of technological areas such as optoelectronics (UV LEDs, and detectors and lasers), electronics, environmental sensing, photovoltaic devices and piezoelectric transducers, and energy harvesters.
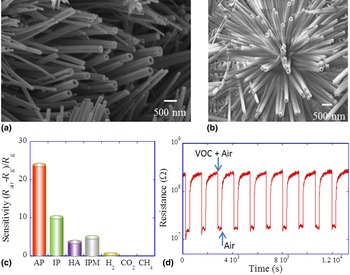
High diffusion rate of Zn2+ ions under anodic conditions makes it difficult to anodize in a controlled way and achieve ZnO nanotubes. Efforts to anodize zinc in fluoride electrolytes have yielded, at the best, the disrupted nanotubular structures.[ Reference Shrestha, Lee, Hahn and Schmuki 107 ] Non-fluoride electrolytes such as hydroxide or bicarbonate generated zinc nanowires and random architectures.[ Reference Wu, Lu, Li and Shi 108 – Reference Hu, Chen, Li, Yu and Peng 110 ] Very recently, Katwal et al. first reported the fabrication of hybrid ZnO nanotube/nanorod architecture by anodization.[ Reference Katwal, Paulose, Rusakova, Martinez and Varghese 36 ] They grew hybrid ZnO nanotube/nanorod architecture on zinc foil using aqueous solution containing 6.8 mm NaHCO3 (baking soda) and 5.7 mm Na2CO3 (washing soda) at a constant anodization voltage of 10 V. The anodized foil showed a structure consisting of both nanotubes and nanorods as shown in Figs. 15(a) and 15(b). The as-grown samples were predominantly amorphous with some Zn(OH)2 crystallites. The hybrid nanotube/nanorod structure was annealed at 400 °C for 2 h in oxygen ambient to get wurtzite zinc oxide. The nanotube wall turned porous upon annealing as a result of the gasification of the incorporated carbon species. The team developed chemiresistive sensors using this material to detect volatile organic compounds (VOCs) such as iso-propanol (IP), heptanal (HA), isopropyl myristate (IPM), and acetophenone (AP) that are considered markers for breast cancer. The architecture showed remarkable chemiresistive response to these VOCs at the ppm/billion level in air at 250 °C. Figure 15(c) shows the specificity of the device to breast cancer VOCs with respect to gases such as H2, CH4, and CO2. Figure 15(d) shows the sensor response when the environment was cycled between 100 ppm acetophenone in air and pure air at 250 °C. The high surface area provided by the nano-architecture and porous walls were believed to be responsible for the exceptional sensing properties of the material.
SEM images of zinc oxide nanotube/nanowire hybrid structured developed by anodizing zinc foil in aqueous NaHCO3 (a) or Na2CO3 + NaHCO3 (b) electrolytes. (c) The selectivity of the chemiresistive devices fabricated using this structure to breast cancer VOCs acetophenone (AP), isopropyl alcohol (IP), HA and IPM with respect to hydrogen, carbon dioxide, and methane. Concentrations of all gases except IPM (100 ppb) are 100 ppm. (d) The chemiresistive response of the device upon switching the environment between 100 ppm acetophenone in air and dry air at 250 °C. Reprinted with permission from.[ Reference Katwal, Paulose, Rusakova, Martinez and Varghese 36 ] Copyright (2016) American Chemical society.

Ternary and multinary metal oxide nanotubes
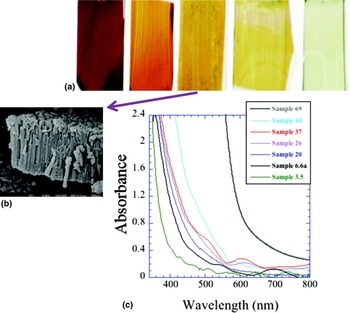
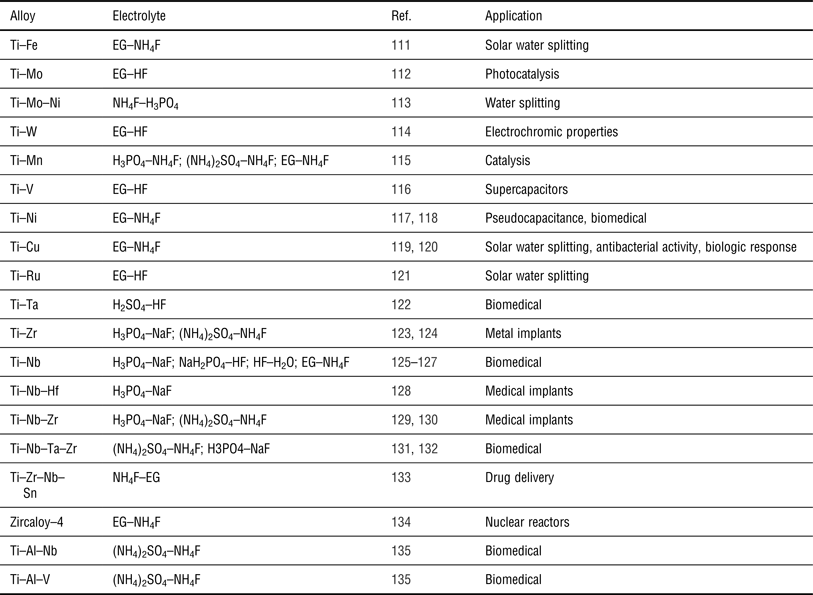
Oxide nanotubes of a number of alloys have been developed for various applications such as dental implants, photocatalysis, artificial organs, etc. (see Table I). The alloying could help the corresponding oxide to have a blend of the beneficial properties from the individual oxides. For example, in 2007, Mor et al. reported the fabrication of Ti–Fe–O nanotube arrays on FTO-coated glass substrates by anodizing Ti–Fe alloy films in an EG electrolyte consisting of 0.3% NH4F and 2 vol% deionized water at 30 V followed by annealing the samples at 500 °C for 2 h in oxygen ambient.[ Reference Mor, Prakasam, Varghese, Shankar and Grimes 111 ] While TiO2 absorbs only UV radiation, iron oxide has absorption up to yellow region (band gap ~2.2 eV). At the same time, the carrier mobility and diffusion length are much higher in titania than in iron oxide. Thus, the oxide of the alloy was expected to have better visible light photocatalytic activity. As shown in Fig. 16, the oxide nanotube band gap changed with alloy composition. They investigated the effect of Ti–Fe film composition on absorbed photon-to-current efficiency (APCE) and found highest APCE (~7%) for the composition 93.4% Ti–6.6% Fe.
(a) The photographs of Ti–Fe–O nanotube array samples (from right) 3.5, 6.6a, 20, 44, and a nanoporous α-Fe2O3 film. The sample numbers represent the % of iron in the Ti–Fe alloy film before anodization. (b) SEM image of the nanotubes grown from a Ti–Fe alloy film having 20% iron. (c) Absorbance spectra of 500 °C annealed Ti–Fe–O nanotube array films. Reprinted with permission from.[ Reference Mor, Prakasam, Varghese, Shankar and Grimes 111 ] Copyright (2007) American Chemical Society.

Oxide nanotubes fabricated from alloys.

Other oxide and non-oxide nanotubes from anodic oxide nanotubes
An interesting aspect of the nanotubes produced by anodic oxidation is that the anodic nanotubes of most oxides are structurally stable and hence, these could be transformed into nanotubes of other materials preserving the nanotube structure. For example, in 2005 Zhao et al. transformed anodically formed titanium nanotube arrays into barium titanate and barium strontium titanate nanotubes using hydrothermal treatment without structure destruction.[ Reference Zhao, Wang, Chen and Li 136 ] Figure 17(a) shows the image of the barium titanate nanotubes so formed. Since then, a number of such compounds have been developed in similar ways. For example, Xin et al. fabricated SrTiO3 nanotubes using this route for developing strontium releasing type Ti-based bone implants.[ Reference Xin, Jiang, Huo, Hu and Chu 137 ] Their in vitro studies showed that the material possessed biocompatibility.
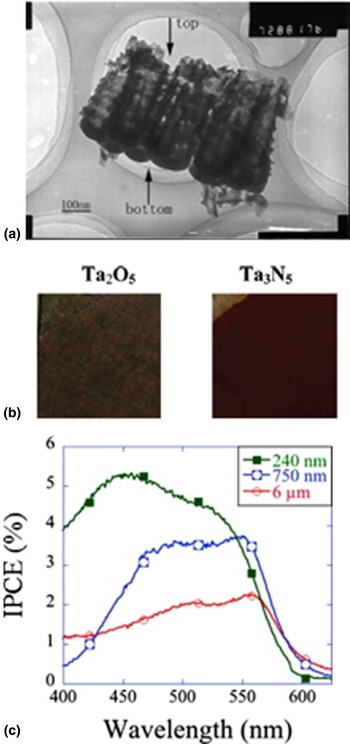
(a) TEM image of a barium titanate nanotube array fabricated using hydrothermal treatment of anodic titania nanotube array. Reprinted with permission from.[ Reference Zhao, Wang, Chen and Li 136 ] Copyright (2005) Elsevier B.V. (b) Photographs of gray colored Ta2O5 (left) and red colored Ta3N5 (right) nanotube array films. (c) Photocurrent action spectra recorded from Ta3N5 nanotube array film electrodes showing the visible light activity with film thickness. Reprinted with permission from.[ Reference Feng, LaTempa, Basham, Mor, Varghese and Grimes 138 ] Copyright (2010) American Chemical Society.

In 2010, Feng et al. first reported the fabrication of highly oriented Ta3N5 nanotube arrays by transforming Ta2O5 nanotubes.[ Reference Feng, LaTempa, Basham, Mor, Varghese and Grimes 138 ] They heat treated the anodically grown Ta2O5 nanotubes in ammonia atmosphere700 °C for 10 h. They observed that the nitride formation started at temperatures as low as 150 °C due to the nanoscale wall thickness of the tubes. The Ta3N5 nanotubes formed at 700 °C had a band gap of 2.1 eV [Figs. 17(b) and 17(c)]. Although these nanotubes showed visible light response, the activity reduced as length was increased from 240 to 750 nm. The authors attributed it to the electron trap states formed during the nitridation process. Recently, Su et al. identified Ta3N5 nanotubes modified with cobalt phosphate as a useful material for water splitting.[ Reference Su, Grigorescu, Wang, Lee and Schmuki 139 ]
Remarks and outlook
The so-called ‘old field’ of anodic oxidation received more attention in the past two decades than ever before due to the finding that the technique could be used to fabricate novel nanoarchitectures of various shapes and orientations. We reviewed here only the nanotube architecture because of the unique properties it provides and a plethora of potential applications. It is worth noting that the technique is still best known for dense oxide films as well as highly ordered porous structures due to the large-scale industrial production of these materials and there is significant progress in those areas as well. Nevertheless, it is likely that the anodization will be known in the future as a technique for fabricating device quality nanotube architectures. For this to happen finding most appropriate applications for a specific material and fine tuning the processes for maximizing the performance of these nanostructures based on a sound scientific rationale is required.
In general, there are two areas where strong research efforts are required: (i) revealing the actual nanotube formation mechanism and (ii) finding the most appropriate applications having potentials for commercialization for each material. While it is likely that both field-assisted dissolution and viscous flow processes contribute to the nanotube formation, with degree of individual contributions varying depending upon the material and growth conditions, a clear picture of the transformation of pores into tubular structure is still obscure. In materials such as zinc oxide, the nanotube growth appears to be proceeding through a route different from conventional. In this case, the anions are excessively incorporated during the growth. There are a few theoretical studies reported on titania nanotubes (not listed in this paper). But a strong tie between theory and experiment is required for a comprehensive model to emerge. It is also necessary to find, for each material, the applications that are most benefited by the use of nanotube architecture. Currently, extensive application oriented studies are performed only on very few materials such as titania nanotube arrays. Systematic efforts to tailor the properties to maximize the performance and reliability are essential for realizing real-world devices utilizing oxide nanoarchitectures. In short, the field of anodization appears to be undergoing a steep technological growth and it is expected to be a prominent nanotechnology tool once the nanotube architectures of various materials become a commercial reality.
Acknowledgments
The authors thank Shell International Exploration and Production Inc. for the financial support for developing the nanotube architecture for solar fuel generation.