I. INTRODUCTION
Since the first emergence of an amorphous structure upon rapid quenching of the Au–Si alloy some 50 years ago,Reference Klement, Willens and Duwez1 a great number of bulk metallic glass (BMG)–forming systems have been found and investigated thoroughly.Reference Inoue2–Reference Wang, Dong and Shek4 Considering thermal stability and glass-forming ability (GFA) of BMGs, great progress has been made from the view point of topologyReference Miracle5, Reference Miracle6 and chemistry [mainly considering the enthalpy of mixingReference Inoue2 as well as the nature of atomic bonding (electron concentration and electronegativity)]Reference Nagel and Tauc7–Reference de Oliveira, Pereira, Bolfarini, Kiminami and Botta12 as decisive parameters for determining glass formation and physical properties. Although the improved understanding of the underlying mechanisms of glass formation, the nature and structure of the glass, and the design of metallic glassy compositions with excellent GFA continue to be important, recently more and more attention is being shifted towards the development of BMGs that possess not only the high strength known for glassy materials but also considerable plasticity. There has been long standing interest in the elastic constants of metallic glasses as a key topic to understand the correlation between the structural characteristics and relevant mechanical properties. Elastic moduli give a global and often macroscopic view of the stiffness or compliance of a material. They reflect the interatomic bonding energies and the connectivity of the atoms with respect to structure formation and determination of physical properties of glassy materials.Reference Wang13, Reference Wang14 Along these lines, it was found that the elastic constants of metallic glasses provide useful guidelines for the development of plastic BMGs by appropriate choice of components following the Poisson’s ratio (ν) control strategy.Reference Wang14, Reference Lewandowski, Wang and Greer15
Among the diversity of BMGs,Reference Inoue2 Cu-based BMGs have received a lot of attention for technological applications in recent years because of desirable properties such as high strength and large plasticity in compression.Reference Wang, Dong and Shek4, Reference Das, Tang, Kim, Theissmann, Baier, Wang and Eckert16–Reference Eckert, Das, Pauly, Duhamel, Kim, Yi and Wang18 The recent finding of BMG formation in simple binary Cu–Zr alloys is promising for further development of BMGs from an engineering point of view because of attractiveness such as considerable plastic strain along with high yield strength under room temperature compression and low cost of fabrication.Reference Xu, Lohwongwatana, Duan, Johnson and Gorland19, Reference Inoue, Zhang, Tsurui, Yavari and Greer20 The mechanical properties of Cu–Zr BMGs have been linked to the deformation behavior of the crystalline phases that form in the vicinity of the equiatomic alloy Cu50Zr50. The different Cu–Zr intermetallic phases seem to dictate the response of the BMGs according to mechanical loading.Reference Pauly, Bednarčik, Kühn and Eckert21 Although CuZr2 exhibits a hardening mechanism borne by dislocations, B2 CuZr undergoes a deformation-induced martensitic transformation.Reference Pauly, Bednarčik, Kühn and Eckert21–Reference Barekar, Pauly, Kumar, Kühn, Dhindaw and Eckert23 By synthesizing a BMG composite with B2 CuZr phase, extensive work hardening has been achieved.Reference Hofmann24 Limited GFA and limited thermal stability of the binary Cu–Zr system have led to the development of ternary and quaternary alloy systems with a high GFA similar to Cu–Zr–Al,Reference Inoue and Zhang25 Cu–Zr–Ti,Reference Inoue, Zhang, Zhang and Kurosaka26 Cu–Zr–Ag,Reference Zhang and Inoue27 Cu–Zr–Al–Y,Reference Xu, Duan and Johnson28 and Cu–Zr–Ag–Ti.Reference Dia, Guo, Shen, Li, Ma and Xu29 The phase formation and transformation kinetics in a series of Cu–Zr–Ti and Cu–Zr–Al alloys have been investigated by means of x-ray diffraction (XRD).Reference Pauly, Das, Mattern, Kim and Eckert30 Recently, a new series of quaternary Cu–Zr-based bulk glassy alloys with large supercooled liquid region, excellent GFA, and high mechanical strength was found in the Cu–Zr–Al–Ag system.Reference Zhang, Jiang, Chen, Shao, Liu and Jiang31–Reference Kim, Lee, Cha, Ahn and Fleury38 Apart from this, studies on crystallization kineticsReference Ou, Zhang, Xu, Wang, Liu and Jiang39–Reference Zhao, Kou, Suo, Wang and Ding41 and phase separationReference Zhang, Zhang, Xie and Inoue42, Reference Oh, Ohkubo, Kim, Fleury and Hono43 due to a positive heat of mixing between Cu and Ag have been documented for Cu–Zr–Al–Ag alloys with different compositions. However, a systematic work is needed to gain a deeper understanding regarding the structural, thermal, and mechanical behavior of technologically relevant and promising Cu–Zr-based BMG alloys and BMG composites with Al and Ag additions.
Accordingly, this study intends to present the influence of simultaneous addition of Al and Ag on structure formation, thermal stability, and mechanical performance of Cu–Zr–Al–Ag glassy alloys. Besides the phase formation, we also systemically examined the effects of equivalent atomic ratio of the Al and Ag addition on the interatomic bond strength, which reflects in different macroscopically measurable quantities such as the glass transition temperature, the elastic constants, and electronegativity and their relations with the thermal and mechanical behavior of the Cu–Zr–Al–Ag alloys. As a shape memory effect arises in the CuZr alloy,Reference Koval, Firstov and Kotko44 effort has been undertaken in this study to characterize the effect of Al + Ag addition on the martensite and reverse martensite transformation of the CuZr phase. Our experimental results are compared with literature data of other BMG families. It is found that the thermal behavior is closely related to the electronegativity of the alloys. The possible mechanisms for the structural, thermal, and mechanical behavior of the Cu–Zr–Al–Ag alloys due to element addition are discussed. The study of the elastic constants, thermal behavior, and related structures will give more fundamental insights into the properties of Cu–Zr–Al–Ag BMGs.
II. EXPERIMENTAL PROCEDURE
Alloy ingots with nominal compositions of (Cu0.5Zr0.5)100−x(Al0.5Ag0.5)x (x = 2, 4, 6, 8, 10, 12, 14, 16) were prepared by arc melting mixtures of Cu, Zr, Al, and Ag in a high purity argon atmosphere. The ingots were melted several times to guarantee homogeneity of the alloy. Rods with a diameter of 2 mm and a length of 75 mm were produced by in situ solidification in a suction casting facility attached to the arc melter. Structural investigations were carried out using XRD in transmission geometry on a STADI P diffractometer (STOE, Darmstadt, Germany) equipped with MoKα1 radiation (λ = 0.07093187 nm). The thermal stability was examined by differential scanning calorimetry (DSC) (Perkin-Elmer Diamond, USA) at a heating rate of 20 K/min. The melting behavior of the samples, the temperatures related with endothermic events before melting, and the enthalpies of melting were investigated with a Netzsch DSC 404C (Selb, Germany) using a heating rate of 20 K/min. To understand the phase formation related to endothermic event before melting, the Cu49Zr49Al1Ag1 specimens were heated up to 948 and 1048 K at a heating rate of 20 K/min, followed by cooling at a maximum cooling rate of 50 K/min and were analyzed by XRD. To investigate martensitic transformation temperatures, the (Cu0.5Zr0.5)100−x(Al0.5Ag0.5)x (x = 2, 4, 6, 8) samples were annealed at the respective B2 CuZr transformation finish temperatures for ∼120 min before cooling at a maximum cooling rate of 50 K/min. Relationship between the element additions and the martensitic transformation temperatures was studied for annealed samples with the help of a Pyris DSC (Perkin-Elmer) using a heating and cooling rate of 5 K/min. For measurements of the elastic constants, the rod-shaped samples were cut into cylinders with a length of 4 mm, and the ends of the cylinders were carefully polished flat and parallel before the ultrasonic measurements with an Olympus Panametrics-NDT 5900PR ultrasonic testing device. Vicker’s microhardness tests (HMV 2, Shimadzu, Japan) were done on the as-cast samples under a load of 50 g. The room temperature compression tests were performed with an Instron 5869 testing machine (equipped with a Fiedler laser extensometer) at a constant strain rate of 1 × 10⁻⁴ s−1. At least four specimens of each composition were tested to ensure reproducibility of the results.
III. RESULTS AND DISCUSSION
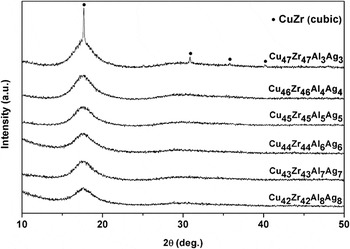
The XRD patterns taken from the top section of the (Cu0.5Zr0.5)100−x(Al0.5Ag0.5)x (x = 6, 8, 10, 12, 14, 16) rods, where the cooling rate is the lowest, are depicted in Fig. 1. The XRD patterns of all rods exhibit a broad maximum characteristic of an amorphous phase with no evidence for crystalline peaks except for the Cu47Zr47Al3Ag3 rod. The Cu47Zr47Al3Ag3 rod exhibits diffraction peaks corresponding to the B2 CuZr phase (Pm-3m) with a lattice parameter of a = 0.326 nm.Reference Pauly, Liu, Wang, Kühn, Mattern and Eckert45 It has been found that B2 CuZr precipitates at a cooling rate less than 370 K/s.Reference Jiang, Zhang, He, Sun, Zhang and Zhang46 XRDs from the bottom part of the (Cu0.5Zr0.5)100−x(Al0.5Ag0.5)x (x = 6, 8, 10, 12, 14, 16) specimens confirm that they are glassy (not shown here) because of the higher cooling rate in this part of the specimens. These findings reveal that the structure of the Cu47Zr47Al3Ag3 alloy rod is influenced by the gradient in the cooling rate (i.e., lower at the top compared to the bottom) inherent to the casting process, as it is expected from previous experiments.Reference Barekar, Pauly, Kumar, Kühn, Dhindaw and Eckert23, Reference Pauly, Liu, Wang, Kühn, Mattern and Eckert45 It is important to mention here that the B2 CuZr phase crystallizes polymorphically from the melt.Reference Barekar, Pauly, Kumar, Kühn, Dhindaw and Eckert23, Reference Pauly, Gorantla, Wang, Kühn and Eckert47 The B2 CuZr phase (Pm-3m) is stable only at temperatures above 988 K and decomposes into Cu10Zr7 (C2ca) and CuZr2 (I4/mmm).Reference Pauly, Bednarčik, Kühn and Eckert21, Reference Zeng, Hämäläinen and Lukas48, Reference Yamamoto, Yokoyama, Ichitsubo, Kimura, Matsubara and Inoue49 The rapid heat extraction suppresses the eutectoid decomposition of B2 CuZr into the low-temperature equilibrium phases, Cu10Zr7 and CuZr2.Reference Zeng, Hämäläinen and Lukas48, Reference Das, Pauly, Boström, Durst, Göken and Eckert50 Besides, a reversible martensitic transformation from the B2 (parent phase) to the monoclinic structure (martensite) renders the B2 compound a shape memory alloy.Reference Koval, Firstov and Kotko44, Reference Pauly, Liu, Wang, Kühn, Mattern and Eckert45
XRD patterns from the top part of the 2-mm-diameter as-cast (Cu0.5Zr0.5)100–x(Al0.5Ag0.5)x (x = 6, 8, 10, 12, 14, 16) alloy rods.

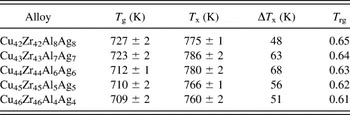
All alloys exhibit a distinct glass transition, followed by a supercooled liquid region (ΔTx = Tx−Tg, where Tx and T g are the onset crystallisation and glass transition temperatures, respectively) and an exothermic reaction indicating crystallization. The thermal stability data obtained from the DSC measurements of the as-cast Cu–Zr–Al–Ag alloys are listed in Table I. A parameter estimating the GFA, the reduced glass transition temperature, T rg = Tg/T 1,Reference Turnbull51 where T l is the liquidus temperature, is calculated for the as-cast Cu–Zr–Al–Ag alloys (Table I). It can be seen that the glass transition temperature (T g) increases with increasing Al and Ag content. ΔTx increases with increasing Al and Ag content and reaches a maximum at the composition Cu44Zr44Al6Ag6 and then drops to 48 K for the Cu42Zr42Al8Ag8 alloy. The (Cu0.5Zr0.5)100−x(Al0.5Ag0.5)x (x = 8, 10, 12, 14, 16) alloys show a linear increase of the T rg parameter with increasing Al and Ag content. Similar trends of the thermal properties of (Cu0.5Zr0.5)100−x(Al0.5Ag0.5)x (x = 4, 8, 12, 16, 20) alloys have been reported by Zhang et al.Reference Zhang, Zhang and Inoue34 The discrepancy observed in the values of the thermal stability data between this study and those reported by Zhang et al.Reference Zhang, Zhang and Inoue34 is due to the different heating rates used for the DSC measurements. It has been reported that the addition of Al and/or Ag to Cu–Zr glass-forming alloys stabilizes the supercooled liquid against crystallization and also increases the GFA compared to the Cu–Zr binary system.Reference Inoue and Zhang25, Reference Zhang and Inoue27, Reference Zhang, Zhang and Inoue34, Reference Sung, Kwon, Fleury, Kim, Lee, Kim and Kim37, Reference Yu, Bai, Tang and Wang52, Reference Luzgin, Georgarakis, Yavari, Vaughan, Xie and Inoue53 The effectiveness of the three empirical rulesReference Inoue2 for the stabilization of the supercooled liquid and for obtaining a high GFA has been proved to be an effective guideline for a number of alloy compositions.Reference Inoue and Zhang25–Reference Zhang and Inoue27 Al and Ag have an intermediate atomic radii of 0.143 and 0.145 nm, respectively, which lie between Cu (0.128 nm) and Zr (0.160 nm) elements. The enthalpies of mixing are negative for the Cu–Zr (−23 kJ/mol), Zr–Al (−44 kJ/mol), Cu–Al (−1 kJ/mol), Zr–Ag (−20 kJ/mol), and Al–Ag (−4 kJ/mol) atomic pairs.Reference Inoue and Zhang25, Reference Zhang and Inoue27 The difficulty of simultaneous rearrangements of the different species of atoms favors a higher degree of dense randomly packed atoms.
Thermal properties [glass transition temperature (T g), onset crystallization temperature (T x), supercooled liquid region (ΔT x), and reduced glass transition (T rg)] of the Cu–Zr–Al–Ag bulk glassy alloys studied in this work (heating rate 20 K/min).

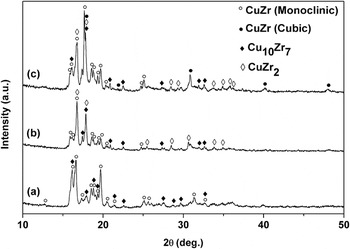
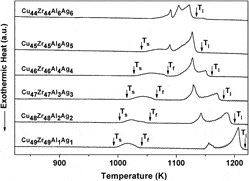
Figure 2 shows the high temperature DSC curves of the different as-cast Cu–Zr–Al–Ag alloys. Under continuous heating at 20 K/min, the alloys show a multistage melting behavior. The DSC traces for the (Cu0.5Zr0.5)100−x(Al0.5Ag0.5)x (x = 2, 4, 6, 8, 10) alloys exhibit rather complex endothermic processes spanning over a large temperature interval, revealing that the compositions are quite far away from the eutectic point. The irregular shape of the melting peaks of the alloys in Fig. 2 suggests that the melting processes are likely to involve various intermetallics with different melting points. For a more detailed analysis, further experiments preferably by in situ measurements are necessary. When the Al + Ag content increases from 2 to 8 at.%, the intensity of the second melting event decreases. Although the Al + Ag content increases further to 10 at.%, the intensity of the second melting step increases again. According to Lu et al.,Reference Lu, Tan, Li and Ng54 this kind of behavior for the Pd–Cu–Si alloy system indicates that the eutectic point is nearby Pd77.5Cu6Si16.5 alloy. With reference to the melting behavior, increasing the Al and Ag content in the glass shifts the first endothermic melting event to lower temperatures. The liquidus temperature decreases with increasing amount of Al and Ag. Figure 3 shows the XRD patterns of the Cu49Zr49Al1Ag1 sample subjected to heating at 20 K/min up to 948 K (i.e., before the onset of the first endothermic event in Fig. 2) and 1048 K (i.e., after the end of the first endothermic event in Fig. 2) and subsequent cooling at 50 K/min without holding at 948 and 1048 K. The XRD pattern from the top section of the as cast Cu49Zr49Al1Ag1 sample is also presented in Fig. 3. It can be seen that the strongest reflections in the as-cast specimen stem from the CuZr monoclinic phase, whereas their intensity decreases for the specimen that was subjected to heating at 948 K and subsequent cooling without holding. The presence of the CuZr monoclinic phase in the specimen subjected to heating at 948 K may be due to the limited time available for its decomposition into the low temperature equilibrium phases. Therefore, the martensite is still visible in the XRD pattern because of the incomplete eutectoid reaction. The B2 CuZr phase precipitates upon cooling from 1048 K, as can be seen from the XRD pattern in Fig. 3. With reference to the appearance of B2 CuZr Bragg peaks in the specimen subjected to heating to 1048 K, the endothermic event before melting indicates the transformation of the low-temperature equilibrium phases, i.e., Cu10Zr7 and CuZr2 into CuZr. The respective start and finish B2 transformation temperatures (i.e., T s and T f) related to endothermic event, liquidus temperatures (T l), and the enthalpies of melting (ΔHx ,1 and ΔHx ,2 corresponding to first and second melting event, respectively) are listed in Table II. With increasing Al and Ag content, the temperatures related to the transformation between the low-temperature equilibrium phases and CuZr parent phase (i.e., T s and T f) shift to higher values, as can be seen in Fig. 2. Thus, Al and Ag have a distinct effect on the melting behavior.
High temperature differential scanning calorimetry (DSC) curves (heating rate 20 K/min) of (Cu0.5Zr0.5)100−x(Al0.5Ag0.5)x (x = 2, 4, 6, 8, 10, 12) alloys displaying the melting behavior. (T s and T f are start and finish temperatures, respectively, T l is liquidus temperatures).

XRD patterns of (a) the top section of an as-cast Cu49Zr49Al1Ag1 sample and a Cu49Zr49Al1Ag1 sample heated at 20 K/min to (b) 948 K and (c) 1048 K immediately followed by cooling at 50 K/min.

Thermal stability parameters [start temperature (T s), finish temperature (T f), liquidus temperatures (T l), enthalpies of melting (ΔHx ,1 and ΔHx ,2) corresponding to first and second melting event, respectively] and electronegativity values (Δx) of the Cu–Zr–Al–Ag bulk glassy alloys studied in this work.

n/a, not available.
It is well known that covalent bonds and metallic bonds coexist in metals and alloys. Covalent bonds determine the crystal structure of a given metal or alloy, and the covalent bonds are much more susceptible to temperature changes than metallic bond.Reference Wang55 From the perspective of chemical effects, stronger interaction and orbital hybridization between Al and Cu bring in certain degree of covalent bonding.Reference He, Cheng, Ma and Xu56 It has also been documented that the phase stability in Zr–Cu–Al alloys depends on their electronic structure and atomic bonding.Reference Qiu, Shen, Liu, Lin and Jiang57 It is generally accepted that the electrochemical factor, i.e., the difference in electronegativity between the constituent elements, is one of the most important factors determining the stability of metallic alloys and intermetallic compounds.Reference Hume-Rothery, Rudmar, Stringer and Jaffee58 Electronegativity describes the tendency of an atom to attract electrons towards itself. Based on the Hume-Rothery rules, the electronegativity difference actually reflects the bonding nature of atomic pairs in alloys. Within a certain composition range, the lower electronegativity difference leads to a more pronounced metallic type of bonding.Reference Louzguine-Luzgin, Inoue and Botta9 Fang et al.Reference Fang, Xiao, Xia, Li and Dong11 have proposed a parameter, i.e., the electronegativity difference (Δx), to correlate the alloy composition with the thermal stability and GFA of ternary metallic glasses. The parameter, Δx, quantifying the electronegativity differences among the elements is adopted for the quaternary alloys examined in this work and is given by
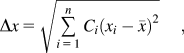
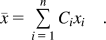
Here, n is the number of components, xi is the Pauling electronegativity of element i, Ci is the concentration of element i, and  is the average electronegativity of the alloy. The Pauling electronegativity values (in Pauling units) for the constituent elements Cu, Zr, Al, and Ag are 1.90, 1.33, 1.61, and 1.93,59 respectively. By using Eq. (1), the electronegativity differences were determined for the alloys studied here, and the values are summarized in Table II. The addition of Al and Ag substituting Cu and Zr reduces the effective Δx values among the constituent elements. This indicates that the decrease in the electronegativity difference in the Cu–Zr–Al–Ag glassy alloys may be related to a shift in T s to higher values. The endothermic event before melting is absent in the DSC trace of the Cu44Zr44Al6Ag6 alloy for which the electronegativity difference value is the lowest. Plenty of investigations have already been carried out for the Cu–Zr–Al system;Reference Pauly, Das, Mattern, Kim and Eckert30, Reference Yu, Bai, Tang and Wang52, Reference Wang, Tan and Li60, Reference Wang, Wang, Qiang, Zhang, Shek and Dong61 however, results regarding the thermal properties do not point to a clear trend of the endothermic event before melting as observed in this study (Fig. 2). This further confirms the critical role of Ag additions on the thermal behavior of the Cu–Zr–Al–Ag alloys. The above understanding of stability of B2 CuZr phase will be relevant for the development of Cu–Zr-based metallic glass composites.
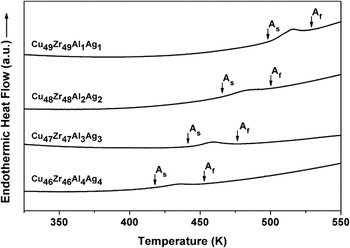
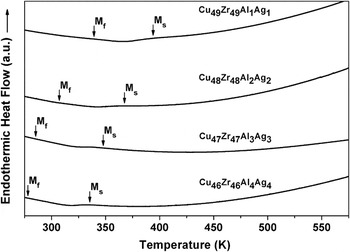
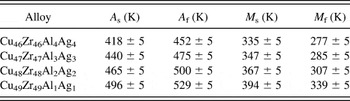
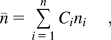
Figures 4 and 5 shows the typical DSC curves of annealed (Cu0.5Zr0.5)100−x(Al0.5Ag0.5)x (x = 2, 4, 6, 8) samples upon heating and cooling with a scanning rate of 5 K/min, respectively. From these curves, the only one endothermic peak corresponding to the reverse martensitic transformation during heating and an exothermic peak corresponding to the martensitic transformation during cooling can be seen. With increasing Al + Ag content, the martensite transformation starting temperature (M s) and finishing temperature (M f) during cooling and the austenite transformation starting temperature (A s) and finishing temperature (A f) during heating shift to the lower values. The composition dependences of the martensitic transformation temperatures for the present Cu–Zr–Al–Ag alloys are listed in Table III. Figure 6 depicts the relationship between the martensitic start (M s) and the austenitic start (A s) transformation temperatures and the mean valence electrons per atom. The mean valence electrons per atom ( ) can be calculated as followsReference Fang, Xiao, Xia, Wang, Li and Dong62:
DSC curves (heating rate 5 K/min) of the annealed (Cu0.5Zr0.5)100−x(Al0.5Ag0.5)x (x = 2, 4, 6, 8) samples displaying the austenitic transformation. (A s and A f are the starting and finishing austenite transformation temperatures, respectively).

DSC curves (cooling rate 5 K/min) of the annealed (Cu0.5Zr0.5)100−x(Al0.5Ag0.5)x (x = 2, 4, 6, 8) samples displaying the martensitic transformation. (M s and M f are the starting and finishing martensite transformation temperatures, respectively).

The martensitic and austenitic transformation start temperatures (M s and A s) as a function of the mean valence electrons per atom.

Martensitic transformation temperatures [martensite start (M s), martensite finish (M f), austenite start (A s), and austenite finish (A f)] of (Cu0.5Zr0.5)100−x(Al0.5Ag0.5)x (x = 2, 4, 6, 8) alloys.

where Ci is the concentration of element i in the alloy; the element electron concentration ni uses the number of (s + d) electrons for transition metals and the number of (s + p) electrons for element with a p electronic structure. From the results, it is clear that the transformation temperatures (M s and A s) decrease with decreasing  and increasing Al and Ag content. The present correlation between M s, A s, and
 is consistent with observations for other alloy systems.Reference Yu, Fu, Wang and Zu63, Reference Chen, Lu, Wang and Qin64 It has been reported that the addition of an element leading to a higher
 value results in an increase in the density of states (N(E)) at the Fermi level, resulting in a martensitic transition temperature shift to higher values for Zr–Cu–Ni alloys.Reference Koval, Firstov, Delaey and Humbeeck65 Hence, understanding and predicting the phase stability in terms of the electronic structure is of paramount importance, and further studies on how the atomic bonding is influenced by alloying elements are necessary.
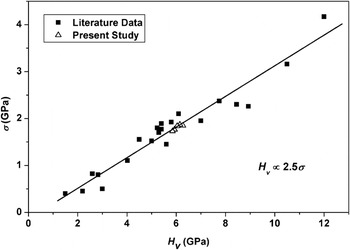
The elastic constants obtained from the ultrasonic measurements are summarized in Table IV. The Young’s modulus (E) increases with increasing Al and Ag content. All BMGs have a Poisson’s ratio (ν) larger than 0.31–0.32, a value that is connected to a brittle-to-ductile transition for BMGs.Reference Lewandowski, Wang and Greer15 The data of the elastic moduli and the glass transition of the investigated BMGs show that there is a correlation between the elastic constants and T g. An empirical correlation between E of metallic glasses and T g, (Tg ∝ 2.5E), has been suggested previously.Reference Wang13 It is generally known that T g is dominated by the bonding force between the constituent elements.Reference Wang14 Ag and Al have strong negative heats of mixing with Zr, suggesting that strongly bound atomic pairs may form. Consequently, the enhanced elastic modulus (E) depends on the interatomic constraint force favored by highly attractive bonding interaction of Zr, Al, and Ag. Figure 7 shows the compressive stress–strain curves of the alloys, which elucidate the fracture strength (σ) and strain to failure (ε f) with different Al and Ag content as listed in Table IV. The fracture stress for all specimens is above 1.70 GPa, and the total compressive strain before failure is about 2.0%. It can be seen that the metallic glassy samples display initial elastic deformation behavior before failure. Additionally, the linear relationship between σ and E, (E/σ ≈ 50), which was predicted for other BMGs,Reference Wang14 holds true also for the present alloys, as can be seen in Fig. 8. The Vicker’s hardness values for the (Cu0.5Zr0.5)100−x(Al0.5Ag0.5)x (x = 8, 10, 12, 14, 16) alloys (Table IV) show that the hardness increases from 585 ± 7 to 627 ± 8 H v with increasing Al + Ag content from x = 8 to 16. The increment in the hardness values can be attributed to the stronger bonding forces in the metallic glasses because of Al and Ag addition. The data of the Young’s modulus, Vicker’s hardness, and fracture strength for a variety of BMGs alloysReference Wang14 show a clear relationship between H v and E, (E/H v ≈ 20), and H v and σ, (H v ∝ 2.5σ), and the present Cu–Zr–Al–Ag metallic glasses fit reasonably well into these correlations, as can be seen from Table IV and Fig. 9. Considering the critical casting diameter for (Cu0.5Zr0.5)100−x(Al0.5Ag0.5)x (x = 8, 10, 12, 14, 16) BMGs stated in literature, the Cu42Zr42Al8Ag8 alloy has the highest GFA.Reference Zhang, Jiang, Chen, Shao, Liu and Jiang31, Reference Zhang, Zhang, Xie and Inoue33, Reference Zhang, Zhang and Inoue36 In the present case, the Cu42Zr42Al8Ag8 alloy exhibits the smallest Poisson’s ratio (ν) of all investigated alloys. The Poisson’s ratio (ν) characterizes the relative value of the compressive and shear deformation of a solid.Reference Wang14 Although a small ν means that the atoms or molecules can hardly rearrange themselves forced by shear strains without a drastic disturbance in bonding configuration and conversely, a large ν indicates a relatively easy atomic rearrangement.Reference Wang14
True stress–strain curves for as-cast (Cu0.5Zr0.5)100−x (Al0.5Ag0.5)x (x = 8, 10, 12, 14, 16) alloys loaded in uniaxial compression (strain rate of 1 × 10⁻⁴ s−1).

Correlation of the mechanical strength (σ) with the elastic modulus (E) of the investigated Cu–Zr–Al–Ag BMGs together with relevant literature data.Reference Wang14

Correlation of the mechanical strength (σ) with the Vicker’s hardness (H v) of the investigated Cu–Zr–Al–Ag BMGs together with relevant literature data.Reference Wang14 The line is a guide to the eyes.

Mechanical properties [Young’s modulus (E), fracture strength (σ), strain to failure (ε f), and Vicker’s hardness (H v)] of the as-cast (Cu0.5Zr0.5)100−x(Al0.5Ag0.5)x (x = 8, 10, 12, 14, 16) alloys.

IV. CONCLUSIONS
(1) The effect of simultaneous addition of Al and Ag on the structural, thermal, and mechanical behavior of (Cu0.5Zr0.5)100−x(Al0.5Ag0.5)x (x = 6, 8, 10, 12, 14, 16) alloys was investigated. The Young’s modulus and Vicker’s hardness of the Cu–Zr–Al–Ag BMGs correlate with the fracture strength. Both the Young’s modulus and Vicker’s hardness increase with increasing Al and Ag content. The Cu44Zr44Al6Ag6 and Cu42Zr42Al8Ag8 alloys exhibit the largest ΔTx and T rg values, respectively.
(2) The investigation of the influence of the Al and Ag addition on the thermal behavior of the Cu–Zr–Al–Ag metallic glasses reveals that the start and finish temperatures (T s and T f, respectively) related to the transformation of the low-temperature equilibrium phases to the CuZr parent phase shift to higher values with increasing Al and Ag content. The martensite and austenite transformation temperatures (M s, M f, A s, and A f) shift to lower values with increasing Al and Ag content.
(3) The Vicker’s hardness, Young’s modulus, compressive fracture strength, and strain to failure are 585 ± 7 to 627 ± 8 H v, 85 ± 1 to 95 ± 1 GPa, 1730 ± 10 to 1870 ± 10 MPa, and 2–2.7%, respectively, for the (Cu0.5Zr0.5)100−x(Al0.5Ag0.5)x (x = 8, 10, 12, 14, 16) alloys.
ACKNOWLEDGMENTS
The authors thank S. Donath, M. Frey, M. Samadi Khoshkoo, and U. Wilke for technical assistance and stimulating discussions. P.G. acknowledges the German Academic Exchange Service, DAAD, and Conselho Nacional de Desenvolvimento Científico e Tecnológico (CNPq), Brazil, for financial support, and K.K.S. is grateful to the Chinese Scholarship Council (CSC) for providing a scholarship. S.P. furthermore acknowledges financial support granted by the program “Promotionsförderung des Cusanuswerks.”