Introduction
An important model of bilingual production is the revised hierarchical model (RHM) (Kroll & Stewart, Reference Kroll and Stewart1994). The RHM consists of three modules: first language (L1), second language (L2), and a conceptual system. Kroll and Stewart (Reference Kroll and Stewart1994) proposed that the link between L1 and the conceptual system is stronger than the link between L2 and the conceptual system. Furthermore, the lexical link between L1 and L2 is stronger from L2 to L1 than from L1 to L2 because when L2 learners first learn the translations of L2 words, they form the connection from L2 to L1. Kroll and Stewart also suggest that translations from L1 to L2 usually go through the conceptual system due to the strong link between L1 and the conceptual system and the relatively weak lexical link from L1 to L2; translations from L2 to L1 usually go directly to L1 via the strong lexical link between the two lexical systems. The link from L2 to the conceptual system may strengthen and the lexical link from L2 to L1 may weaken as proficiency in L2 increases (Sunderman & Kroll, Reference Sunderman and Kroll2006). Support for the RHM comes primarily from translation studies that imply a shared conceptual representation whose access is influenced by differential proficiency (Jared & Kroll, Reference Jared and Kroll2001; Kroll, Bobb & Wodniecka, Reference Kroll, Bobb and Wodniecka2006; Kroll & Stewart, Reference Kroll and Stewart1994; Kroll, van Hell, Tokowicz & Green, Reference Kroll, van Hell, Tokowicz and Green2010; Sholl, Sankaranarayanan & Kroll, Reference Sholl, Sankaranarayanan and Kroll1995; Talamas, Kroll & Dufour, Reference Talamas, Kroll and Dufour1999). The RHM was further refined by Heredia (Reference Heredia1996), who proposed a Second Revision (R-2) of the Revised Hierarchical Model where emphasis is shifted from the chronological order in which languages were learned to relative language dominance. L1 is, thus, replaced by “Most Dominant Language” (MDL) and L2 by “Least Dominant Language” (LDL).
de Groot (Reference de Groot1992) has proposed the mixed model; wherein lexical connections in both languages are connected directly (link T1) and indirectly, via a shared representation in conceptual memory (links T2a and T2b). Results from de Groot et al. (de Groot, Dannenburg & Van Hell, Reference de Groot, Dannenburg and Vanhell1994) suggest that the ease and accuracy of translation in both directions (from L1 to L2 and from L2 to L1) are affected by variables such as word frequency, word familiarity and word imageability.
All of the above models provide a context for examining not only bilingual translation but also word access during tasks such as verbal fluency. Verbal fluency tasks are a measure of language access used to assess cognitive and linguistic functioning, particularly naming ability. They may be phonemic, in which individuals are asked to name as many items as they can in a given time period beginning with the same sound, or semantic, in which individuals are asked to name items in a given category. The present study focuses on semantic fluency, or category fluency, in bilingual individuals. To perform a category fluency task, specific lexical semantic concepts that are activated can facilitate activation of corresponding phonological representations in the two languages. There are several factors at play that influence performance in L1 and L2 on the category fluency task in bilinguals, including the degree of proficiency in the L1 and L2 and its consequence on the meaning, to phonology mapping in the two languages, the nature of the conceptual representations for specific categories (Taylor, Devereux & Tyler, Reference Taylor, Devereux and Tyler2011), and the typologies of languages examined. The present study focuses on the influence of language proficiency and language combination on lexical access; as will be reviewed below, studies examining category fluency in bilingual individuals have been varied in both their methods and their results.
In general, category fluency tasks have been used to compare lexical access in different languages. Most studies, however, that have compared bilingual performance in L1 to performance in L2 found no significant differences between the overall number of items named in L1 and L2, suggesting that proficient bilingual individuals are able to access words in both of their languages at the same rate. Roberts and Le Dorze (Roberts & Le Dorze, Reference Roberts and Le Dorze1997) found no difference for items generated within animal and food categories in French and English for balanced French–English bilinguals. Similarly, Rosselli et al. (Rosselli, Ardila, Araujo, Weekes, Caracciolo, Padilla & Ostrosky Solís, Reference Rosselli, Ardila, Araujo, Weekes, Caracciolo, Padilla and Solís2000) examined monolingual Spanish and English speakers and bilingual Spanish–English speakers who performed phonemic and semantic verbal fluency tasks. While no differences emerged between the monolingual and bilingual participants on the verbal fluency tasks, bilingual participants who learned their L2 (English) before the age of 12 performed better on an English repetition test that participants who learned English after the age of 12. In another study with the same subjects, Rosselli et al. (Rosselli, Ardila, Salvatierra, Marquez, Matos & Weekes, 2002) found no differences in performance on an animal fluency task in proficient Spanish–English bilinguals. Bilinguals produced more semantic associations in Spanish than in English, suggesting that while there may be no difference in the number of items named in their two languages, there may be differences in the way they name items in each language.
Bethlehem and colleagues (Bethlehem, de Picciotto & Watt, Reference Bethlehem, de Picciotto and Watt2003) studied category fluency in bilingual Zulu–English speakers for whom Zulu was the L1 and found no significant differences in performance across languages. Zulu–English speakers performed equally well on category fluency tasks in Zulu, English, and in a bilingual category fluency task, in which they were permitted to code-switch. Despite the lack of difference between category fluency scores, English scores did not significantly correlate with Zulu scores. Further, the participants varied greatly in the age of acquisition of their L2, and results showed that the later L2 (English) was learned, the lower the verbal fluency performance in English.
Other studies have investigated the effects of proficiency on category fluency performance more directly. Kamat and colleagues (Kamat, Ghate, Gollan, Meyer, Vaida, Heaton, Letendre, Franklin, Alexander, Grant, Mehendale, Marcotte & the HIV Neurobehavioral Research Program (HNRP) Group, 2012) found that Marathi–Hindi bilingual individuals who had a higher level of proficiency in Hindi, their second and less-dominant language, performed better on an animal fluency task administered in Marathi, their first and more-dominant language, than did participants with a lower level of proficiency in Hindi. Unfortunately, the task was not administered in Hindi as well, so effects of proficiency on performance in both languages cannot be assessed.
Luo and colleagues (Luo, Luk & Bialystok, Reference Luo, Luk and Bialystok2010) investigated the effects of English proficiency on performance on an English category and letter fluency tasks in monolingual English speakers and a variety of bilingual speakers. Participants’ English expressive and receptive vocabularies were assessed and bilingual participants were placed into either a high-vocabulary or a low-vocabulary group. Luo et al. found that while bilingual individuals with higher English vocabulary scores (an index of proficiency) performed better than individuals with lower English vocabulary scores on a letter fluency task, they did not differ in performance on a semantic fluency task. The authors suggest that habitual semantic searching processes may interfere with performance on a letter fluency task but not on a category fluency task and that individuals with lower English vocabulary scores would likely be more affected by this than would individuals with higher English vocabulary scores. In another study, Blumenfeld (Blumenfeld, Bobb & Marian, Reference Blumenfeld, Bobb and Marian2016) found that Spanish–English bilinguals dominant in English produced a similar number of items as monolingual English speakers; however, they produced fewer items in their non-dominant language (Spanish). Similarly, Poreh and Schweiger (Poreh & Schweiger, Reference Poreh and Schweiger2002) found that age of acquisition of Hebrew affected performance on a phonemic fluency task, but not on a semantic fluency task. The degree of use of Hebrew did not influence the results. In general, these studies indicate that language proficiency of participants may influence the degree of lexical access in the two languages. Consistent with the theoretical models discussed earlier in the introduction (particularly the RHM and revised RHM), they highlight that the lower the proficiency in a language, the lower lexical access in that language. Individuals equally proficient in both languages show no differences in their lexical access. Of course, other factors mediate the degree of lexical access in verbal fluency tasks as well.
For instance, Kempler and colleagues (Kempler, Teng, Dick, Taussig & Davis, Reference Kempler, Teng, Dick, Taussig and Davis1998) assessed the effects of age and ethnic group on category fluency performance in a group of 317 Chinese, Hispanic, Vietnamese, English-speaking White, and English-speaking African American individuals. All participants performed the category fluency task in their native language. Kempler et al. found that younger adults named more items than older adults did and Vietnamese individuals named more animals and Hispanic individuals produced significantly fewer animal names than did Chinese, White, and Vietnamese participants. The authors attribute this finding to the fact that Vietnamese animal names are very short (usually one syllable) and Spanish animal names tend to be longer (usually two to three syllables). Therefore, in addition to factors such as proficiency, word length may affect word retrieval during category fluency tasks. While this study did not assess language differences within bilingual participants, differences in word length may influence differences in word production across different bilingual language combinations, either within a bilingual individual or across bilingual speakers of various languages. However, unlike Kempler et al. (Reference Kempler, Teng, Dick, Taussig and Davis1998), Pekkala and colleagues (Pekkala, Goral, Hyun, Obler, Erkinjuntti & Albert, Reference Pekkala, Goral, Hyun, Obler, Erkinjuntti and Albert2009) found no difference due to word length; there were no significant differences in the total number of words produced or the number of words produced in the first 30 seconds between monolingual Finnish and English speakers on a category fluency task despite the fact that Finnish words are significantly longer than English words. There were differences in the types and frequencies of the 10 most common words produced in the animals and clothing categories. For instance, English speakers tended to name pets first and then zoo animals while Finnish speakers usually named farm animals and pets followed by zoo animals. The authors suggest that these differences are due to sociocultural variation.
Therefore, there are several factors, in addition to proficiency, that could potentially influence of degree of items in a verbal fluency. As such, word length may determine the number of words produced depending on specific categories (e.g., pets, zoo animals) but other factors including sociocultural differences may also underlie differences seen between languages that have been examined. Most studies have only compared two languages and differences may be exaggerated or underestimated depending on what two languages are being studied. A larger data sample is needed to address the issue of whether particular languages or language combinations influence lexical access across specific subcategories.
The overarching hypothesis of this study is that proficiency alters the strength of connections between the lexical and conceptual systems and affects lexical access in the context of a semantic fluency task. Thus, differences in proficiency would be another factor to consider in interpreting category fluency results in healthy and different clinical populations. Not surprisingly, studies exploring the role of proficiency more directly have had mixed results, with some suggesting that proficiency has no effect on performance and others suggesting that proficiency improves performance for some verbal fluency tasks but not all. In addition, bilingual speakers of different language combinations may also perform differently on category fluency tasks depending on the culture and the specific categories being tested. The present study investigates the roles of language combination and proficiency in lexical access via a category fluency task using a relatively large set of healthy bilingual individuals across five different language combinations: Hindi–English, Kannada–English, Mandarin–English, Spanish–English, and Turkish–English. The following are the specific questions in the study:
(1) Is there an effect of language combination on lexical access?
Based on previous studies suggesting that particular languages may play a role in lexical access, it is hypothesized that there will be differences in how speakers of each language combination perform on the category fluency task and that some groups will perform more similarly than others. For example, speakers of Hindi–English and Kannada–English should perform more similarly than speakers of Hindi–English and Turkish–English due to geo- cultural proximity.
(2) How does relative proficiency in each language relate to performance across the different groups of participants?
Based on previous studies suggesting that proficiency may play a role in lexical access, it is hypothesized that greater relative proficiency in one language will predict a greater number of items named in that language across the different language combinations.
(3) How does lexical access vary across language combinations within different categories?
Although the RHM does not make any specific predictions about differences in categories, studies examining category fluency have examined a range of categories across a range of bilingual individuals and have found subtle differences in access between categories (e.g., Rosselli., Tappen, Williams, Salvatierra & Zoller, Reference Rosselli, Tappen, Williams, Salvatierra and Zoller2009). The present study directly compares the frequently examined categories in a wide range of languages.
Based on previous studies suggesting that language combination may play a role in lexical access, it is expected that there will be differences between language combinations within the three categories of food, clothing, and animals as well as within subcategories. It is further hypothesized that clothing and animals should generate similar results across language combinations because these are taxonomic categories, while food should generate different results for various combinations due to cultural variations in the subject population.
Methods
Participants
Participants included 109 healthy bilingual individuals between the ages of 18 and 56 (mean age = 27.72 years). Inclusion criteria for participants included no history of stroke or any neurological disorders, normal or corrected to normal vision and hearing. The breakdown of participants by language combination is as follows: 14 Hindi–English speakers (average age = 26.4 yrs., SD = 2.3), 14 Kannada–English speakers (average age = 27.1 yrs., SD = 9.4), 30 Mandarin–English speakers (average age = 25.2 yrs., SD = 5.4), 29 Spanish–English speakers (average age = 23.9 yrs., SD = 7.4), and 22 Turkish–English speakers (average age = 38.3 yrs., SD = 10.2). All participants self-reported typical language development. Individuals interested in participating scheduled an appointment in the lab via phone or email. Upon arriving at the lab, they were given a copy of the informed consent and met with an investigator to review any questions or concerns they had about the study before signing the consent form. Data from Hindi–English, Mandarin–English, and Spanish–English participants were collected in Austin, Texas. Data from Kannada–English participants were collected in India and data from Turkish–English participants were collected in Turkey.
Materials and design
Language use questionnaire
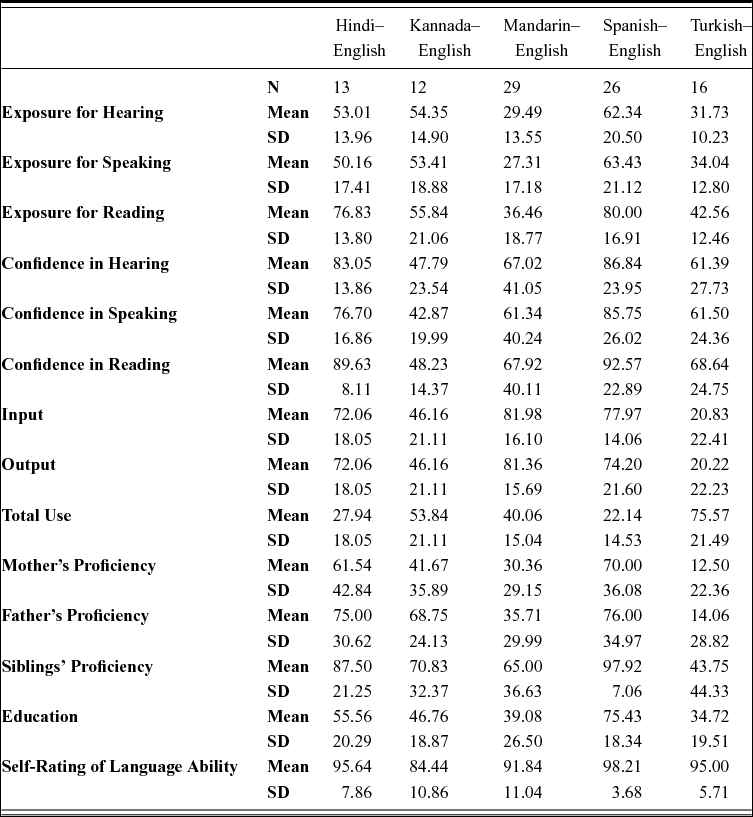
All participants completed an extended language use questionnaire (Kiran, Peña, Bedore & Sheng, Reference Kiran, Peña, Bedore and Sheng2010, see Tables 1 and 2 for breakdown of details regarding language use by group). The 15 items on the questionnaire can be broken up into the following sections: exposure, confidence, daily use, family proficiency, educational history, and self-rating of language ability. Exposure can be further broken down into exposure for hearing, speaking, and reading. The confidence section can be separated into confidence in hearing, speaking, and reading. Daily use can be broken down into input, output, and total use. Family proficiency can also be separated into three factors: mother's proficiency, father's proficiency, and siblings’ proficiency. Educational history and self-rating of language ability were not broken down further. For all factors, scores were reported separately for English and the other languages. All data from the questionnaire were self-reported by the participants. As shown in appendix A, this questionnaire evaluates similar aspects of language proficiency as other published self-reports (Li, Sepanski & Zhao, Reference Li, Sepanski and Zhao2006; Marian, Blumenfeld & Kaushanskaya, Reference Marian, Blumenfeld and Kaushanskaya2007), but also has some unique aspects of information obtained as discussed in the results.
Means and Standard Deviations for English Language Use Questionnaire Items by Language Combination.

Means and Standard Deviations for Non-English Language Use Questionnaire Items by Language Combination.

Stimuli for the category fluency task
For the category generation task, three broad categories clothing, animals, and food and their corresponding subordinate categories were examined. The category animals is frequently assessed in semantic fluency tasks (e.g., Blumenfeld et al., Reference Blumenfeld, Bobb and Marian2016; Pekkala et al., Reference Pekkala, Goral, Hyun, Obler, Erkinjuntti and Albert2009; Rosselli et al., Reference Rosselli, Ardila, Araujo, Weekes, Caracciolo, Padilla and Solís2000) while the category foods and clothing have also been examined to a lesser extent (Gollan, Montoya & Werner, Reference Gollan, Montoya and Werner2002; Roberts & Le Dorze, Reference Roberts and Le Dorze1997). For each category, participants were asked to list items within subcategories that were selected to account for geographic and cultural differences across the different language combinations in the study. Thus, for the clothing category, subcategories included hot weather clothing and cold weather clothing. For the animals category, subcategories included zoo animals and farm animals. For the food category, subcategories included food items for lunch and food items at a birthday party. To our knowledge, our study is the first systematic examination of a set of categories and subcategories in these different language combinations.
Procedure
Participants completed the tasks across two sessions. The first session included completion of the language use questionnaire and a portion of the category fluency task. The second session included completion of the remainder of the category fluency task. The order of language and tasks was counterbalanced in two tracks, each with two sessions. Session 1 for track 1 included clothing, zoo animals, food, and farm animals in English and lunch food, hot weather clothing, animals, cold weather clothing, and birthday food in participants’ other language, as well as the language use questionnaire. Session 2 for track 1 included zoo animals, food, clothing, and farm animals in participants’ other language and cold weather clothing, lunch foods, hot weather clothing, birthday foods, and animals in English. The languages were reversed for track 2. For each category, participants were asked to list as many items as they could in a given category in one minute. All data were audio recorded and the samples were transcribed by the examiner who was a native speaker of that language.
Scoring
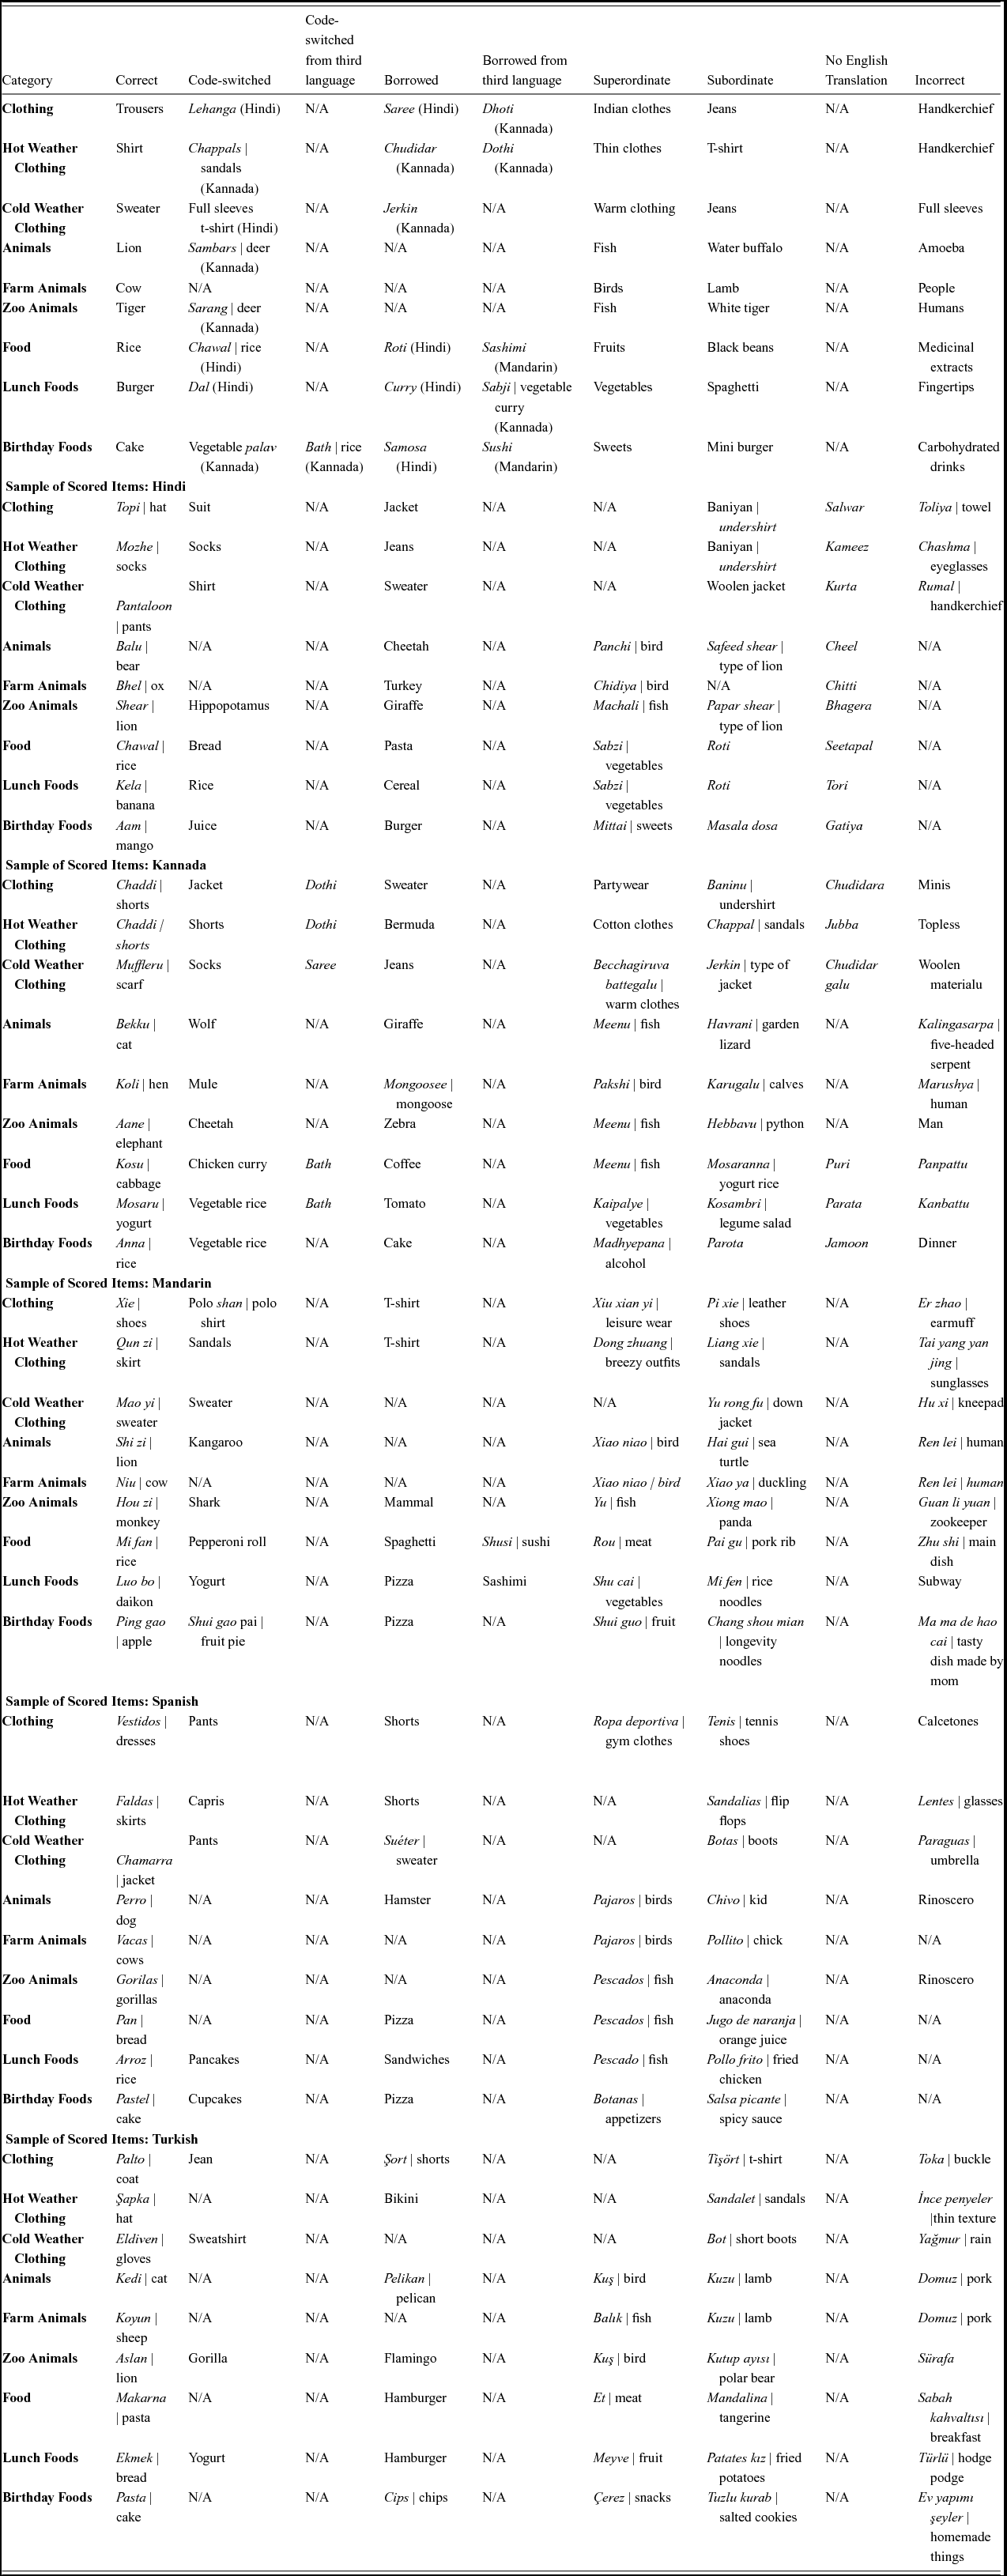
Each item was coded as one of the following: (a) correct (e.g., “tie” in the English clothing category), (b) code-switched (e.g., “bird” in the other language animals category), (c) borrowed (e.g., “taco” in the English food category), (d) superordinate (e.g., “mammal”), (e) subordinate (e.g., “polar bear,” “grizzly bear”), (f) no English translation, (g) repetition, or (h) incorrect (e.g., “ring” in the clothing category). Items including a mix of two languages (e.g., one Mandarin word and one English word) were marked as code-switched. There were also separate codes for items borrowed and code switched from a third language (e.g., “sashimi,” which is borrowed from Japanese). A monolingual speaker of English coded the scores for both English items and non-English items in consultation with a native speaker of that language. Any coding discrepancies were further checked by one of the authors in the paper based on the language at issue. A word was considered to be borrowed if no translation existed for that word. Correct items, borrowed words, superordinate items, and words without translations were scored as overall correct responses. Code-switched items, subordinate items, repetitions, and incorrect items were scored as incorrect. See Appendix A for examples of scored items in each of the language.
Statistical analysis
For research question 1, which assesses the effect of language combination on lexical access, a one-way multivariate analysis of variance (MANOVA) with the average number of correct items generated in English and the other language in the three main categories as the dependent variables and language combination as the independent variable was used.
To answer research question 2 regarding how proficiency in each language relates to performance in each language across the different groups of participants, principal component analyses (PCA) were performed to determine if any questions on the language use questionnaire loaded onto separate components. Then, a MANCOVA with the total number of correct items named in English and the other language as dependent variables, language combination as the independent variable, and each of the components extracted from the PCA entered as covariates were performed to assess whether there were differences in the number of items named based on language combination when various measures of language proficiency were controlled.
In response to research question 3 regarding the effects of language combination on lexical access within categories, a one-way MANOVA with all of the categories as dependent variables and language combination as the independent variable was conducted, first for English and then for the other language. These MANOVAs assessed differences within the main categories subcategories for each language pair group.
Results
Research question 1: Effect of language combination on performance
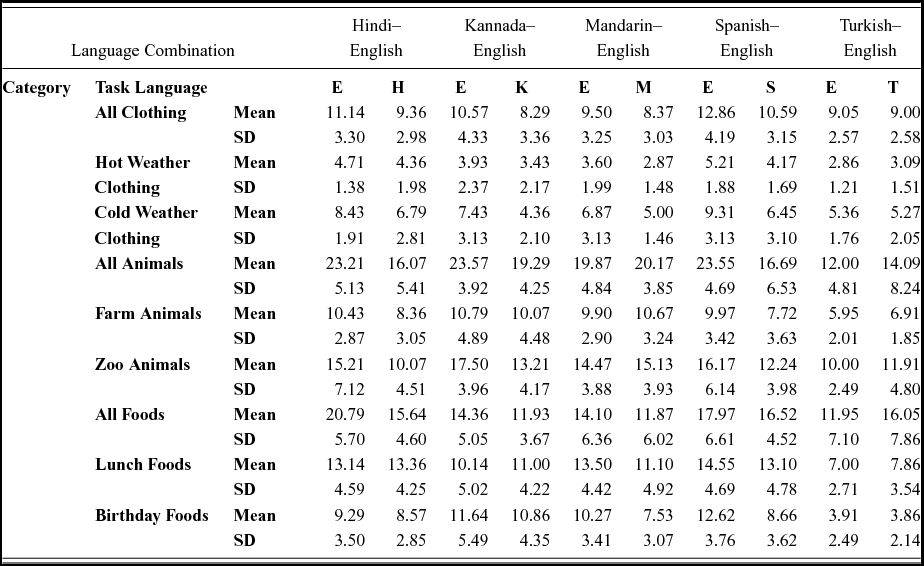
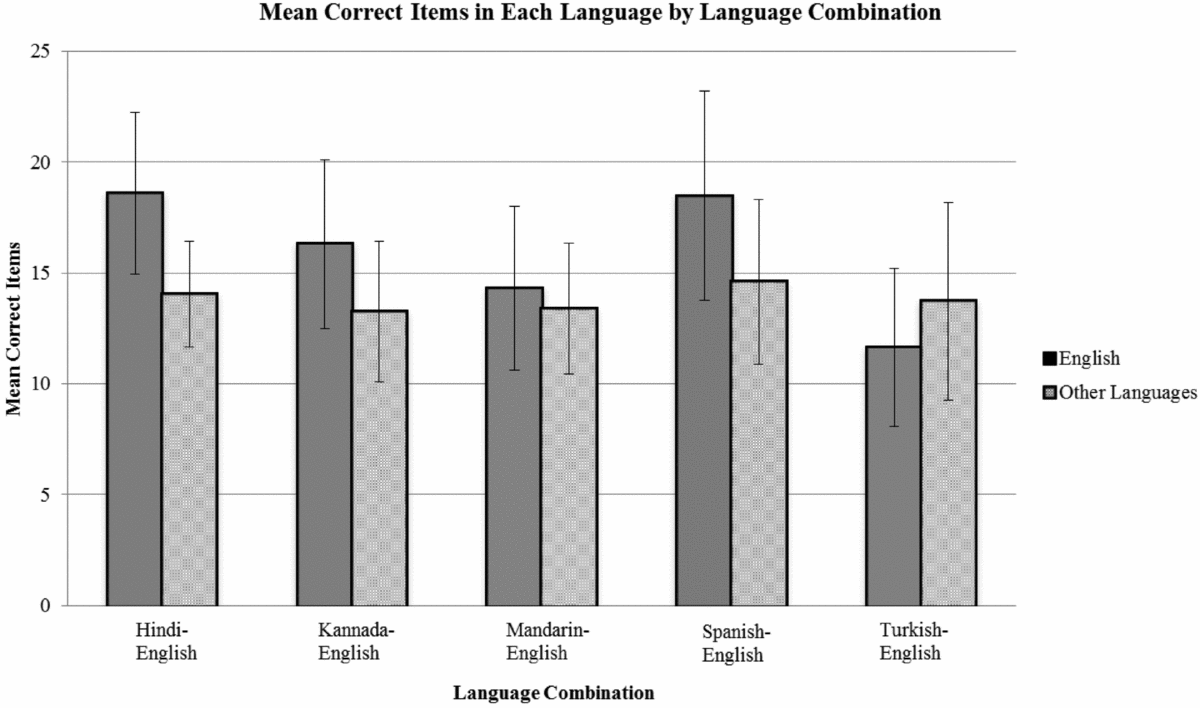
See Table 3 for means and standard deviations for correctly named items in each category and subordinate category by language combination. Results from a one-way MANOVA revealed that there was a significant difference in the average number of correct items named in English and participants’ other language (OL) based on language combination, F(8, 206) = 7.082, p < .001; Wilks’ Λ = 0.615, partial η2 = .216. The main effect of language was significant for English (F (4, 104) = 13.206, p < .001, partial η2 = 0.337) but not for participants’ other language (F (4, 104) = 0.837, p > .05, partial η2 = 0.031). Post-hoc LSD tests revealed differences between individual language combinations, speakers of Hindi–English and Spanish–English named significantly more items in English than did speakers of Mandarin–English (p < .005). Speakers of Turkish–English produced significantly fewer English words across the three main categories than did speakers of all other language combinations (p < .005) (See Figure 1).
Means and Standard Deviations by Language Combination and Category.

Note: Task language is denoted by the first letter of the language (e.g., English is denoted by “E,” Hindi is denoted by “H”).
Bar graph showing the average number of correct items named in English and Other Language for each language combination. Error bars represent the standard deviations of the means.

Research question 2: Relationship between proficiency and performance
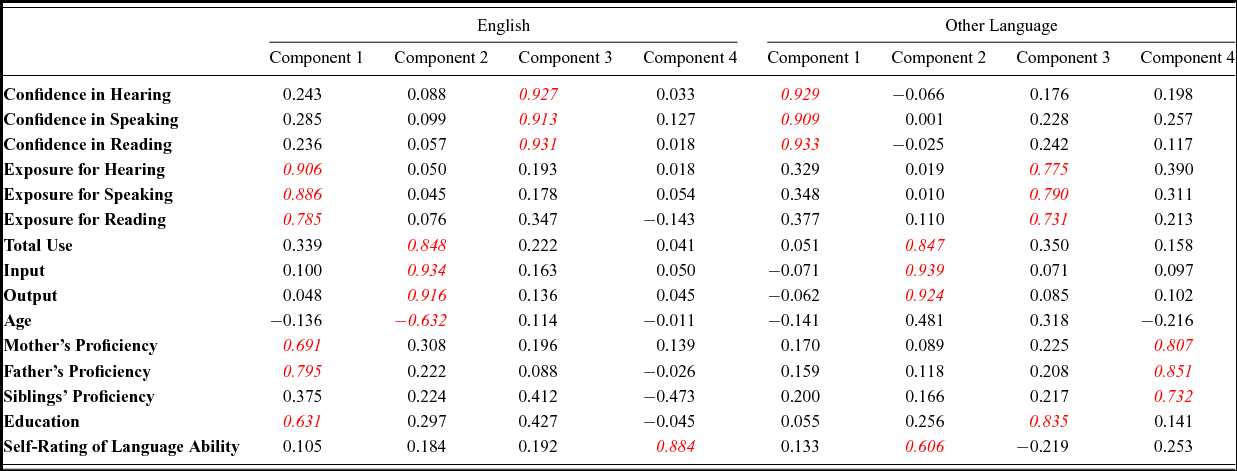
Thirteen participants (1 Hindi–English, 2 Kannada–English, 1 Mandarin–English, 3 Spanish–English and 6 Turkish–English) were dropped from the analysis of proficiency due to missing data. Based on the data shown in Table 1 and 2, a PCA was used to extract components from the 15 English scores from the language use questionnaire. As seen in Table 4, the first four components had eigenvalues greater than 1 and explained 78.58% of the variance. Component 1 explained 44.74% of the variance, Component 2 explained 15.79% of the variance, Component 3 explained 11.20% of the variance, and Component 4 explained 6.85% of the variance. A scree plot confirmed that only the first four components were meaningful. The factor loadings of the first four components were examined using a varimax normalized factor rotation. An item was considered to load onto a particular component if the factor loading was greater than 0.6. The following questionnaire scores loaded together onto Component 1: exposure to hearing, exposure to speaking, exposure to reading, mother's proficiency, father's proficiency, and education. The following questionnaire scores loaded together onto Component 2: total use, input, output, and age. Three questionnaire scores loaded onto Component 3: confidence in hearing, confidence in speaking, and confidence in reading. Self-rating of language ability loaded by itself onto Component 4.
Factor Loadings for English Language and Other Language Use Questionnaire Items.

Note: Factor loadings greater than 0.6 are italicized and highlighted.
A second PCA was used to extract components from the 15 scores in participants’ other language on the language use questionnaire. As with English, the first four components had eigenvalues greater than 1 and explained 78.69% of the variance. Component 1 explained 40.04% of the variance, Component 2 explained 21.20% of the variance, Component 3 explained 9.09% of the variance, and Component 4 explained 8.36% of the variance. A scree plot confirmed that only the first four components were meaningful. As with the English data, the factor loadings of the first four components were examined using a varimax normalized factor rotation and an item was said to load onto a particular component if the factor loading was greater than 0.6. Three questionnaire scores loaded onto Component 1: confidence in hearing, confidence in speaking, and confidence in reading. The following questionnaire scores loaded onto Component 2: total use, input, output, and self-rating of language ability. Four factors loaded onto Component 3: exposure to hearing, exposure to speaking, exposure to reading, and education. The following factors loaded together onto Component 4: mother's proficiency, father's proficiency, and siblings’ proficiency. The factor loadings for the four English and other language components are displayed in Table 4.
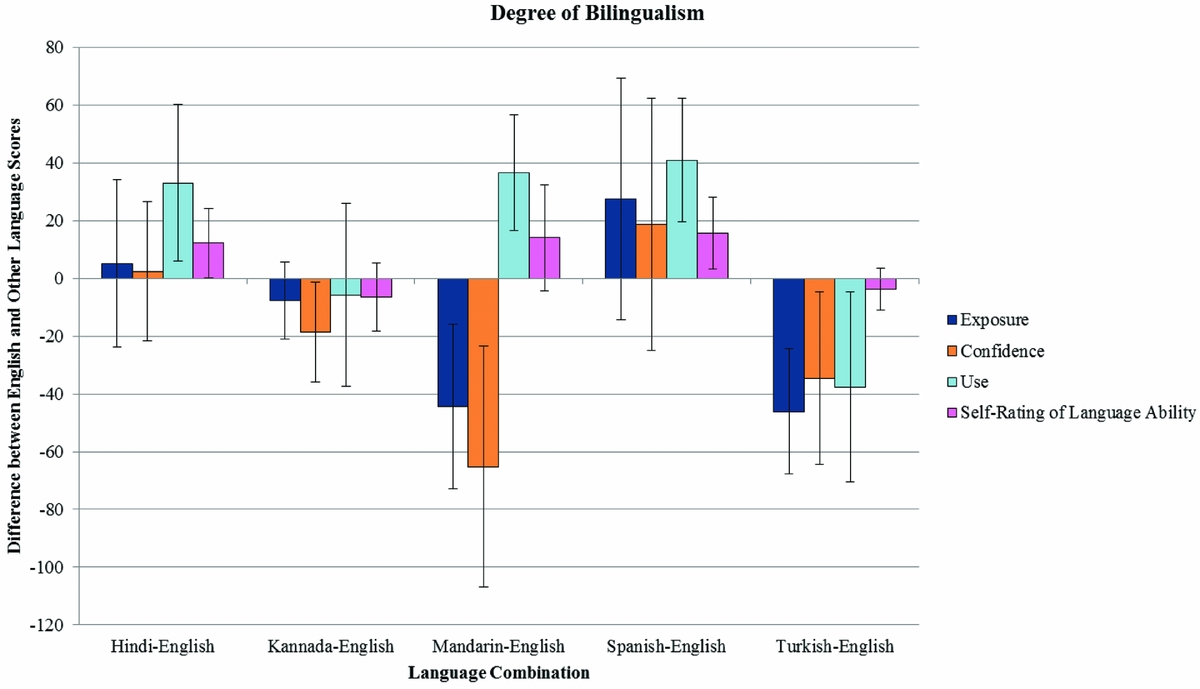
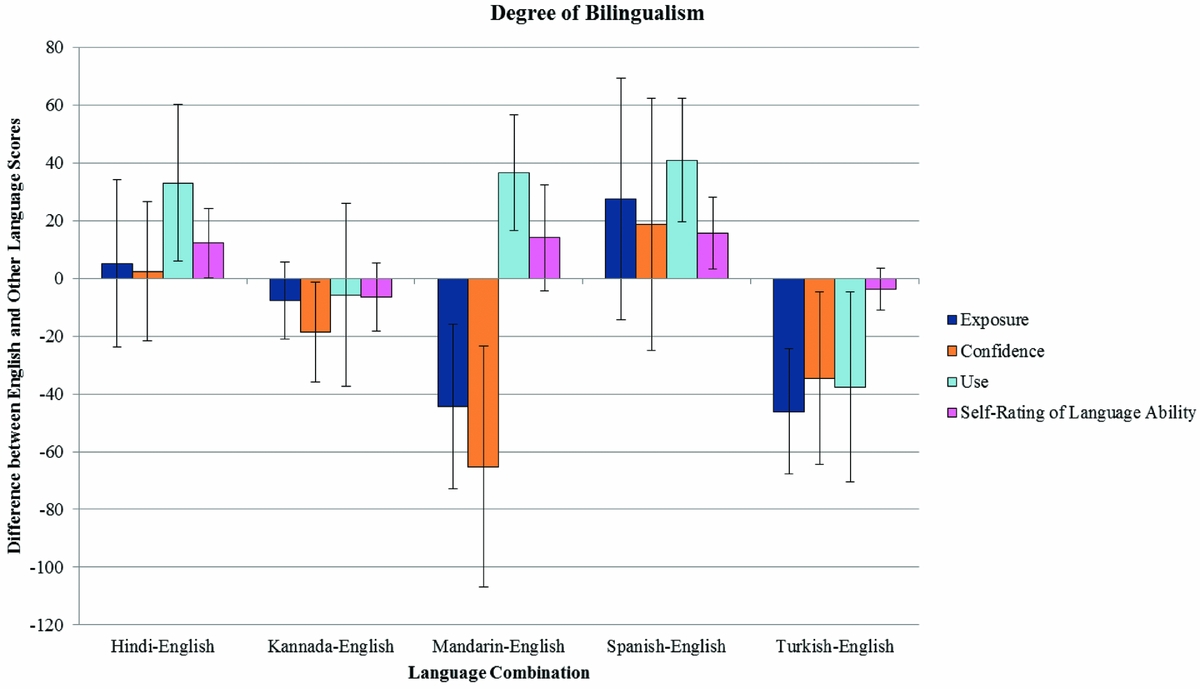
The components extracted from the analysis of the English scores were used for further analysis for two reasons: (1) the groupings of factors were similar for the English and other language scores and (2) English is the common language across participants and would allow for a more clear-cut comparison of the effect of proficiency across the different languages. Components 1, 2, 3, and 4 were renamed ‘exposure’, ‘use’, ‘confidence’, and ‘self-rating of language ability’, respectively. A composite score was created for each component by computing the difference of the averages of the English and other language scores for each variable within the component for each participant. Figure 2 displays the average degree of bilingualism of participants by language combination. As can be seen, the Hindi–English and Spanish–English were more proficient in English than the Kannada–English and Turkish–English groups. The Mandarin–English group showed somewhat mixed results; while their exposure and confidence was higher in Mandarin, the current use and self-rating was higher in English.
Bar graph showing the average relative proficiency of participants by language combination. Each bar represents one of the four components extracted from the principal component analysis. A positive bar means the group is more proficient in English on average. A negative bar means the group is more proficient in their non-English language on average.
A single MANCOVA with the average number of correct items named in English and the other language as two dependent variables and language combination as the independent variable were performed. The composite scores for each component extracted from the language use questionnaire were used as covariates in the MANCOVA, confidence, exposure, use, and self-rating of language ability all entered as covariates. The MANCOVA revealed a main effect of the language combination on task language (English vs. other language) (F (8, 170) = 1.94, p = .05; Wilks’ Λ = 0.84, partial η2 = .08), and a significant effect of the ‘exposure’ covariate on task language only (F (2, 86) = 3.4, p < .05; Wilks’ Λ = 0.927, partial η2 = .07). Importantly, the effect of the covariate was only on correct items produced in English (F (1, 87) = 4.49, p < .03; partial η2 = .04) and the covariate-corrected effect of language was also only significant for English items produced (F (4, 87) = 2.43, p = .05; partial η2 = .10). None of the other covariates (confidence, use or language ability) were significant in accounting and reducing any variance in the analysis. Therefore, language exposure had an effect on category fluency performance and when the effects of exposure were controlled for, there was still a significant effect of language combination on category fluency performance in English. Speakers of Turkish–English named fewer items in English than any other language combination even when language exposure was controlled (p <. 05).
Research question 3: Effect of language combination on performance within categories
Main categories in English
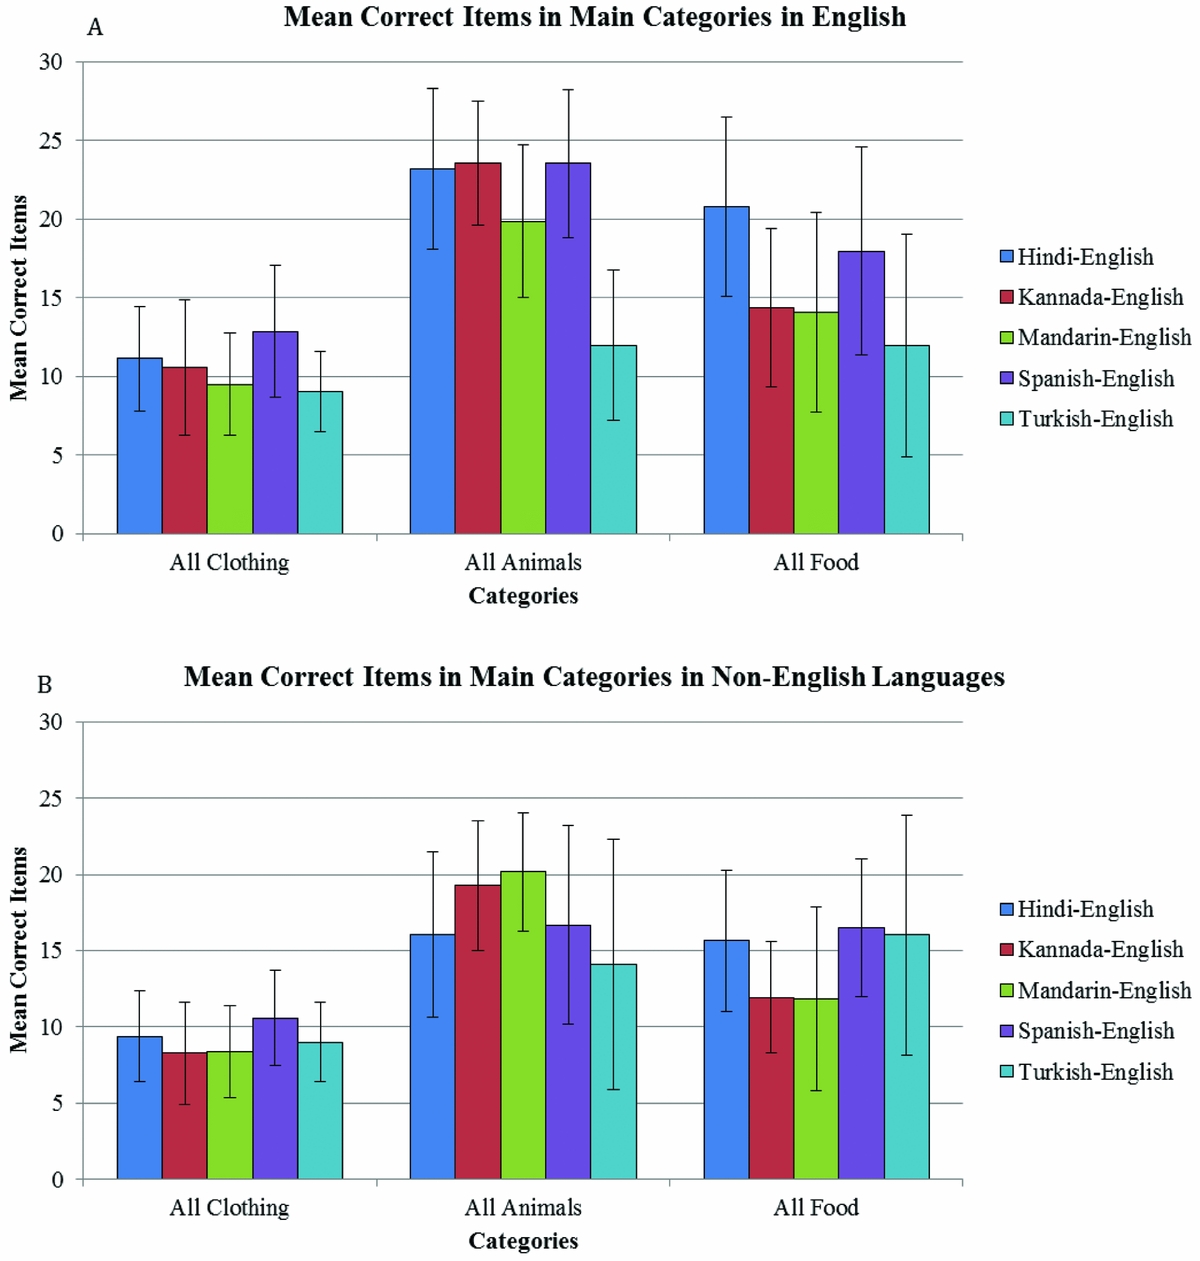
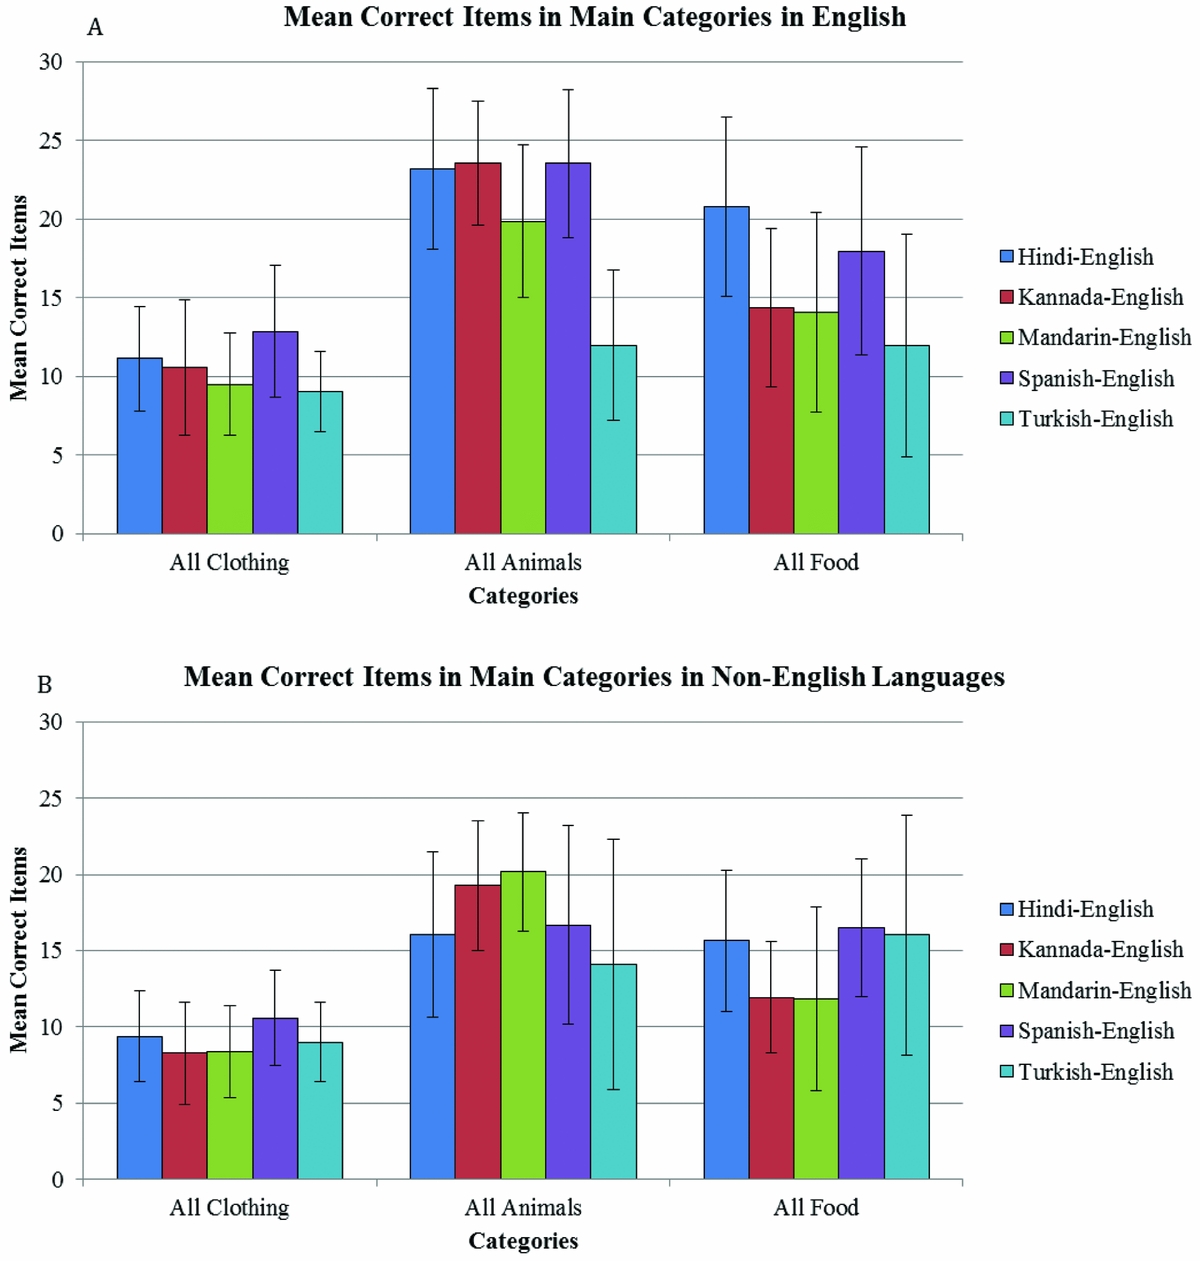
Results from a one-way MANOVA for English responses revealed that the overall effect of the total number of correct items named in English in each of the main categories was significant (F(12, 270.158) = 8.335, p < .001; Wilks’ Λ = 0.435, partial η2 = .243). The main effect for the total number of correct items named in English in each of the main categories was significant for clothing (F (4, 104) = 4.757; p = .001, partial η2 = .155), animals (F (4, 104) = 23.429, p < .001, partial η2 = .474), and food (F (4, 104) = 5.683, p < .001, partial η2 = .179). Post-hoc LSD tests revealed differences between individual language combinations. Speakers of Spanish–English performed the best, by naming significantly more correct clothing items in English than speakers of Mandarin–English and Turkish–English (p < .001). For the category animals, speakers of Turkish–English performed worse than speakers of all other language combinations (p < .001). Next, speakers of Mandarin–English also named significantly fewer correct animals in English than did speakers of Hindi–English, Kannada–English, and Spanish–English (p < .05). With regards to food, speakers of Hindi–English and Spanish–English named significantly more correct English foods than did speakers of Mandarin–English and Turkish–English (p < .05) and speakers of Hindi–English named significantly more correct English foods than did speakers of Kannada–English (p < .01). See Figure 3a for a summary of these results.
Bar graphs showing the average number of correct items named in (a) English and (b) Other Language for the main categories by language combination. Error bars represent the standard deviation of the mean.
Main categories in other languages
Results from a second one-way MANOVA for responses in participants’ other language revealed that the overall effect of the total number of correct items named in participants’ other language in each of the main categories was significant (F (12, 270.15) = 3.124, p < .001; Wilks’ Λ = 0.709, partial η2 = .108). The main effect was significant for clothing (F (4, 104) = 2.459; p = .050, partial η2 = .086), animals (F (4, 104) = 3.971, p = .005, partial η2 = .132), and food (F (4, 104) = 3.771, p = .007; partial η2 = .127). Post-hoc LSD tests revealed differences between individual language combinations. Speakers of Spanish–English named significantly more correct clothing items in their non-English language than did speakers of Kannada–English and Mandarin–English (p < .025). With regards to animals, Mandarin–English speakers named a significantly greater number of correct animals in their non-English language than did participants who spoke Hindi–English, Spanish–English, and Turkish–English (p < .04), speakers of Kannada–English were the next highest group, as they named more correct animals than did speakers of Turkish–English (p = .012). With regards to foods, speakers of Spanish–English and Turkish–English named significantly more correct foods in their non-English language than did speakers of Kannada–English and Mandarin–English (p < .04) and speakers of Hindi–English named more correct foods than did speakers of Mandarin–English (p = .043). See Figure 3b for a summary of these results.
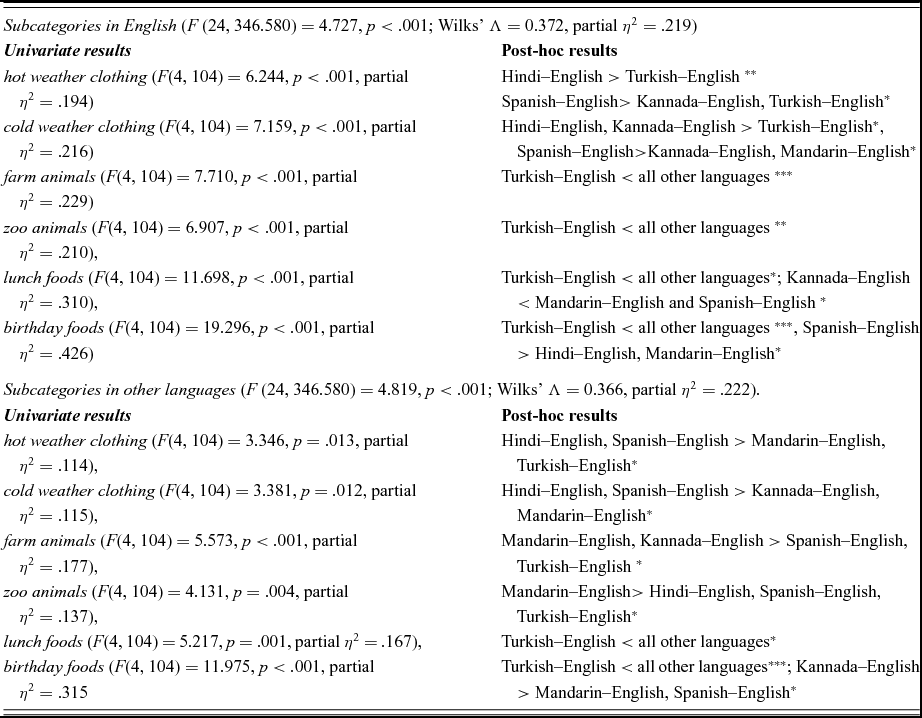
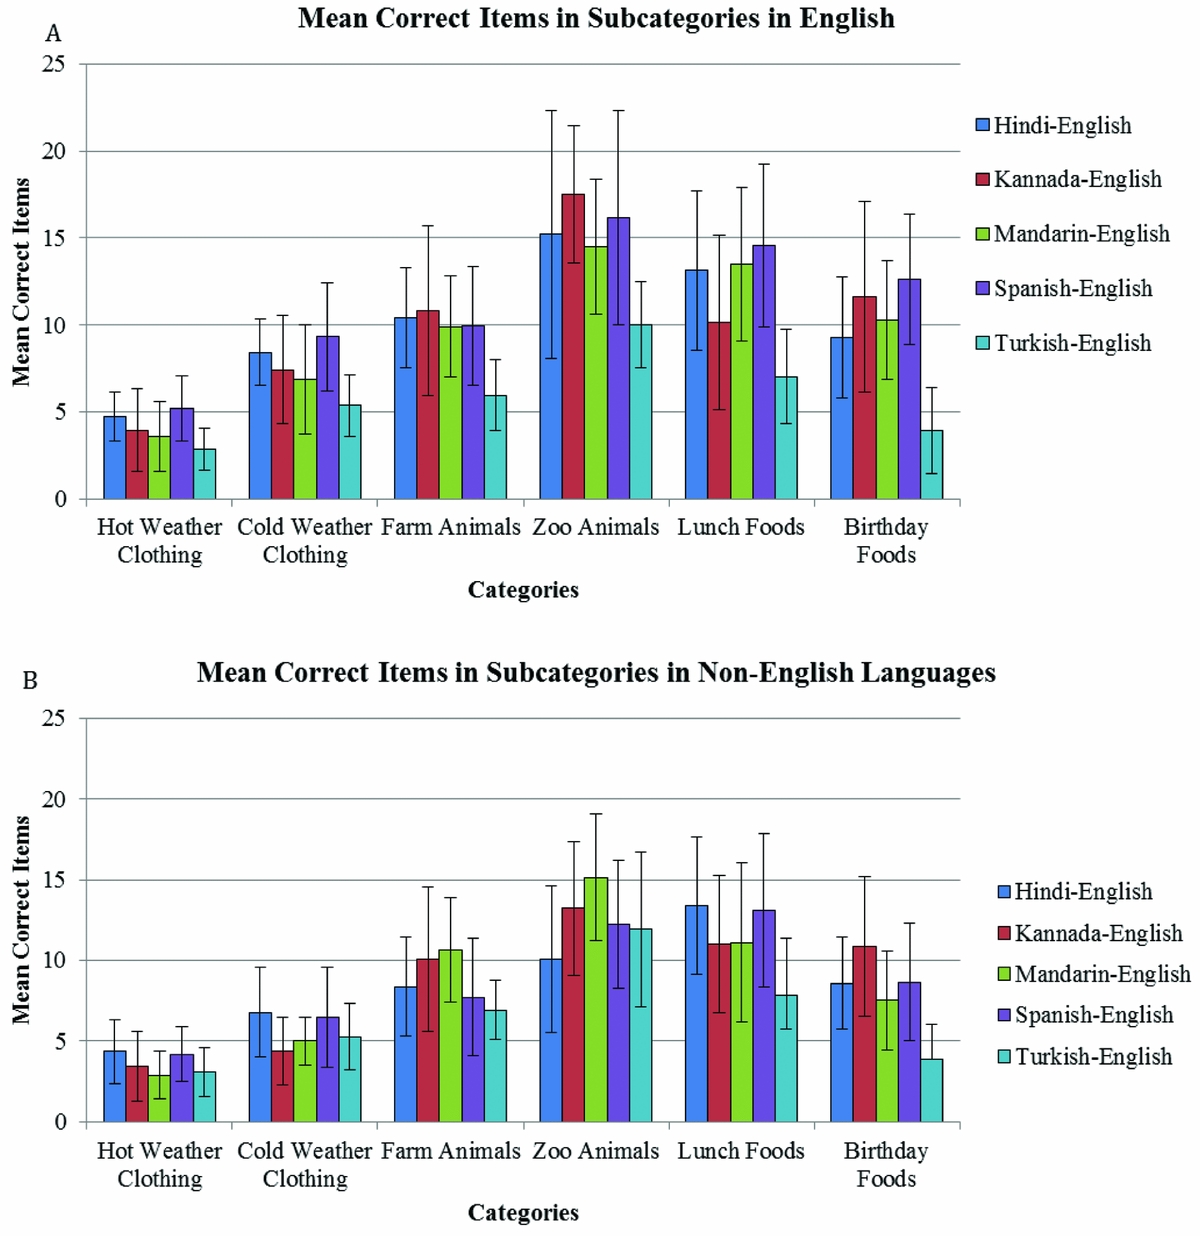
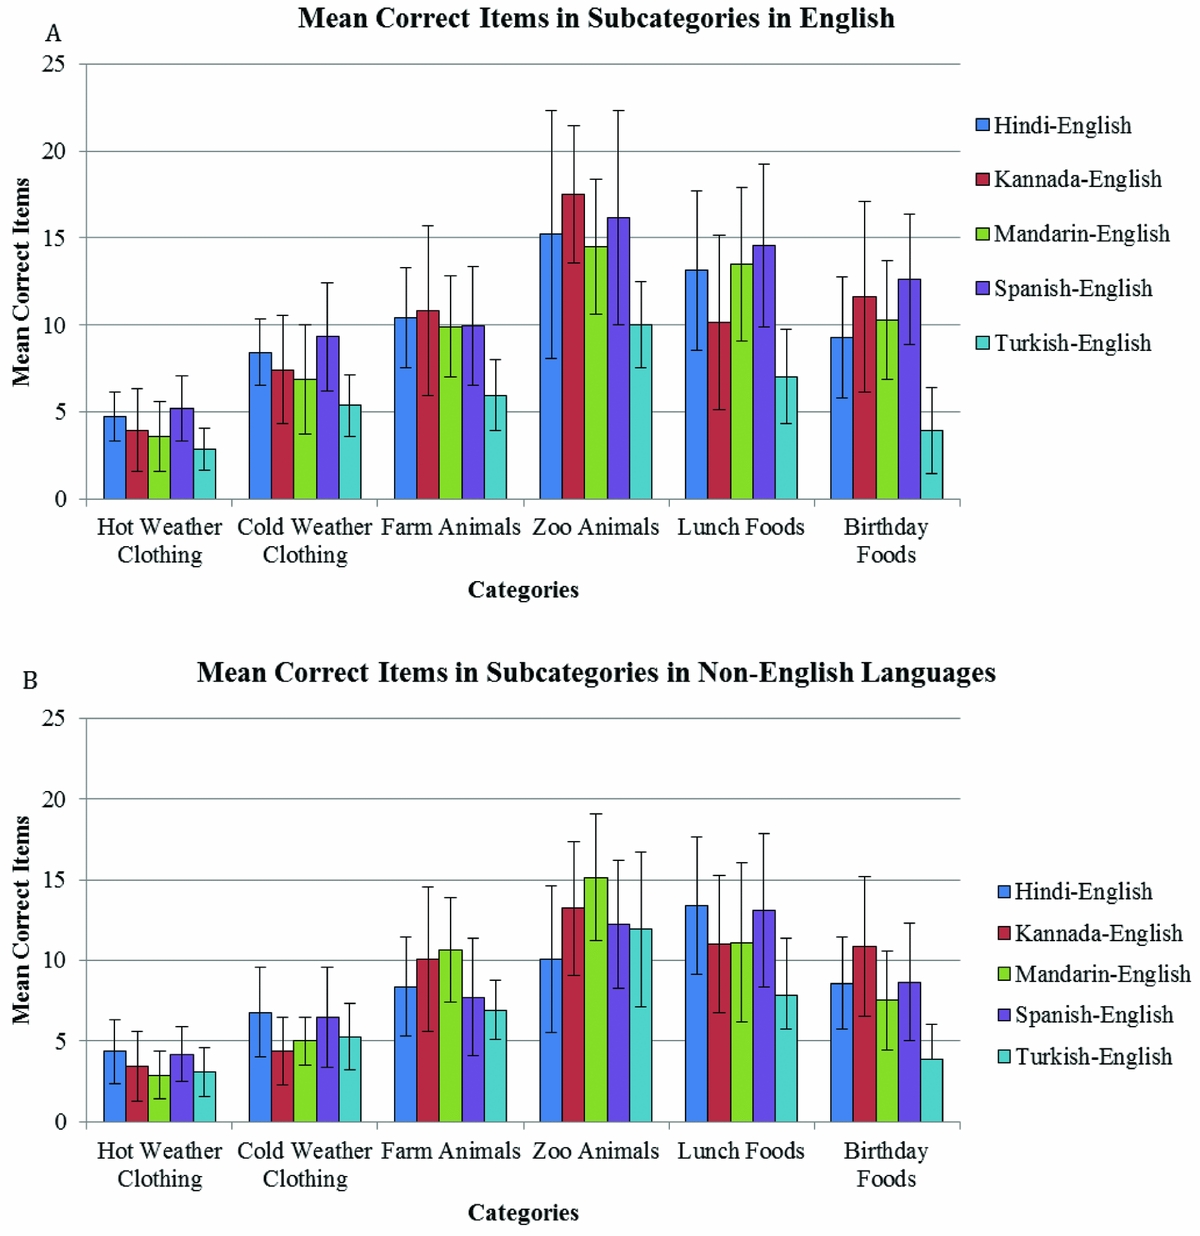
Analysis for the nine subcategories was also completed but, given the extent of the analyses, these data are summarized in Table 5 and presented in Figure 4.
Results from the MANOVA analysis for specific subcategories for English and the Other language. The main findings of the post-hoc tests are highlighted in the second column and depicted in Figures 5 and 6. * = p <.05, ** = p <.01, *** = p <001.

Bar graphs showing the average number of correct items named in (a) English and the (b) Other Language for the subcategories by language combination. Error bars represent the standard deviation of the mean.
Follow-up analyses
Follow-up analyses were run to determine if there were any differences in the numbers of incorrect items named across language combinations that may have inflated the differences between correct items, particularly those between Turkish–English speakers and speakers of all other languages. For instance, if Turkish–English participants had named more subordinate items than speakers of other languages, their correct item score would be deflated compared to the number of items they listed in total. A one-way MANOVA using language combination as the independent variable and the average number of incorrect items except for repetitions produced in each language revealed that the overall effect of the average number of incorrect items named in each language combination was significant (F(8, 206) = 13.539, p < .001, Wilks’ Λ = 0.430, partial η2 = .345). The main effect was significant for both English (F (4, 104) = 10.370, p < .001, partial η2 = .285) and the other languages (F (4, 104) = 20.907, p < .001, partial η2 = .446). However, post-hoc LSD analyses indicated that speakers of Turkish–English named significantly fewer incorrect English items than did speakers of all other language combinations (p < .03). Thus, Turkish–English speakers named fewer items overall than did speakers of the other four language combinations.
Another factor that may have influenced the differential results for Turkish–English bilinguals was participant age. The mean age for the Turkish–English bilinguals was 37 years (SD = 10) whereas the mean age for the other groups ranged between 23 to 27 years. To ensure that age wasn't the main factor for different results of the Turkish–English group relative to the other groups, a follow-up MANCOVA with the total number of correct items named in English and the other language as dependent variables, language combination as the independent variable, and language ability, use, confidence, exposure and age as covariates. Age was not a significant covariate (F (2, 85) = 1.79, p = .17; Wilks’ Λ = 0.959, partial η2 = .04) whereas exposure continued to be the only significant covariate (F (2, 85) = 3.4, p < .05; Wilks’ Λ = 0.925, partial η2 = .07). Therefore, age of the Turkish–English participant group was not significant factor in determining this group's differential performance on verbal fluency.
Discussion
The aim of the present study was to investigate the effect of language combination and proficiency on category fluency performance in a group of healthy bilingual individuals. Speakers of five different language combinations (Hindi–English, Kannada–English, Mandarin–English, Spanish–English, and Turkish–English) completed a language use questionnaire and a category fluency task in each of their languages. The following research questions were addressed: (1) Is there an effect of language combination on lexical access? (2) How does relative proficiency in each language relate to performance across the different groups of participants? (3) How does lexical access vary across language combinations within different categories? It was hypothesized that (1) speakers of different language combinations would perform differently on the category fluency task, (2) greater relative proficiency in one language would predict a greater number of items named in that language across language combinations, and (3) there would be differences between language combinations within the three categories of food, clothing, and animals as well as within subcategories.
Research question 1: Effect of language combination on performance
It was found that lexical access varied based on the language combinations that we studied. Participants who spoke Hindi–English, Kannada–English, Mandarin–English, and Spanish–English named significantly more correct items in English than did speakers of Turkish–English. The fact there were significant differences based on language combination for the English portion of the task provides a window into lexical or cultural differences based on language combination. Because English is a common language for all participants, any differences based on language combination must be due to the influence of the other language or differences in culture. An important aspect of these results is that the data for the Kannada–English and Turkish–English speakers were collected outside of the United States, while the data for the Hindi–English, Mandarin–English, and Spanish–English speakers were collected in Austin, Texas. Previous literature shows that immersion in different language environments has a dramatic effect on lexical access (i.e., Link, Kroll & Sunderman, 2009; Bice & Kroll, 2015), especially in the native language. Therefore differences, between Turkish–English bilinguals (but surprisingly not Kannada–English bilinguals) and the other groups, may have been driven by the environments in which the participants were tested.
Because subordinate items were scored as incorrect in this study, it is possible that participants’ scores were deflated and that they had access to more words than were counted in the analysis. This was a particular concern for the Turkish–English group, who scored lower than all of the other languages in English production. To account for this, a follow-up analysis assessing whether there were differences in the number of incorrect items (other than repetitions) named by speakers of each language combination was completed. Turkish–English speakers named fewer incorrect items in English than did speakers of all other language combinations. Thus, their correct score was not deflated by a high amount of code-switched or subordinate items. There may be something different about the way Turkish–English speakers access lexical items, that is not well-suited to a category fluency task. As the proficiency data show, the Turkish–English participants in this study were less proficient in English than in Turkish. However, they named fewer items in many of the categories even in Turkish than did speakers of other language combinations in their non-English languages. In summary, these results suggest that Turkish–English bilinguals showed differential access to items in English and Turkish on the category fluency task.
Research question 2: Relationship between proficiency and performance
The results showed that proficiency plays a role in lexical access for all participant groups. Recall that four components were extracted from the 15 scores of the language use questionnaire: exposure, use, confidence, and self-rating of language ability. These factors were then used to examine the role of proficiency in performance on the category fluency task. Results showed that relative exposure to each language accounts for some of the differences found between language combination, particularly for the Turkish–English bilinguals but only in English. The impact of exposure on lexical access was further supported using a backward stepwise regression analysis. This analysis found that the best model for predicting relative performance on the category fluency task included only relative exposure as an independent variable. This finding is not surprising because it means that the amount of exposure one has to each of one's languages has an effect on one's ability to access words in each language. Previous studies have suggested that age of acquisition affects verbal fluency performance (Poreh & Schweiger, Reference Poreh and Schweiger2002) and bilingual language performance in general (Hernandez & Li, Reference Hernandez and Li2007). The current results suggest that in addition to age of acquisition of L2, exposure to the language over the course of one's lifetime significantly determines the degree to which one can access words from common categories. None of the other proficiency variables had a significant effect on category fluency performance.
Additionally, performance on the category fluency task varied based on whether the task was completed in English or in participants’ other language and this effect varied based on both language combination and proficiency. Speakers of Turkish–English named fewer items in English than any other language combination even when language exposure was controlled. In addition, as noted above, the Turkish–English bilinguals (and the Kannada–English bilinguals) were immersed in their native L1 language. Thus, differences in proficiency, the language of the environment, and the socio-linguistic context may all be factors influencing the results. As noted before, with the exception of Turkish–English bilinguals, English was the majority status for all other language combinations. There are other studies that highlight the interaction between sociolinguistic contexts of bilingual language use (Altarriba, Reference Altarriba2003; Kohnert, Hernandez & Bates, Reference Kohnert, Hernandez and Bates1998) and the present study contributes to this narrative.
Research question 3: Effect of language combination on performance within categories
The number of correct items participants named in each category varied greatly based on language combination, although speakers of some language combinations performed more similarly than others for specific categories. In the main categories, there was no difference in the number of correct clothing items produced in both English and participants’ other language by speakers of most language combinations. However, the number of correct animals and foods varied largely in comparison to clothing. In English subcategories, there were more differences between language combinations when naming foods than when naming clothing and animals. In the other language subcategories, there were more differences between language combinations when naming birthday foods and farm animals than when naming clothing items, zoo animals, or lunch foods. Cultural differences may play a role in the greater variation in the number of items named in food categories across language combinations because food has such a strong cultural significance. An early study by Ronch, Cooper, and Fishman (Reference Ronch, Cooper and Fishman1969) found that Yiddish–English speakers who participated in a word naming task performed better in Yiddish than in English when naming items related to culture and a Passover Seder, better in English when naming words related to the home, and equally well in both languages when naming words related to the neighborhood and work. These results suggest that categories and items that are culturally salient (such as food) result in a greater degree of variation across language combinations than most of the other categories.
Additionally, although Roberts and Le Dorze (Reference Roberts and Le Dorze1997) did not find differences in the number of animals named by French–English bilinguals in each of their languages, they did find that participants produced significantly longer semantic associations and a greater percentage of words in semantic associations in French than in English. In the present study, subordinate items were classified as incorrect and were not included in the total number of correct items named in each category. Semantic associations are likely to include subordinate items (e.g., “polar bear,” “brown bear,” “grizzly bear”). Although analyses for the number of incorrect items named in each category were not completed, there were differences in the number of correct items named across categories based on language combination. Thus, differences in the number of incorrect items may have increased the differences in the total number of items named in the animals category across language combinations. Differences in the number of animals named across language combinations may also be due to geographic variation. Carneiro, Albuquerque, and Fernandez (Reference Carneiro, Albuquerque and Fernandez2008) noted that the norms for category generation might be influenced by both culture and geographic region; for this reason, separate norms may need to be developed for different regions and cultures. While culture and geography often coincide, it is possible for the two to be separated because when people move, they often take aspects of their culture with them.
The present results can be reconciled with the RHM model for bilingual lexical access. Recall that the RHM predicts that as proficiency in a language increases, the conceptual link between the language and the concept strengthens (Kroll & Stewart, Reference Kroll and Stewart1994). While performing category fluency task, if one is not highly proficient in L2, he or she may need to use the conceptual link from the concept to L1 and then the lexical link from L1 to L2 to name the item. As proficiency increases and the connection between L2 and the concept strengthens, one can take a faster route directly from the conceptual system to the word in L2. In the present study, Mandarin–English speakers named fewer items in English than Spanish–English speakers did, but they also had less exposure to English than did the Spanish–English bilinguals. Thus, the Mandarin–English speakers may have needed to use a route from the concept to the Mandarin lexical system and then use a lexical link to translate from Mandarin to English to access an English word while the Spanish–English speakers could use a route directly from the conceptual system to the English word. Notwithstanding the different language combinations examined in the present study, RHM adequately accounts for the proficiency-based differences in category fluency performances and is consistent with numerous other observations of the influence of relative proficiency in the two languages on bilingual language processing (Kroll, et al., Reference Kroll, van Hell, Tokowicz and Green2010).
Another unique aspect of this study is that it links a systematically derived language exposure measure to verbal fluency performance. Most studies on bilingual language processing obtain brief measures of language exposure (with some exceptions like LEAP, Marian et al., Reference Marian, Blumenfeld and Kaushanskaya2007). While these brief measures may be sufficient to obtain a measure of one's language proficiency, the present study highlights the value of obtaining detailed language exposure, history and use information that can be further distilled into relevant factors to determine aspects of proficiency that influence verbal fluency.
One limitation of this study is that it is impossible to separate cultural effects from linguistic effects. Perhaps one language combination produced more birthday food items than another did because birthday celebrations have a larger variety of food in that culture. As noted above, several studies highlight the interaction between sociocultural differences that affect qualitative and quantitative category fluency performance (Altarriba, Reference Altarriba2003; Pekkala et al., Reference Pekkala, Goral, Hyun, Obler, Erkinjuntti and Albert2009). A second limitation is that all data were coded by a single English-speaking individual and may reflect an English bias. Items that are considered subordinate in English may be basic in another language. Contrastingly, the fact that there was a single scorer also provides a degree of consistency of scoring across the data set, although reliability was not statistically established. A final limitation is the unequal number of participants in each language combination. While the current sample was reasonably large, this study should be replicated with a larger sample size and with groups of equal sizes.
Future directions
The current study focused on the quantitative differences in category fluency production based on language combination and category. Future studies should investigate the qualitative differences such as whether speakers of certain languages name more subordinate items than speakers of another language. Future studies may also wish to investigate differences in degree of code-switching based on language combination as well as effects of word length on lexical access. Another direction for this study is to create a set of category fluency norms for bilingual speakers of various languages. Category fluency is often used as a diagnostic tool for people with aphasia and cognitive disorders (Tombaugh, Kozak & Rees, Reference Tombaugh, Kozak and Rees1999). However, there are no norms for category fluency for bilingual speakers of most language combinations: this means there is no basis for comparison when a speaker of one such language is assessed using category fluency.
Conclusions
The results of this study suggest that bilingual lexical access varies based on language combination. Even in the same language, speakers of different language combinations produced different numbers of items. Proficiency, particularly the degree of exposure to each language, also plays a role in lexical access as shown by the fact that relative exposure significantly predicted relative performance on the category fluency task. Category fluency performance is also affected by the language and category in which the task was completed.
Appendix A Language Use Questionnaire
Participant Name _____________________ Age _____ Date ____/____/_____
Clinician Name ____________________
Person interviewed and relation to participant _____________________________
Language Use Questionnaire
This questionnaire is related to the amount of English and your other language (specify) ________________ you have been exposed to in your life.
1. At what age did you acquire your second language? ___________
2. What percent of the time did you speak English and your other language?
_____% English _____% other language
Daily Usage
Directions: For activity, include what you were engaged in (e.g., breakfast, work, etc) during your regular day. For partners, include who was interacting with you in the given activity (e.g., mother, grandfather, siblings, etc.). For language(s), use O for Other language, E for English, B for both.
Home Language Profile/Routine: WEEKDAY

Daily Usage
Directions: For activity, include what you were engaged in (e.g., breakfast, work, etc) during your regular day. For partners, include who is interacting with you in the given activity (e.g., mother, grandfather, siblings, etc.). For language(s), use O for Other language, E for English, B for both.
Home Language Profile/Routine: WEEKEND

Family Proficiency
Directions: Write the age intervals (in years) of when your parents have lived in the countries stated below. If they have lived all their life in one country, please indicate which country.

Directions: Please rate the ability of the following people in each language. Specify the other language____________________________.

Educational History
How many years of education have you had? ___________________

Were you taught in any additional languages? YES NO
If so, which language(s)?
Have your language use patterns changed in the last five years? If yes, how?
Lifetime Exposure
Directions: For the following age ranges, please select which language you heard, spoke and read the most. For example, if you indicate you heard English 75% of the time in the age range of 6–9, it means that you heard the other language the remaining 25% of the time. If you were exposed only to one language in a specific age range, please select the 100% box for that language.


Confidence
Directions: For the following age ranges please indicate which language gave you the most confidence when speaking, hearing and reading it. Confidence does not mean the language you used the most. It means the language that gave you the most self-confidence when speaking, listening or reading. For example, it might be possible that between 9–12 years of age you heard English at school and your other language at home. However, you felt more self-confident when hearing your other language than English. If you were exposed to only one language in a specific age, answer for the exposed language only.


Language Ability Rating
Before Stroke
We would like to understand how comfortable you were in English and your other language before your stroke. Please circle the number (1-5) that best represented your ability to communicate in each speaking and listening situation. Please see the number descriptions below:
1. I am non-fluent and speak at the single word level.
2. I use phrases to communicate. I understand short sentences. I understand and can use common expressions, greetings, and simple requests.
3. I can participate in simple one-on-one conversation. I communicate primarily using concrete sentences. I do not use elaborate tense changes of grammar when speaking. I can read directions, fill out forms, read medications and bus schedules, etc. My comprehension is better when competing distractions are not present, e.g. loud background noise.
4. I can participate in complex conversation, e.g. about detailed opinions, information, politics. I incorporate complex tense changes when speaking. I understand detailed descriptions or instructions, talk on the phone with ease, can follow dialogue in a movie, read newspapers and magazines with ease.
5. Native fluency. I speak this language like my first language. I can explain a concept in multiple ways, I have metacognition (you know grammar is correct because it “sounds” right); I have a rapid, automatic speech rate with minimal word retrieval problems. I understand the majority of idioms, slang, and proverbs.

Sample of Scored Items: English