Clostridioides difficile is the most common pathogen causing healthcare-associated infections (HAIs) in the United States. Reference Magill, O’Leary and Janelle1 Frequent and inappropriate antibiotic use drives increases in Clostridioides difficile infection (CDI). Reference Magill, O’Leary and Janelle1–Reference Kazakova, Baggs and Yi3 Due to reported changes in both inpatient and outpatient antibiotic use during 2020, we assessed trends in community-onset CDI (CO-CDI) and hospital-onset CDI (HO-CDI). Reference Rose, Baggs and Wolford4,Reference King, Lovegrove and Shehab5 In addition, we have described inpatients diagnosed with CDI, facility-level testing rates, and percent positivity during 2020 compared with 2019 in a large cohort of US hospitals. We used an interrupted time series (ITS) design to assess whether changes in CDI trends corresponded with changes in healthcare delivery starting in March 2020 when the COVID-19 pandemic began in the United States. Reference Hartnett, Kite-Powell and DeVies6–Reference Heist and Butler9
Methods
We conducted a retrospective cohort study using adult and pediatric inpatient records from hospitals included in the Premier Healthcare Database, Special Release (PHD-SR) (May 31, 2021) from January 1, 2019–December 31, 2020. The PHD-SR contains records for all inpatients discharged from participating acute care, general, nonfederal US hospitals. 10 Inpatient discharge records included diagnostic and procedure codes, demographic information, admission and discharge dates, and facility characteristics. Inpatient billing records were used to identify tests and treatment. Hospitals in our cohort reported at least 1 inpatient discharge and patient day (PD) each month from January 2019–December 2020 and hospitals with incomplete reporting of inpatient discharges, PDs, or C. difficile testing (based on billing records) were excluded.
Within the hospital cohort, we identified inpatients diagnosed with CDI, which we defined as hospitalizations with an International Classification of Diseases, Tenth Revision, Clinical Modification (ICD-10-CM) primary or secondary diagnosis code indicating enterocolitis due to Clostridioides difficile (A04.71 or A04.72) and inpatient treatment with metronidazole (parenteral or oral), fidaxomicin, or vancomycin (oral) during January 2019–December 2020. Reference Kazakova, Baggs and McDonald2,Reference Kazakova, Baggs and Yi3 For this cohort, we described demographic characteristics and CDI antibiotic therapy stratified by epidemiology classification (community-onset, hospital-onset) and year. Nonincident CDI, defined as inpatients with an admission in the same facility within the previous 30 days, were excluded.
CO-CDI hospitalizations were defined as those with a CDI diagnosis code in the primary diagnostic position and inpatient treatment initiated any time during the hospitalization. HO-CDI hospitalizations were defined as those with a CDI diagnosis code in any secondary diagnostic position and inpatient treatment initiated after admission on hospital day 4 or later. Reference Kazakova, Baggs and McDonald2,Reference Kazakova, Baggs and Yi3
We also described facility-level C. difficile testing rates among our cohort of hospitals. Use of nucleic acid amplification testing (NAAT) was assessed using inpatient charges for C. difficile tests, and each test was categorized as NAAT if its description contained the term “NAAT,” “PCR,” “amplified,” or “DNA.” All other tests for C. difficile were categorized as “non-NAAT.” Reference Kazakova, Baggs and Yi3 For inpatients who were tested more than once for C. difficile, we included their first C. difficile test during the hospitalization. Testing for C. difficile was categorized based on the hospital day on which the test was obtained (tests obtained prior to hospital day 4 or on hospital day 4 or later).
We estimated monthly incidence rates of CO-CDI per 10,000 discharges, HO-CDI per 10,000 PD, and C. difficile testing rates per 10,000 discharges by facility from January–December of 2019 and 2020 and compared monthly differences of the rates of CDI, C. difficile testing, and percent positivity between years. Median differences in the rates of CDI, C. difficile testing, and percent positivity were calculated for each month, and the Wilcoxon signed-rank test was used to evaluate statistical significance; P < .01 was considered significant.
Using ITS, we conducted segmented regression analyses using multivariable generalized estimating equation (GEE) negative binomial models to describe level and trend changes in CO-CDI and HO-CDI rates before and after the COVID-19 pandemic began in March 2020. In the models we included a monthly trend parameter, an indicator for the period after March 2020, and an interaction term between the trend and indicator parameters. Reference Wagner, Soumerai, Zhang and Ross-Degnan11,Reference Penfold and Zhang12 The models estimated effects for a baseline rate of trend from the monthly trend parameter, a level change in the rate in March 2020 from the indicator parameter, and the change in the rate between the baseline and follow-up periods from the interaction term. The models adjust for patient population and hospital characteristics. Collinearity and confounding were assessed for patient and hospital characteristics to develop final models for each outcome. The modeled outcome for the CO-CDI model was the number of events, offset by the natural log of the number of discharges. The CO-CDI model was adjusted for calendar month, the percentage of patients aged ≥65 years, the percentage of patients admitted from skilled nursing facilities, percentage of patients of Hispanic ethnicity, the percentage of patients of White race, the percentage of patients of Black race, mean hospital length of stay, the patient case-mix index (not including births), and the NAAT use category based on the proportion of NAAT tests used in each hospital month. Categories of NAAT use were defined based on tertiles of the proportion of NAAT test use as follows: no/low use (hospital months with 0.0%–4.8%), intermediate use (hospital months with >4.8% and <100.0% NAAT test use), and NAAT use only (hospital months with 100.0% NAAT test use). For the HO-CDI model, the modeled outcome was the number of events, offset by the natural log of the number of patient days. The HO-CDI model was adjusted for percentage of patients aged 50–64 years, percentage of patients admitted from skilled nursing facilities, mean hospital length of stay, hospital bed size category, US Census division, CO-CDI rate, and NAAT use category.
We used logistic regression events/trials models with an ITS design to assess level and trend changes in the proportion of positive tests for C. difficile before and after March 2020 stratified by day a test was obtained (before hospital day 4 and hospital day 4 or later). Clostridioides difficile testing results were not available in the data source, but one can infer that hospitalized inpatients receive treatment for CDI based on a positive test result. Thus, we calculated percent positivity as the number of inpatients diagnosed with CDI over the total number of discharges with a test for C. difficile. The logistic model for the proportion of positive tests for C. difficile obtained prior to hospital day 4 was adjusted for month, the percentage of patients aged ≥65 years, the percentage of patients aged 50–64 years, the percentage of patients of male sex, the percentage of patients of Hispanic ethnicity, case mix index (not including births), hospital teaching status, and NAAT use category. The logistic model for the proportion of positive tests for C. difficile obtained on hospital day 4 or later was adjusted for month, case-mix index (not including births), and CO-CDI rate.
This activity was reviewed by CDC and was conducted consistent with applicable federal law and CDC policy (See eg, 45 CFR part 46; 21 CFR part 56; 42 USC §241(d), 5 USC §552a, 44 USC §3501 et seq.). All data were analyzed using PySpark software (Python) on the Data Collation and Integration for Public Health Event Response (DCIPHER) platform and SAS version 9.4 software (SAS Institute, Cary, NC). Due to the number of hypothesis tests and to guard against type 1 error, we set α at 0.01.
Results
Among 775 hospitals included in our analysis, most were nonteaching (72.5%) and located in urban settings (67.9%), with 0–99 beds as the most common bed size category (31.6%) and 749 (96.6%) reporting at least 1 inpatient with CDI during the study period (Table 1). We identified 47,658 inpatients diagnosed with CDI during January 2019–December 2020. CO-CDI represented 55.0% of all incident CDI (Table 2). In 2019, a total of 26,450 inpatients with CDI were identified in our hospital cohort with a rate of 34.7 per 10,000 discharges compared with 21,208 inpatients with CDI identified in 2020 with an overall rate of 30.5 per 10,000 discharges (Table 1). The rate of CO-CDI per 10,000 discharges was 20.0 in 2019 compared with 15.8 in 2020 (P < .0001) (Table 1 and Supplementary Appendix Table S1 online). Rates of HO-CDI per 10,000 PD were similar between years: 3.3 in 2019 compared with 3.2 in 2020 (P = .0163).
Characteristics and CDI Rates Among Hospital Cohort

Note. CDI, Clostridioides difficile infection; CO-CDI, community-onset CDI; HO-CDI, hospital-onset CDI.
a Of 775 hospitals included in our analysis, 749 (96.6%) reported at least 1 CDI case during the study period; 692 reported pediatric data (89.3%) and 3 were children’s hospitals (0.4%).
b The PHD-SR defines urban settings as areas whose core census blocks have a population density of at least 1,000 people per square mile, and surrounding census blocks have an overall density of at least 500 people per square mile; areas that did not meet this definition were considered rural. 25
c Rate per 10,000 discharges.
d Inpatients diagnosed with CO-CDI were defined as those with an ICD-10-CM diagnosis code of A04.71 or A04.72 in the primary diagnostic position and inpatient treatment with metronidazole (parenteral or oral), fidaxomicin, or vancomycin (oral) initiated during the hospitalization.
e Rate per 10,000 patient days.
f Inpatients diagnosed with HO-CDI were defined as those with an A04.71 or A04.72 ICD-10-CM diagnosis code in any secondary diagnostic position and inpatient treatment with metronidazole (parenteral or oral), fidaxomicin, or vancomycin (oral) initiated after admission on hospital day 4 or later.
Inpatients Diagnosed with CDI by Epidemiology Classification and Year, 2019–2020

Note. CDI, Clostridioides difficile infection; CO-CDI, community-onset CDI; HO-CDI, hospital-onset CDI; SNF, skilled nursing facility; ICF, intermediate care facility; IQR, interquartile range; LOS, length of stay; DOT, days of therapy.
a Inpatients diagnosed with CO-CDI were defined as those with an ICD-10-CM diagnosis code of A04.71 or A04.72 in the primary diagnostic position and inpatient treatment with metronidazole (parenteral or oral), fidaxomicin, or vancomycin (oral) initiated during the hospitalization.
b Inpatients diagnosed with HO-CDI were defined as those with an A04.71 or A04.72 ICD-10-CM diagnosis code in any secondary diagnostic position and inpatient treatment with metronidazole (parenteral or oral), fidaxomicin, or vancomycin (oral) initiated after admission on hospital day 4 or later.
c Patients may have received >1 medication during their hospitalization and therefore percentages may be >100% when summed.
d 1 DOT represents the use of a single antibiotic on a given day regardless of the no. of doses or dosage strength.
Most inpatients diagnosed with CDI in our study were female (range, 51.5%–64.3%) and aged 65 years or older (range, 58.6%–60.6%) (Table 2). The mortality rate was higher among inpatients with HO-CDI compared with those diagnosed with CO-CDI in both 2019 (8.7% vs 1.2%, respectively) and 2020 (10.7% vs 1.2%, respectively). The mean length of stay (LOS) of inpatients with CO-CDI was 5.5 days in both 2019 and 2020. Inpatients with HO-CDI had a mean LOS of 18.7 days in 2019 and 19.2 days in 2020. Most CO-CDI in both years occurred in a nonteaching hospital, whereas most HO-CDI occurred in teaching hospitals. A higher proportion of inpatients with HO-CDI were from hospitals with ≥500 beds in 2019 and 2020 (41.1% and 38.7%, respectively) compared with CO-CDI (27.7% and 26.9%, respectively).
Among inpatients diagnosed with CO-CDI and HO-CDI in 2019 and 2020, vancomycin was the most commonly used medication during hospitalization (range, 86.9%–90.6%), followed by metronidazole (range, 35.0%–53.5%) and fidaxomicin (range, 4.4%–8.9%) (Table 2). The proportion of inpatients with CDI who received metronidazole or fidaxomicin was higher among CO-CDI cases (49.8%–53.5%, 8.6%–8.9%, respectively) compared with HO-CDI cases (35.0%–38.8%, 4.4%–4.6%, respectively) in both years. The mean first day of treatment following admission among inpatients with CO-CDI was 1.3 days in 2019 and 1.4 days in 2020. Among inpatients with HO-CDI, the mean first day of treatment following admission was 9.6 days in 2019 and 9.9 days in 2020.
We identified 274,041 tests for C. difficile in 2019 and 234,992 in 2020 (Table 1). The overall rate of C. difficile testing obtained prior to hospital day 4 in 2019 was 239.6 per 10,000 discharges compared with the 2020 rate of 214.8 per 10,000 discharges (P < .0001) (Supplementary Appendix Table S1 online). In 2019, the overall rate of C. difficile testing obtained on hospital day 4 or later was 119.4 per 10,000 discharges and 122.8 per 10,000 discharges in 2020 (P < .0001).
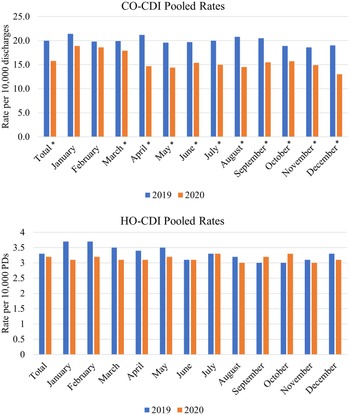
Pairwise comparisons between 2019 and 2020 showed significantly lower total and monthly median CO-CDI rates in March–December (Fig. 1 and Supplementary Appendix Table S1 online). Total and all monthly C. difficile testing rates for tests obtained before hospital day 4 were significantly lower in 2020 than in 2019. We also observed a decline in total and monthly median CO-CDI percent positivity in 2020 compared to 2019 (P < .0001) (Supplementary Appendix Table S2 online).
Pairwise differences in total and monthly facility-level CO-CDI and HO-CDI rates, January 2019–December 2020. *Indicates a statistically significant facility-level median difference in rates at P < .01.

Pairwise comparisons of total and monthly median HO-CDI rates per 10,000 PDs did not show significant differences between 2019 and 2020 (P = .0163) (Fig. 1, Supplementary Appendix Table S1 online). During January–February, median C. difficile testing rates for tests obtained on hospital day 4 or later were lower in 2020 than in 2019. However, for the entire year, C. difficile testing rates for tests obtained on hospital day 4 or later were significantly higher in 2020 than in 2019 (P < .0001), with significant increases during April and August–December. HO-CDI percent positivity did not change in 2020 compared with 2019 (P = .3156) (Supplementary Appendix Table S2 online).
In the ITS design, decreasing monthly trends were observed in CO-CDI (−1% per month, P = .0036) and HO-CDI incidence (−1% per month; P < .0001) during the baseline period prior to the COVID-19 pandemic declaration (Table 3 and Supplementary Appendix Figs. S1 and S2 online). There was no change in trend for either measure after March 2020 (Table 3) and there were no changes in monthly trends or level shifts in CO-CDI or HO-CDI percent positivity during the study period.
Changes in CO-CDI and HO-CDI Incidence and Percent Positivity Among 775 Adult and Pediatric Acute-Care Hospitals, 2019–2020

Note. CO-CDI, community-onset Clostridioides difficile infection; HO-CDI, hospital-onset Clostridioides difficile infection; CI, confidence interval.
a Negative binomial regression; modeled outcome was the number of events, offset by the natural log of the number of discharges.
b Adjusted for month, % of patients aged ≥ 65 years, % of patients admitted from skilled nursing facilities, % of patients of Hispanic ethnicity, % of patients of White race, % of patients of Black race, mean hospital length of stay, patient case-mix index (no births), and NAAT use category.
c Logistic regression model adjusted for month, % of patients aged ≥65 years, % of patients aged 50–64 years, % of patients of male sex, % of patients of Hispanic ethnicity, patient case-mix index (no births), hospital teaching status, and NAAT use category.
d Modeled outcome was the number of events, offset by the natural log of the no. of patient days.
e Adjusted for month, % of patients aged ≥65 years, % of patients aged 50–64 years, % of patients admitted from skilled nursing facilities, mean hospital length of stay, hospital bed size category, hospital US Census division, CO-CDI rate, and NAAT use category.
f Adjusted for month, patient case-mix index (no births), and CO-CDI rate.
Discussion
Our findings suggest that despite changes in US healthcare utilization during the pandemic, there were no substantial changes in the incidence of CO-CDI and HO-CDI. In total and monthly pairwise comparisons, we detected a decrease in CO-CDI rates in 2020 compared with 2019. Segmented regression revealed decreasing CO-CDI trends prior to the pandemic, which continued after the pandemic declaration. Pairwise comparisons revealed no difference in HO-CDI incidence between 2020 and 2019. Similar to CO-CDI, though, segmented regression of HO-CDI rates revealed a decreasing trend that was present prior to the pandemic. However, this trend did not change significantly after March 2020. We further observed changes in C. difficile testing comparing 2020 to 2019.
Healthcare utilization in the United States during the COVID-19 pandemic underwent substantial changes, including a decrease in outpatient care-seeking and therefore less outpatient antibiotic use. Reference King, Lovegrove and Shehab5,Reference Patel, Mehrotra, Huskamp, Uscher-Pines, Ganguli and Barnett7,Reference Mehrotra Ateev, Linetsky David, David and Schneider Eric8 Hospital-wide inpatient antibiotic use as well as use of vancomycin and levofloxacin reportedly declined between 2019 and 2020; however, the use of certain agents including azithromycin and ceftriaxone increased between years. Reference Rose, Baggs and Wolford4 Patients were less likely to present to the emergency department (ED) and hospital admissions substantially decreased, particularly during early months of the pandemic. Reference Hartnett, Kite-Powell and DeVies6,Reference Heist and Butler9 A recent study comparing average outpatient antibiotic prescriptions during 2017–2019 with 2020 reported an estimated decline of 4%–9% in January–March 2020, with larger decreases in April and May 2020 (39% and 42%, respectively). Reference King, Lovegrove and Shehab5 Despite reports of decreased overall outpatient antibiotic use and lower-than-predicted hospital admissions during the pandemic year, we did not detect significant changes in CO-CDI and HO-CDI rates or CO-CDI and HO-CDI percent positivity trends after the pandemic began. Reference Rose, Baggs and Wolford4,Reference Heist and Butler9,Reference Allegretti, Nije and McClure13 We did, however, detect a continuation of the decreasing trend in CO-CDI rates after March 2020, which may have been influenced by these factors. Given changes in inpatient antibiotic use and healthcare utilization, the unchanged rate of HO-CDI may suggest that other factors are contributing to HO-CDI rates, such as potential changes in susceptibility of admitted patients or decreased adherence to environmental cleaning and infection prevention, particularly during non–COVID-19 patient care. Further analyses of CDI rates, including postdischarge CDI rates, throughout the different phases of the pandemic may bring insights to the drivers of hospital-associated CDI.
Although the COVID-19 pandemic led to recommendations for enhanced infection control measures including personal protective equipment use in US hospitals, many hospitals faced the challenge of inadequate PPE stock due to supply chain shortages. Reference Gondi, Beckman and Deveau14 Despite these challenges, we did not observe a change in HO-CDI incidence after the pandemic began. Reference Hawes, Desai and Patel15,16 A recent study of 148 HCA healthcare-affiliated hospitals nationwide reported that HO-CDI rates were stable during the COVID-19 pandemic and were not significantly associated with COVID-19 burden.Reference Baker, Sands and Huang 17 Another study estimating national healthcare-associated infection (HAI) standardized infection ratios (SIRs) using data from the National Healthcare Safety Network (NHSN) showed decreases in SIRs for HO-CDI laboratory-identified (LabID) events in 2020 compared with 2019 across all quarters; however, the difference decreased from quarter 1 (−17.5%) to quarter 4 (−5.5%).Reference Weiner-Lastinger, Pattabiraman and Konnor 18 Consistent with our observed HO-CDI trends before the pandemic, HO-CDI LabID event national SIRs steadily decreased from 0.63 in quarter 1 to 0.55 in quarter 4 of 2019. In 2020, the SIR remained stable at 0.52 across all quarters. Reference Weiner-Lastinger, Pattabiraman and Konnor18
In pairwise comparisons, testing rates for C. difficile changed significantly overall between 2019 and 2020. Total and monthly rates of C. difficile testing obtained prior to hospital day 4 decreased in all comparisons. Although rates of C. difficile testing obtained on hospital day 4 or later also decreased in January and February 2020, these rates then increased during five of the eight months between April and December 2020. These changes in testing do not appear to be inappropriate as we did not observe a change in percent positivity trends for C. difficile tests in the ITS study. Frequency of testing is important when interpreting trend results, particularly for CDI. Diagnostic stewardship of C. difficile testing has become increasingly important as clinicians attempt to optimize NAAT testing to reduce inappropriate diagnoses, unnecessary treatment, and facility HAI rates. Reference Solanky, Juang, Johns, Drobish, Mehta and Kumaraswamy19,Reference Kang, Abeles and El-Kareh20 Trends in C. difficile testing should be monitored because focus on diagnostic stewardship for C. difficile testing has increased. Further study is needed to assess appropriateness of C. difficile testing during the COVID-19 pandemic.
In 2018, the Infectious Diseases Society of America (IDSA) released guidelines for CDI treatment, recommending use of vancomycin or fidaxomicin over metronidazole alone. Reference McDonald, Gerding and Johnson21 In our study, <10% of all inpatients diagnosed with CDI between 2019 and 2020 were treated with metronidazole only. These inpatients were included in our study because IDSA recommendations to remove metronidazole as a first-line treatment may take time to be adopted in practice.
Our study may have been limited by the use of discharge codes to identify inpatients diagnosed with CDI because such data are mainly used for billing purposes; therefore, misclassification of the outcome is possible. We supplemented discharge codes with treatment data to increase the specificity of our case definition, and we applied a previously used definition for CDI. Reference Kazakova, Baggs and McDonald2,Reference Kazakova, Baggs and Yi3 However, misclassification in case or treatment data may still exist. Reference Bunnell, Danziger and Johnson22 Our findings are also consistent with previously reported CDI estimates from the 2019 National and State Healthcare-Associated Infections Progress Report. 23 The size of our study was a strength, unlike recent single-center and small multicenter studies of CDI rates during the COVID-19 pandemic period, our study includes 2 years of data from a consistent cohort of 775 hospitals nationwide. Reference Hawes, Desai and Patel15,Reference Lewandowski, Rosołowski and Kaniewska24
Although infection control practices, antibiotic use, and healthcare delivery changed during the COVID-19 pandemic, we did not observe a strong influence on preceding downward trends in annual CDI rates across a large cohort of US hospitals. Given the significant morbidity and mortality associated with CDI and the burden in US hospitals, ongoing monitoring of the trends in CDI as healthcare delivery returns to prepandemic levels is important to inform hospital antibiotic stewardship and infection control programs. Reference Magill, O’Leary and Janelle1
Supplementary material
To view supplementary material for this article, please visit https://doi.org/10.1017/ice.2022.69
Acknowledgments
The findings and conclusions in this manuscript are those of the authors and do not necessarily represent the official position of the Centers for Disease Control and Prevention.
Financial support
This work was funded through salary funds at the Centers for Disease Control and Prevention. The authors received no other outside funds.
Conflicts of interest
All authors report no conflicts of interest relevant to this article.