1. Introduction
Coalbed methane (CBM) is an important type of natural gas resource, and tectonics and fractures are the key factors that influence the CBM distribution (Gan, Nandi & Walker, 1972; Camac & Hunt, Reference Camac and Hunt2009; Moore, Reference Moore2012; Dai et al. Reference Dai, Ni, Huang, Liao, Yu, Gong and Wu2014; Misra & Gupta, Reference Misra and Gupta2014; Vishal, Singh & Rajnith, Reference Vishal, Singh and Ranjith2015; Ding et al. Reference Ding, Dai, Zhu, Zhang, He, Li and Wang2016; Lv et al. Reference Lv, Wang, Li, Liu and Li2017; Sun et al. Reference Sun, Zeng, Xia, Zhu and Liu2017; Vishal, Reference Vishal2017; Zhao et al. Reference Zhao, Tang, Qin, Xu, LV, Tao and Li2017; Yin et al. Reference Yin, Li, Jia, Ding and Li2018a). Sedimentation is the foundation of coal reservoir formation, while the tectonic evolution plays a role in the CBM distribution, and the palaeotectonic stress field influences the formation and distribution of fractures in coal (Close, Reference Close, Law and Rice1993; Karacan & Okandan, Reference Karacan and Okandan2000; Li et al. Reference Li, Ju, Hou and Lin2012b, Reference Li, Suo, Yu, Wu, Somerville, Sager, Li, Hui, Zhang, Zang and Zheng2016; Moore, Reference Moore2012; Cai, Lv & Li, Reference Cai, Lv and Li2016; Lai et al. Reference Lai, Wang, Ran, Zhou and Cui2016, Reference Lai, Wang, Fan, Zhou, Chen and Wang2018b, c, d; Meng, Hooker & Cartwright, Reference Meng, Hooker and Cartwright2017; Saein & Riahi, Reference Saein and Riahi2017; Shen et al. Reference Shen, Shao, Tian, Sun, Chen, Chen, Tian and Lu2017; Malatesta et al. Reference Malatesta, Federico, Crispini and Capponi2018; Yin, Lv & Ding, Reference Yin, Lv and Ding2018b). Studies of both tectonics and fractures are related to geomechanics, which can be used to evaluate the CBM distribution on both the large and small scale (Zhao et al. Reference Zhao, Tang, Qin, Xu, LV, Tao and Li2017; Yin, Lv & Ding, Reference Yin, Lv and Ding2018b).
A large amount of CBM resources is concentrated in the Qinshui Basin, eastern China (Dai et al. Reference Dai, Ni, Huang, Liao, Yu, Gong and Wu2014). The commercially exploited gas-bearing coal seams in this basin currently include the No. 15 coal in the Carboniferous Taiyuan Formation and the No. 3 coal in the Permian Shanxi Formation (Shen et al. Reference Shen, Shao, Tian, Sun, Chen, Chen, Tian and Lu2017). There is a large difference in the productivity of individual CBM wells, and the drilling of a large number of low-production wells will seriously affect the economic viability of CBM development in the Qinshui Basin. The study area is located in the southern part of the Qinshui Basin, and the commercially developed CBM coal seam in this area is primarily the Permian No. 3 coal. The influence of tectonics and fractures on CBM productivity can be better analysed using a large amount of capacity data. Finally, we selected the Permian CBM block in the southern Qinshui Basin for research.
The Qinshui Basin is a depression basin developed in the North China Craton, and a stable commercial CBM reservoir developed in the Lower Permian Shanxi Formation, which is known as the ‘No. 3 coal seam’ (Su et al. Reference Su, Lin, Zhao, Song and Liu2005; Yin et al. Reference Yin, Ding, Zhou, Shan, Wang, Liu and Gu2016b). After the Triassic, the basin experienced the ‘Indosinian movement’, the ‘Yanshan movement’ and the ‘Himalayan movement’ (Su et al. Reference Su, Lin, Zhao, Song and Liu2005; Liang et al. Reference Liang, Wang, Liu, Gao, Du, Feng, Zhu and Yu2014), during which the Upper Palaeozoic strata were strongly deformed, and the strike-slip faults were highly developed. It is very important to study the enrichment law of CBM in this type of tectonically complex area. In general, the area of convergence is disadvantageous for the enrichment of CBM, while the area of extension is conducive to CBM accumulation (Prante et al. Reference Prante, Evans, Janecke and Steely2014; Areeq et al. Reference Areeq, Soliman, Essa and Al-Azazi2016). For highly deformed zones, tectonics plays an important role in controlling the degree of development of coal reservoir fractures (Vishal, Rajnith & Singh, Reference Vishal, Ranjith and Singh2013a; Lai et al. Reference Lai, Wang, Chai, Xin, Wu, Zhang and Sun2017a). During the deformation process of folding, the coal rocks usually have various degrees of rupture patterns (Harpalani & Chen, Reference Harpalani and Chen1995; Vishal et al. Reference Vishal, Ranjith, Pradhan and Singh2013b). The distributions and permutations of different strike-slip faults also have an important effect on the CBM distribution. The fault system can be treated as a grouting system to reform the CBM reservoirs. The opening fault can act as a long-term hydrocarbon escape channel, which is not conducive to the preservation of CBM (Corti et al. Reference Corti, Ranalli, Agostini and Sokoutis2013).
The North China region is in a special tectonic location, and its Mesozoic–Cenozoic tectonic stress field has undergone long and complex changes (Dai et al. Reference Dai, Ni, Huang, Liao, Yu, Gong and Wu2014; Liang et al. Reference Liang, Wang, Liu, Gao, Du, Feng, Zhu and Yu2014). These factors affect the development characteristics of the tectonics and fractures of the Qianshui Basin and will ultimately affect the CBM distribution. In this paper, using a lower Permian commercial CBM block in the southern Qinshui Basin as an example, we systematically study the influence of tectonics and fractures on the CBM distribution in a strongly deformed strike-slip fault zone. This study can guide the exploration and development of similar types of CBM reservoirs around the world.
2. Geological background
2.a. Location and structure
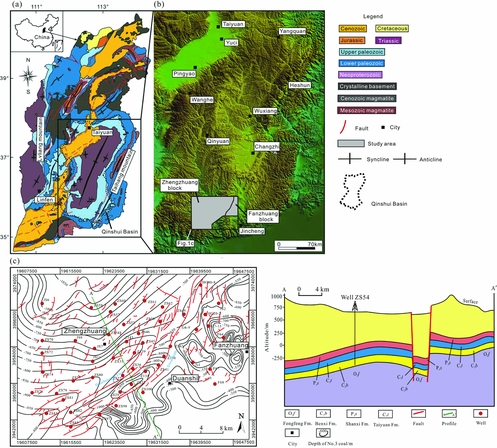
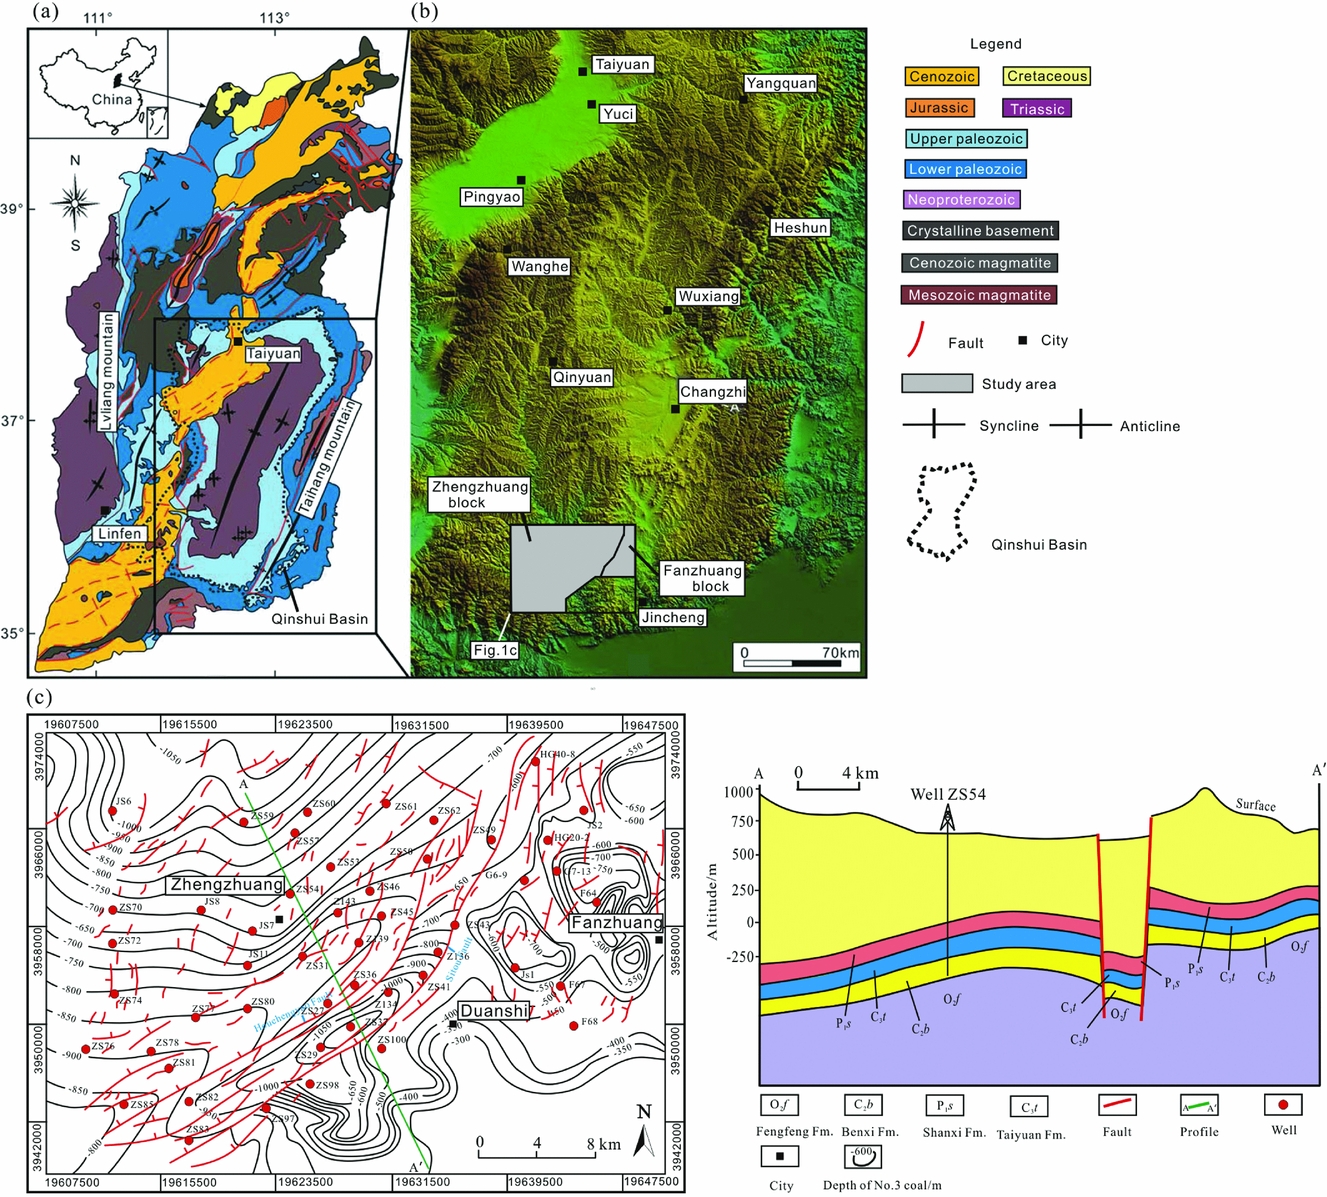
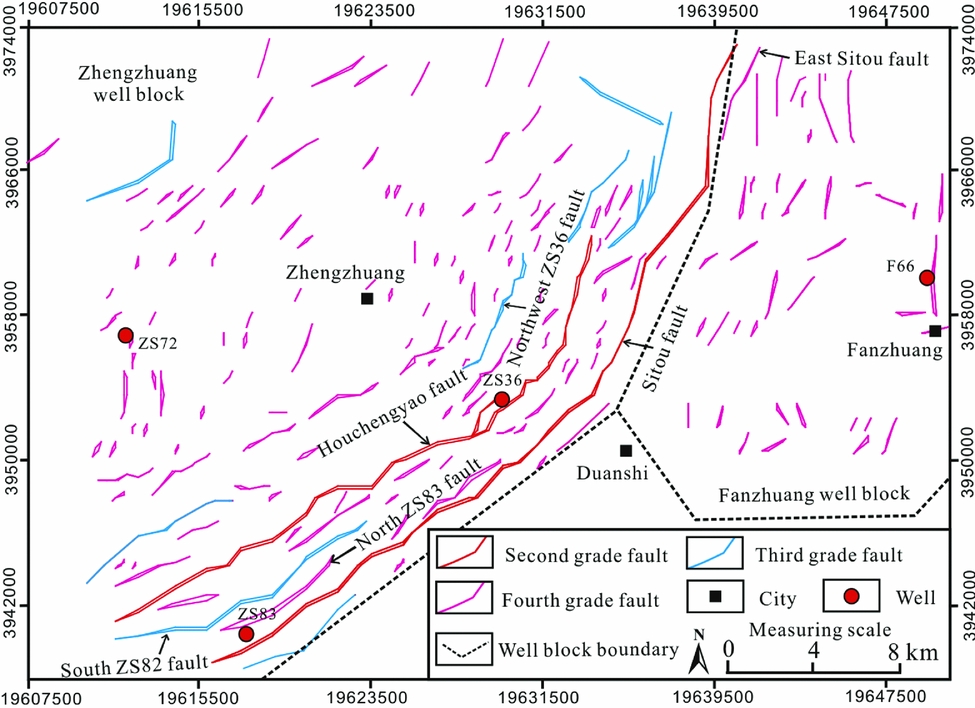
The location of the study area (the southern Qinshui Basin) is shown in Figure 1a, b, and it covers the Zhengzhuang and Fanzhuang well blocks. The surface topography of this region is relatively flat, but the Upper Palaeozoic stratum is highly deformed. The depth of the No. 3 coal seam in the northwestern part of the study area is relatively high, while in the southeastern region it is relatively shallow (Fig. 1–c). Strike-slip faults are highly developed in the study area (Fig. 1c).
Map of the study area location showing tectonic features and well distribution. (a) Tectonic map of Shanxi province, modified from Cai et al. (Reference Cai, Liu, Yao, Li and Qiu2011), Zhao & Zhang (Reference Zhao and Zhang2011) and Wang et al. (Reference Wang, Zhang, Zhu, Wang, Xie, Liu and Zou2014); (b) digital elevation model (DEM) map of the Qinshui Basin, located in the southeastern part of Shanxi province, modified from Wang et al. (Reference Wang, Zhang, Zhu, Wang, Xie, Liu and Zou2014); (c) tectonic features and well distribution of the study area.
2.b. The target Lower Permian No. 3 coal reservoir
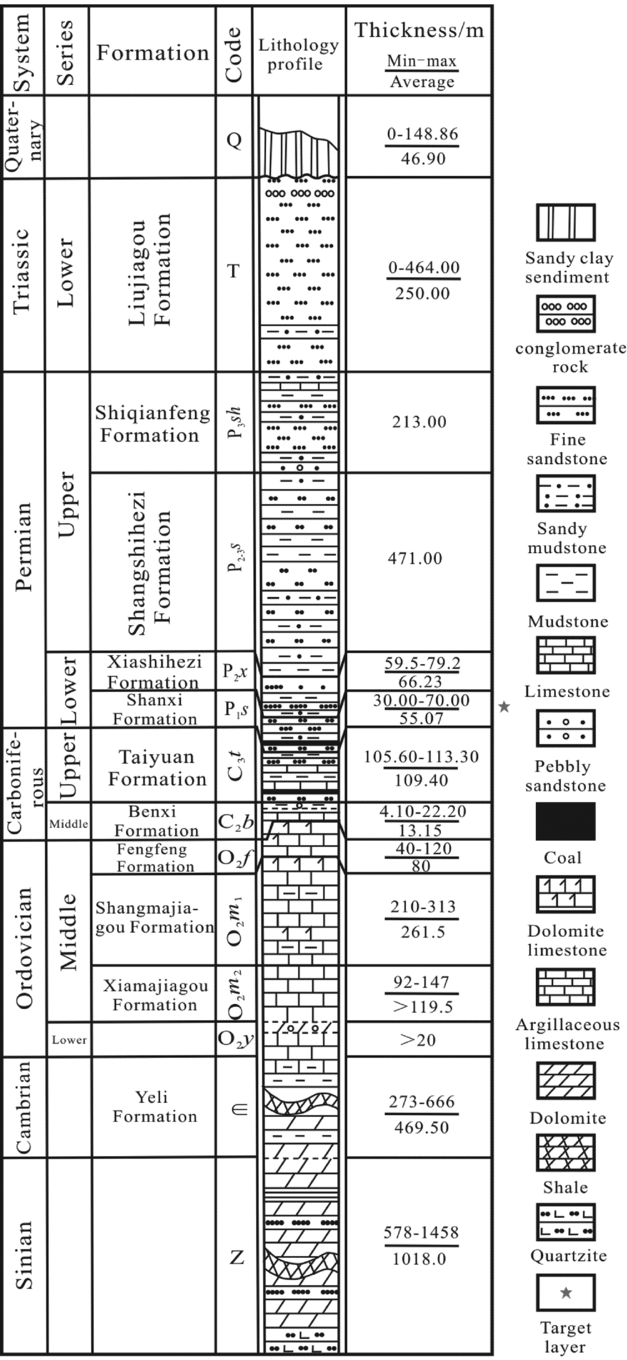
The sedimentary stratigraphic units, formation thickness and lithology of the southern Qinshui Basin are shown in Figure 2. The No. 3 coal seam has a stable distribution and an average thickness of 6 m in this area (Shao, Yang & Shang, Reference Shao, Yang and Shang2015). The primary structure of this seam is a high coal rank (Ro > 3.5 %, anthracite coal; Yin et al. Reference Yin, Ding, Dai, Wang and Yang(2016a). The vitrinite content of the No. 3 coal seam ranges from 46 % to 92 %, with an average of 73.6 %, and the inertinite content ranges from 0.2 % to 36 %, with an average of 17.7 %. The exinite content is generally lower than 10 %, ranging from 0 to 29.8 %, with an average of 4.22 %.
Stratigraphic column of the southern Qinshui Basin.

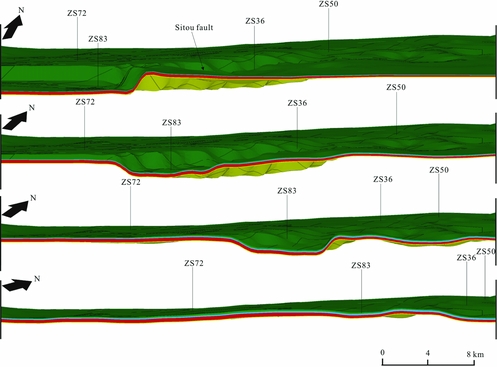
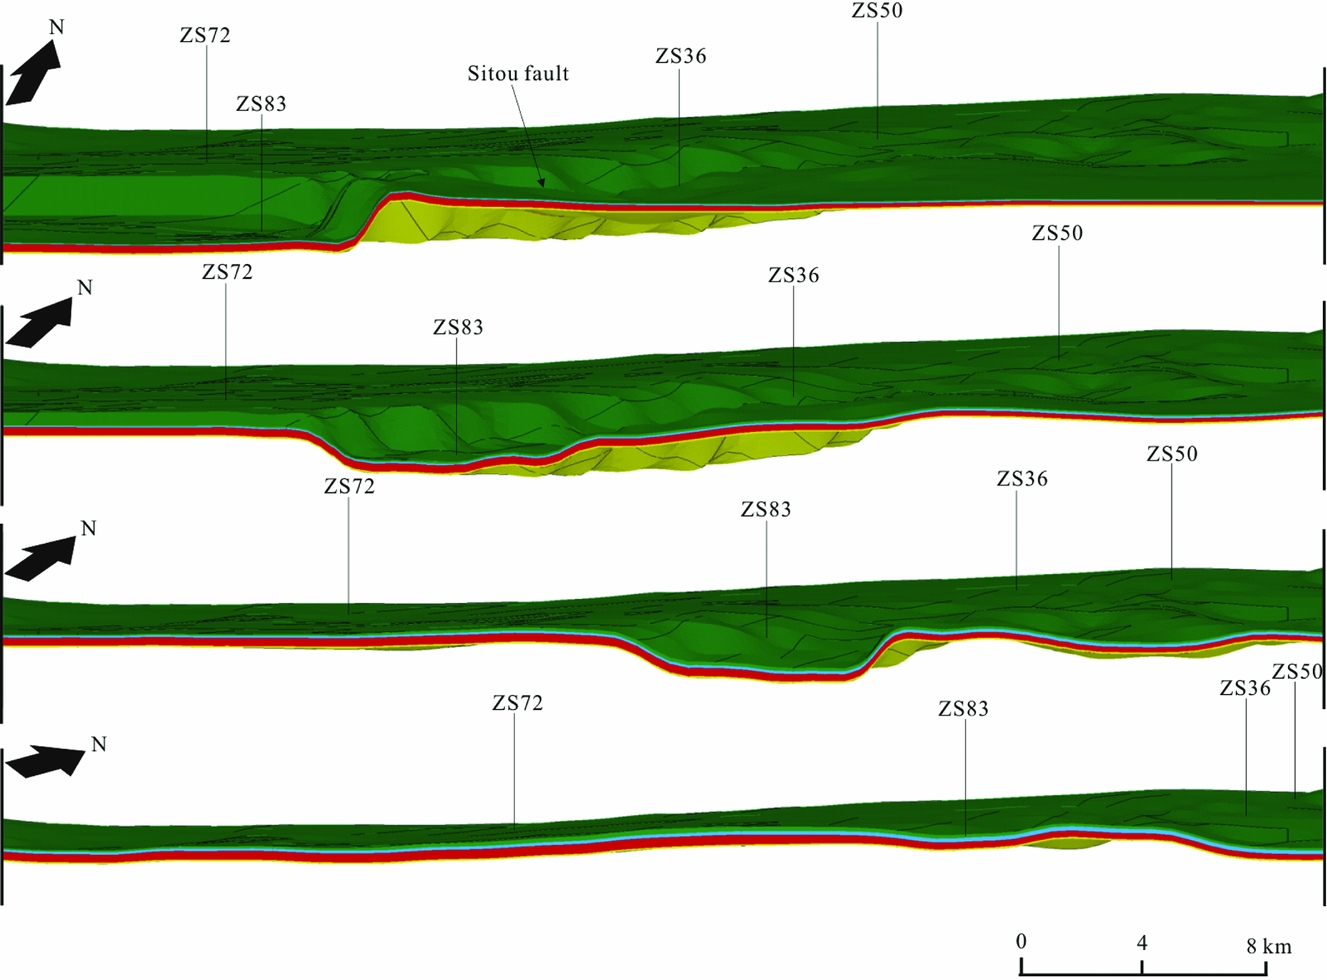
Geologic model of the target layer from different viewing angles. The established 3D finite element model can be rotated in the ANSYS software so that we can observe the model from different angles. The spatial distribution of the strata can be clearly observed. The four models from top to bottom are all of the target layer, and they are identical.
3. Methods and results
3.a. Seismic interpretation
The seismic data used in this study were provided by the PetroChina Huabei Oilfield, and the seismic lines cover the entire work area with a length of 1256.45 km. The standard horizons in seismic data include the upper boundary of the Xiashihezi Formation (P1x) (seismic reflection interface T’5), the Shanxi Formation (P1s) (seismic reflection interface T5), the No. 3 coal seam (3#) (seismic reflection interface T6), the Taiyuan Formation (C3t) (seismic reflection interface T7) and the No. 15 coal seam (15#) (seismic reflection interface T8).
3.b. Current in situ stress determination
There are many previously proposed methods for determining the current in situ stress field in strata. These methods include the hydraulic fracturing method, differential strain analysis (DSA), acoustic emission (AE) and the Formation MicroScanner image (FMI) method, among others (Zoback, Barton & Brudy, Reference Zoback, Barton and Brudy2003; Nelson, Meyer & Hillis, Reference Nelson, Meyer and Hillis2005). Of these methods, the hydraulic fracturing method and DSA are the most accurate. However, the other methods can be used as an aid to evaluate the current in situ stress (Nelson, Meyer & Hillis, Reference Nelson, Meyer and Hillis2005; Lai et al. Reference Lai, Wang and Cai2018a). In this paper, the hydraulic fracturing method and the AE method were used to determine the current in situ stress magnitude of the Shanxi Formation. For the AE experiments, we used a Mistras Micro-II Digital AE System, with a mechanical accuracy of 1 %.
The results are shown in Table 1. The values of σ H range from 23.67 to 27.46 MPa, the values of σ h range from 12.54 to 50.10 MPa and the values of σ v range from 14.09 to 27.54 MPa.
Measured current in situ stresses of the Shanxi Formation in the study area

Notes: σ h is the minimum horizontal stress; σ H is the maximum horizontal stress; σ v is the vertical stress.
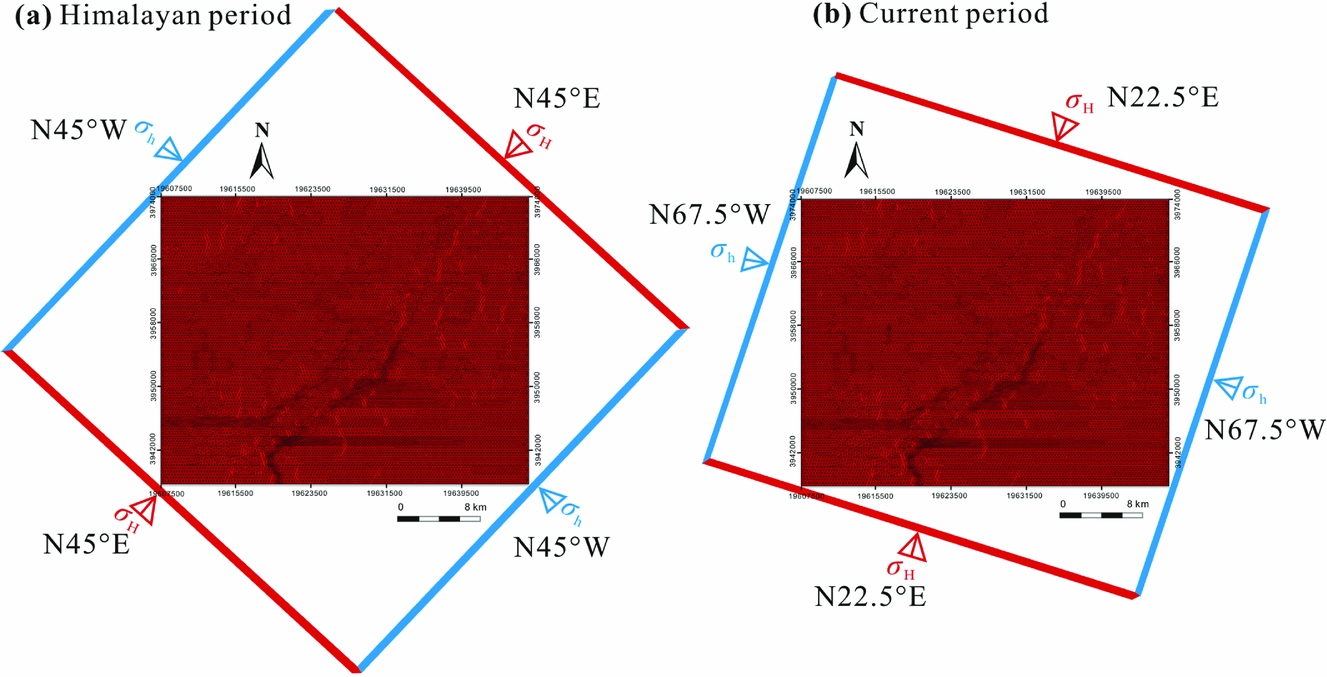
The induced fracture analysis method and the fast shear wave interpretation method can be used to effectively determine the direction of the current in situ stress (Nelson, Meyer & Hillis, Reference Nelson, Meyer and Hillis2005). Both the induced fracture direction and the fast shear wave direction represent the maximum horizontal stress direction (Zoback, Barton & Brudy, Reference Zoback, Barton and Brudy2003). According to these two methods, the maximum horizontal principal stress direction of the Shanxi Formation is N22.5° E.
3.c. Palaeotectonic stress determination
In this study, we used AE experiments to restore the palaeotectonic stress in the region. The tight sandstone samples of the AE tests were collected from well ZS83 and well ZS72. The results are shown in Table 2. According to previous studies, the tectonic stress in the Himalayan period played a crucial role in the formation of fractures in the No. 3 coal Yin et al. Reference Yin, Ding, Zhou, Shan, Wang, Liu and Gu(2016b). During that period, the stress direction was NE (Yin et al. Reference Yin, Ding, Zhou, Shan, Wang, Liu and Gu2016b). Thus, we reconstructed the palaeotectonic stress field of the No. 3 coal in that time period.
Measured palaeotectonic stresses of the Shanxi Formation during the Himalayan period

3.d. 3D tectonic stress field simulation
The software used for the 3D tectonic stress field simulation is ANSYS14.0 (Webb & Johnson, Reference Webb and Johnson2006; Nenna & Aydin, Reference Nenna and Aydin2011). To begin, according to the modelling principles from point to surface and then to body, a 3D geological model of the target layer is constructed. The generation of the spatial surface is based on the spatial surface interpolation fitting method (Li et al. Reference Li, Feng, Wang and Zhou2007). Faults are then added into the established 3D geological model. The fine tectonic stress field simulation requires fine meshing of the constructed model. Therefore, in the meshing process, large mesh densities are set in the complex regions, such as in folds and faults. After meshing, rock mechanical parameters of different structural elements are assigned, and the stress loading of the finite element model is conducted, from which the final geostress distribution can be obtained. The input parameters of the simulation include formation spatial distribution data, fault properties, rock density and rock mechanics parameters (including Young's modulus, Poisson's ratio, tensile strength, cohesion, and internal friction angle). The output parameters include all principal stresses, including the maximum horizontal stress, minimum horizontal stress, vertical stress and shear stress.
The constructed 3D model contains a three-layer structure from top to bottom (Fig. 3). The middle red layer is the No. 3 coal, and the roof and floor of the No. 3 coal seam are mudstone cap rocks. The attributes of the faults (e.g. vertical strike-slip fault) are fully accounted for in this model. After meshing, the No. 3 coal is divided into 104 365 units and 37 046 nodes.
The rock mechanics parameters of the different tectonic units were assigned by considering the rock mechanics experiment results and logging interpretation results. The results are shown in Table 3.
Assignment scheme of the mechanical parameters in the in situ stress field simulation

Notes: The direct roof and floor of the No. 3 coal seam are both mudstone cap rocks. E is Young's modulus; ν is Poisson's ratio; T is tensile strength; C is cohesion; φ is the internal friction angle.
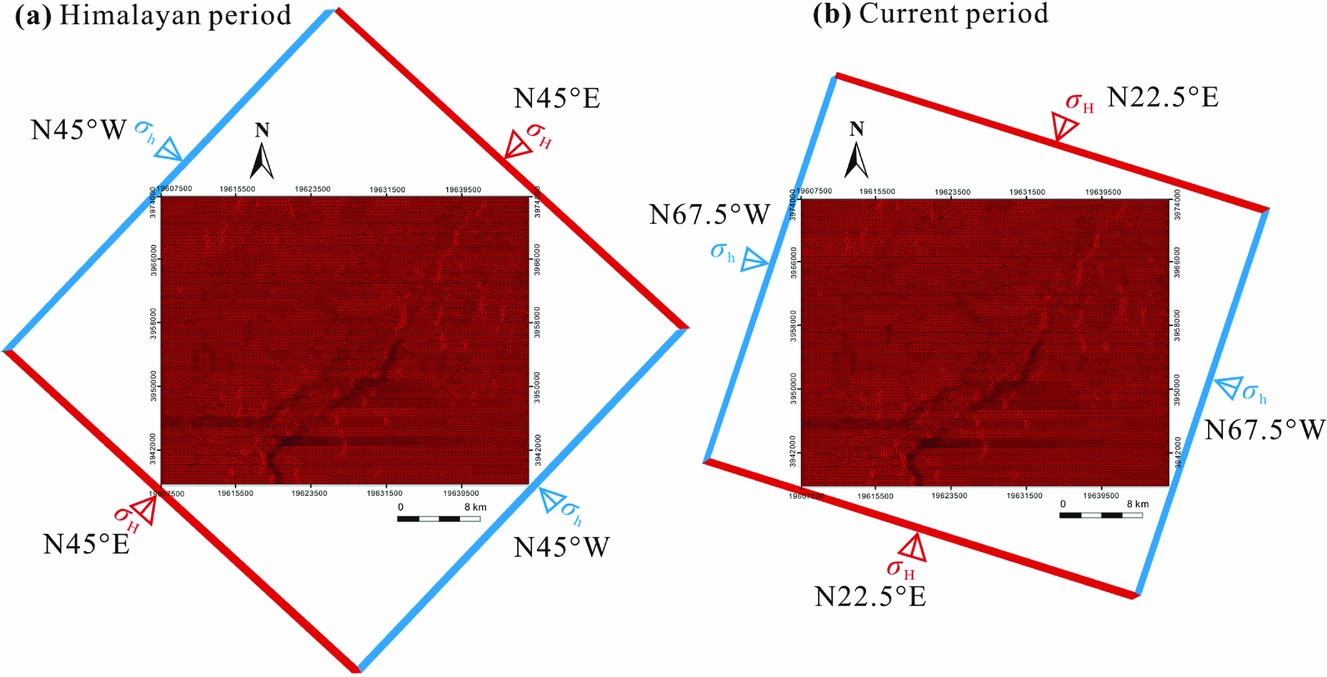
The loading scheme for the finite element simulation is shown in Figure 4. The best boundary stresses were constrained by comparing the simulation results with the measured values. The error of the finite element simulation is small (Tables 4 and 5).
Loading scheme for the tectonic stress field simulation.
Comparison of the measured and simulated results for the current in situ stress

Comparison of the measured and simulated results for the palaeotectonic stress for the Himalayan period

In the analysis of the current in situ stress, we used five wells; in the analysis of the palaeo-stress, we used only two wells. The small number of wells is not conducive to improving the accuracy of the prediction. However, a sufficient 3D geomechanical model of the target layer was constructed for this paper. The simulation results of the tectonic stress field are mainly controlled by the structure of the 3D finite element model and the parameter assignment scheme. We are concerned with the distribution trends of the geostress based on this geomechanical model. Therefore, for the study of the CBM exploration or sweet spot prediction, even without a large number of wells for result verification, the prediction result is still credible. At the present time, the geostress analysis results in this paper that are based on geomechanical theory have good reference value for the CBM exploration in this region.
4. Discussion
4.a. Influence of strike-slip fault scale on coalbed methane distribution
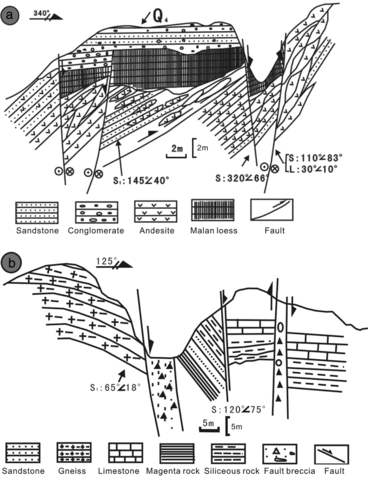
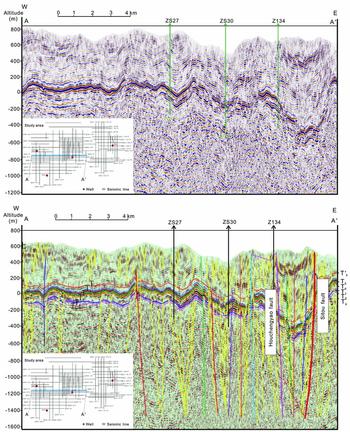
The field outcrop survey of the Upper Palaeozoic strata in the eastern part of the Qinshui Basin show that a series of isopach folds are developed and are accompanied by highly developed high-angle strike-slip faults (Fig. 5). Similar structural features can also be observed in the seismic profile in Figure 6. A graben generally developed between the two main faults (Cundall & Hart, Reference Cundall and Hart1985). We can also observe some negative flower-like structures.
The characteristics of the NE-oriented faults in the area of the Taihang Mountains, eastern Qinshui Basin (Cao et al. Reference Cao, Li, Liu, Suo, Zhao, Xu, Dai, Wang and Yu2013). (a) East Sijiashui village fault (GPS N40° 5.785′, E115° 57.421′); (b) Zijinguan fault in Zhaogezhuang (GPS N39° 41.423′, E115° 18.988′).

Interpreted seismic profile of the QS08-97 seismic line. The seismic reflection horizons T’5, T5, T6, T7, T8 and Tg represent the tops of the Xiashihezi Formation (P1x), Shanxi Formation (P1s), No. 3 coal seam (3#), Taiyuan Formation (C3t), No. 15 coal seam (15#) and Middle Ordovician boundary (O2), respectively. The daily production capacity of wells ZS30 and ZS27 is greater than 1000 m3, and the daily production capacity of well Z134 is less than 150 m3.
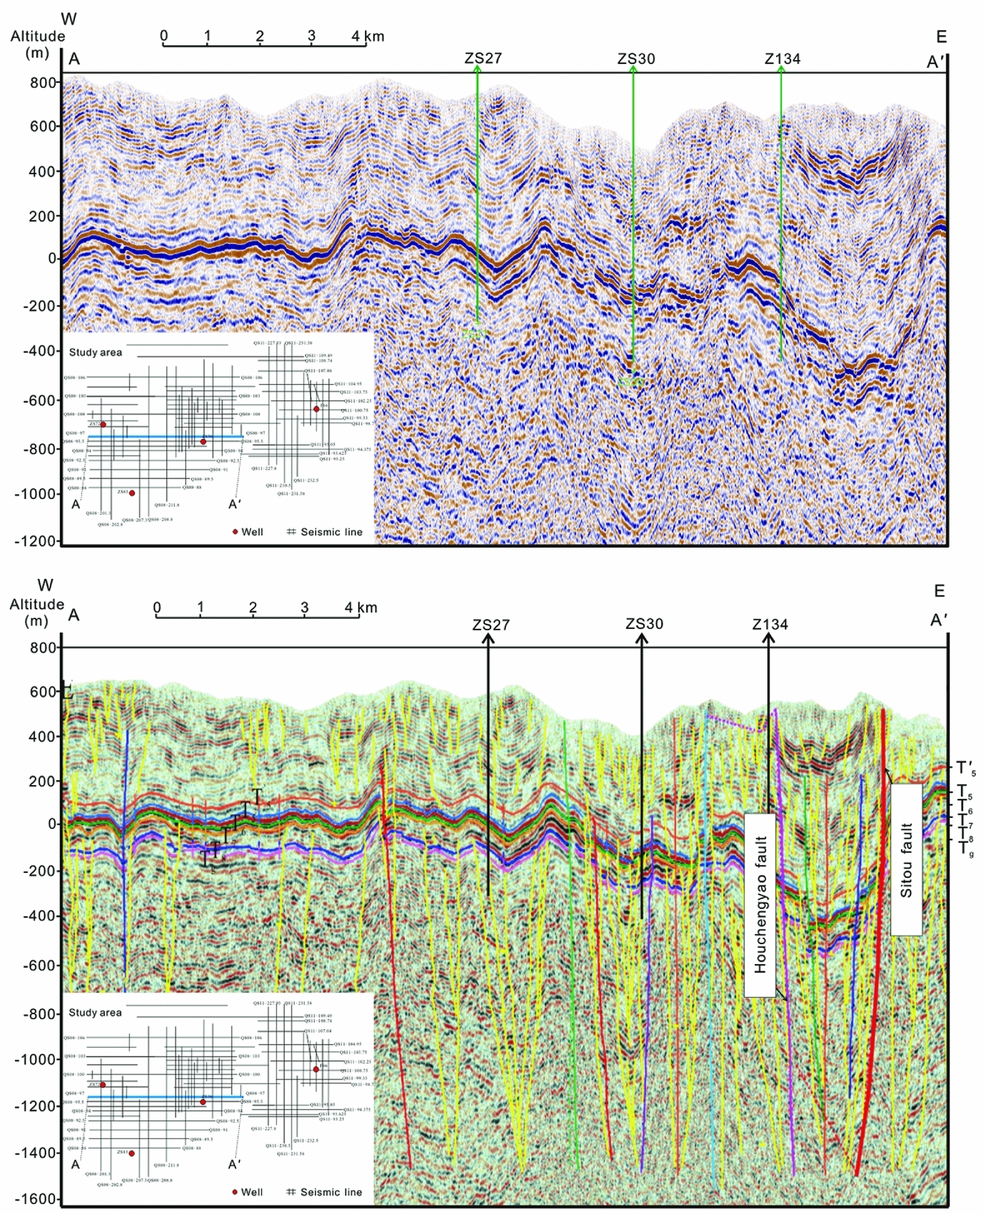
Due to the shallow burial depth of the Carboniferous–Permian strata in the southern Qinshui Basin, some large faults are opening faults extending to the surface, which is detrimental to the preservation of CBM. As shown in Figure 6, well Z134 is located near an opening fault, and the capacity of this well is very low. At the same time, for some small faults that have not broken to the surface, the CBM has not escaped very much because of the good capping conditions of the overlying regional mudstone cap rocks. As shown in Figure 6, no opening fault appears near wells ZS30 and ZS27, and the average daily gas production of these two wells is between 1000 and 2000 m3 d−1. In general, the study area has experienced multiple strong tectonic movements, and the large-scale faults destroyed the integrity of the cap rocks. However, for the areas with small-scale faults, the continuity of the cap rock is good, and these areas favour the enrichment of CBM.
At present, we believe that the tectonic factors that influence the CBM production in this area are primarily fault properties. For the large-scale opening faults, their existence accelerates the dissipation of CBM, while for the zones with smaller fourth-grade faults, the capping ability of the cap layer has not been destroyed. Therefore, the CBM can be preserved in those areas.
4.b. Effect of tectonic extension and aggregation of strike-slip faults on the distribution of coalbed methane
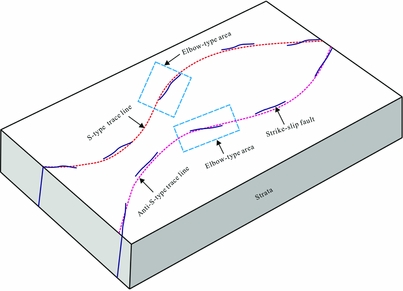
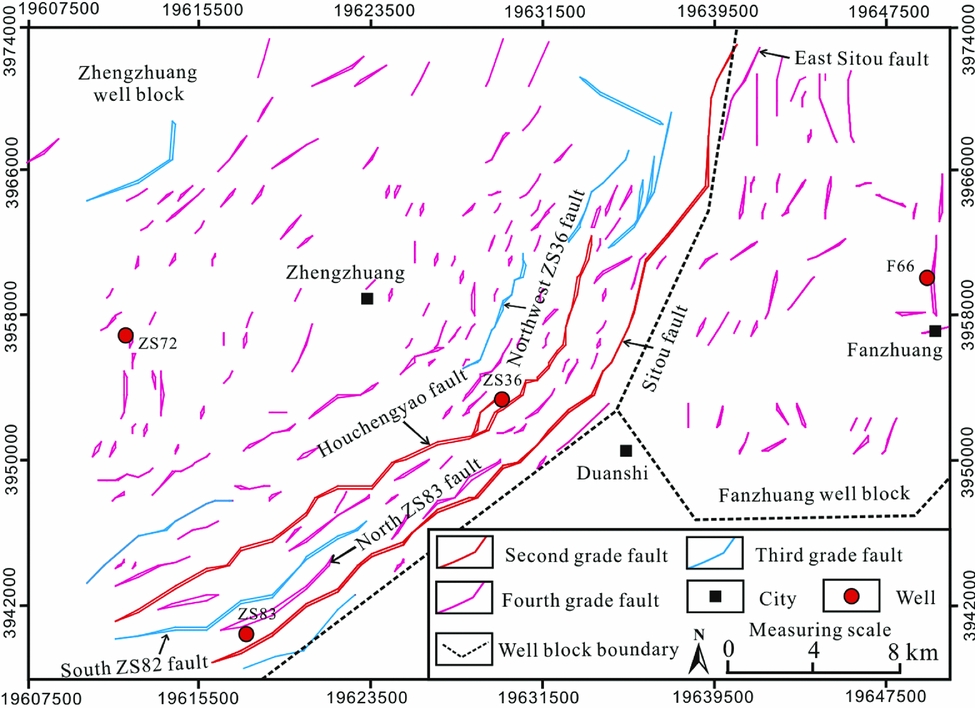
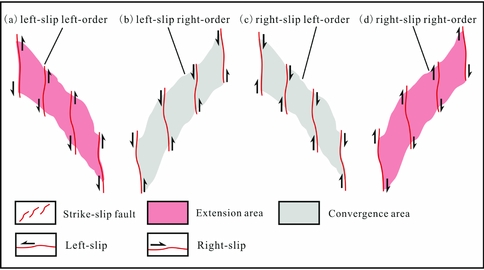
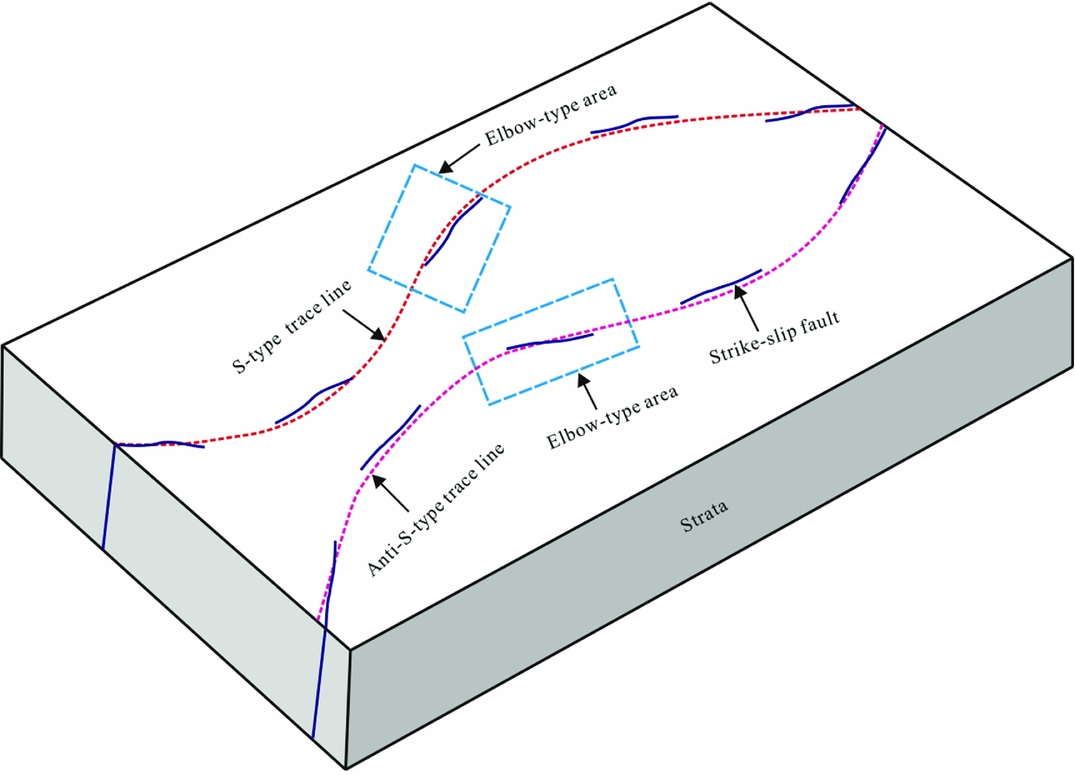
The spatial geometry of the strike-slip faults in the study area is shown in Figure 7. These faults are mainly NE-striking faults (Fig. 8). The combinations of these faults have multiple distribution patterns. The combination features of strike-slip faults can reflect the local tectonic stress environment (Prante et al. Reference Prante, Evans, Janecke and Steely2014; Pei et al. Reference Pei, Paton, Knipe and Wu2015). Figure 9 shows the four fault combination types. The Type 1 (Fig. 9a) and Type 4 (Fig. 9d) fault combinations represent areas of extension, whereas the Type 2 (Fig. 9b) and Type 3 (Fig. 9c) fault combinations represent areas of convergence (Cundall & Hart, Reference Cundall and Hart1985). This typing is an area classification based on the principles of current structural analysis. Obviously, it is easier for the area of extension to obtain a higher CBM production than it is for the area of convergence.
Schematic diagram of the strike-slip fault geometry for the Qinshui Basin.
Distribution of different fault grades in the study area.
Tectonic assemblage of strike-slip faults and their effect on the formation stress environment.
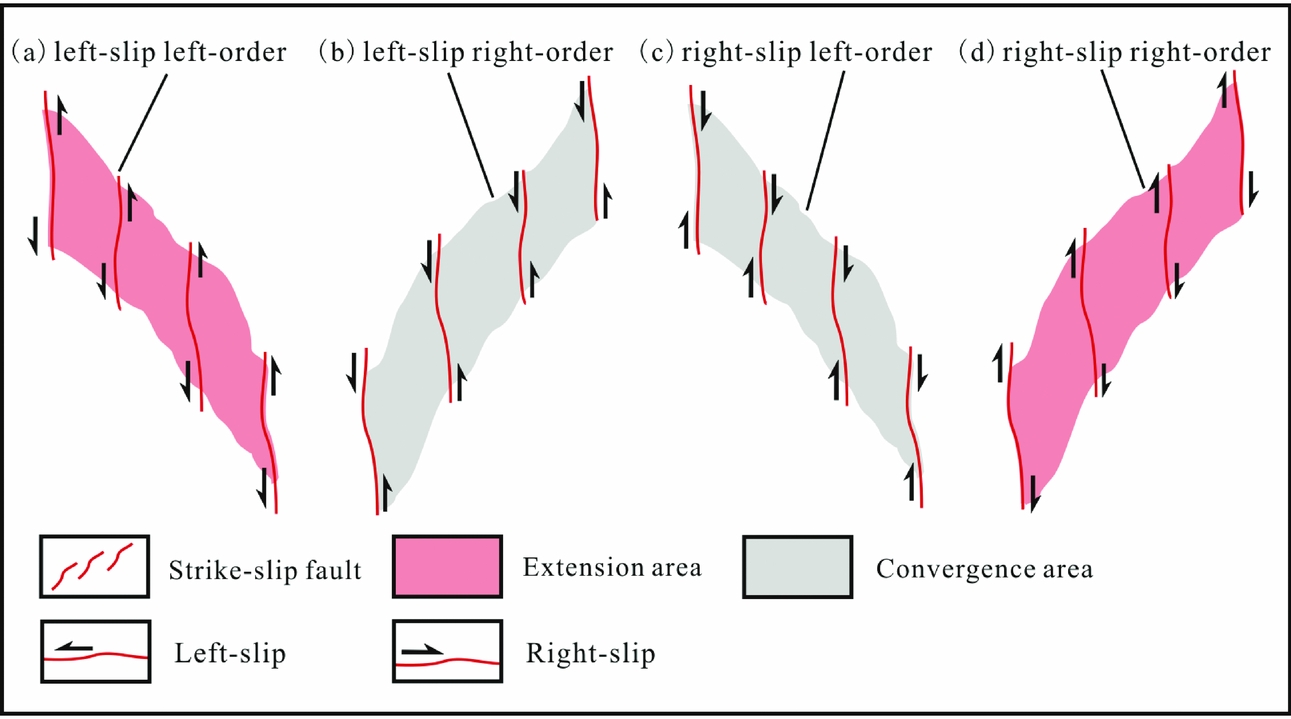
The southern Qinshui Basin has experienced multiple tectonic movements. The faults in this area primarily formed during the Yanshanian period (Nenna & Aydin, Reference Nenna and Aydin2011; Cao et al. Reference Cao, Song, Wang, Cao, Li and Xia2015). Since the Himalayan period, the study area has experienced compressive stress from the NE. Under such environmental stress conditions, the strike-slip faults have right-lateral slip (Chen, Reference Chen2009; Li et al. Reference Li, Zhao, Dai, Liu, Zhou, Santosh and Suo2012a). Therefore, the study area can be divided into the right-slip, right-order fault combination area and the right-slip, left-order fault combination area. The former represents the area of extension, while the latter represents the area of convergence.
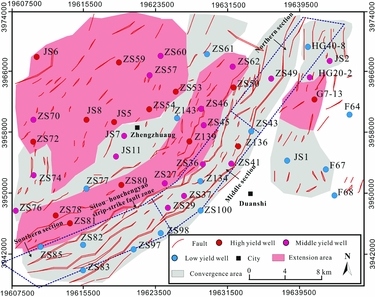
The relationship between the area classification results and the CBM production is shown in Figure 10. The northwestern part of the study area is an area of extension. Then, the area of extension and the area of convergence alternately appeared to the southeast. In the eastern part of the study area (Fanzhuang well block, Fig. 1b), the northern and southern parts are areas of convergence, while the central part is an area of extension.
Map of the regions classified as extension and convergence areas in the study area.

The distribution of CBM well productivity in different tectonic regions is shown in Table 6. There are 12 and 1 high-yield wells distributed in the extension and convergence areas, respectively; there are 7 and 11 middle-yield wells distributed in the extension and convergence areas, respectively; and there are 1 and 13 low-yield wells distributed in the extension and convergence areas, respectively. The ratios of high-yield wells in the extension and convergence areas are 60 % and 4 %, respectively; the drilling success ratio in the extension and convergence areas is 95 % and 48 %, respectively; and the drilling loss ratio in the extension and convergence areas is 5 % and 52 %, respectively. Both the high-yield wells and mid-yield wells in this region have good commercial development value. However, the low-yield wells cannot recover the development costs. Therefore, we must avoid drilling such wells as much as possible to reduce the exploration risks. These statistical results are consistent with the structural analysis results in this paper.
Statistical results of the gas well capacity distribution in the areas of extension and convergence

Notes: Capacity of high-yield wells is greater than 2000 m3 d−1, capacity of middle yield wells is between 1000 m3 d−1 and 2000 m3 d−1, and these wells are general or normal-yield wells. Capacity of low-yield wells is between 0 and 500 m3 d−1, and these wells are mainly dry wells.
4.c. Influence of the ‘ribbon effect’ of strike-slip faults on the distribution of coalbed methane
The ‘ribbon effect’ refers to the swinging phenomenon of a strike-slip fault along its strike. To describe the influence of the ‘ribbon effect’ on the distribution of CBM, we simulated the effect of strike-slip faults on the distribution of various current in situ stresses. Plane distributions of the current in situ stresses of the No. 3 coal seam are shown in Figure 11.
Plane distributions of principal stresses in the No. 3 coal seam in the study area. (a) Plane distribution of the maximum horizontal stress; (b) plane distribution of the minimum horizontal stress; (c) plane distribution of the vertical stress. The red well represents a high-yield well, the pink well represents a middle-yield well and the blue well represents a low-yield well.

The stress variation is clear in the Sitou–Houchengyao strike-slip fault zone (Fig. 11a, b). The stress magnitude is significantly different on both sides of the strike-slip fault; one side of the fault is characterized by strong compression, while the other side is characterized by weak compression. This phenomenon is most evident in the middle and southern regions of the Sitou–Houchengyao fault zone.
The southern section of the Sitou–Houchengyao strike-slip fault zone has a significant stress concentration phenomenon (Fig. 11a, b). The faults in this section have the largest fault throw, the strongest activity and the lowest productivity of all gas wells.
For the middle section of the Sitou–Houchengyao strike-slip fault zone, the ratios of the high-yield, middle-yield and low-yield wells are 12.5 %, 50 % and 37.5 %, respectively. The overall production capacity of the gas wells in this strike-slip fault zone is low, primarily because of the emissions of a large amount of CBM due to the large-scale opening faults. However, high-yield wells can still be drilled in this area, such as the Z136 well. There is still exploration potential of CBM within this fault zone. In addition, five middle-yield wells are also distributed within this area. The horizontal in situ stresses where these high-yield and middle-yield wells are located are relatively lower than those of the other wells (Fig. 11a, b). Lower horizontal stress can reduce the compaction degree of the rock, thereby increasing the porosity and permeability of the coal reservoir. The minimum horizontal in situ stress has distinct segmentation characteristics along the strike of the same fault, indicating that the stress fluctuates significantly. This phenomenon is related to the swing (or the change of occurrence) of the strike-slip fault, also known as the ribbon effect.
High-yield and low-yield wells are generally distributed on different sides of the same strike-slip faults. For example, the ZS27 and ZS36 wells are both middle-yield wells that are located on the north side of the Houchengyao fault, while the Z134 well on the south side of the Houchengyao fault is a low-yield well. The Z136, ZS29, ZS37, ZS41 and ZS49 wells are all high-yield or middle-yield wells that are distributed on the north side of the Sitou fault, while the ZS98, ZS100 and ZS43 wells on the south side of the Sitou fault are all low-yield wells. Wells with a higher capacity are typically distributed on the north side of the fault, and the high-yield (or middle-yield) wells and low-yield wells are usually distributed along alternating sides of the same fault (such as the connection lines from well ZS27 to well ZS50 and from well ZS97 to well HG40-8 in Fig. 11b). This phenomenon is related to the stress plane heterogeneity of the strike-slip faults or the ribbon effect.
4.d. Effect of fractures on the distribution of coalbed methane
The tectonic fractures in the studied coals primarily include tensile fractures and shear fractures. The Poisson ratio of coal with strong toughness is relatively high, which makes it easy to develop ductile shear fractures (Lai et al. Reference Lai, Wang and Cai2018a), and therefore the proportion of shear fractures is significantly larger than the proportion of tensile fractures (Zhao et al. Reference Zhao, Tang, Qin, Xu, LV, Tao and Li2017). The microscopic statistical results show that the ratios of the shear fractures and tensile fractures in the No. 3 coal rocks are 75 % and 25 %, respectively. The formation mechanisms of different types of tectonic fractures are different, so the fracture prediction methods are also different. According to previous studies, the Mohr–Coulomb criterion is applicable to the prediction of shear fractures, and the Griffith criterion is applicable to the prediction of tensile fractures (Griffith, Reference Griffith1921; John, Reference John1969). In this study, these two classical rupture criteria were selected for the prediction of fractures.
The Griffith failure criterion is applicable to the tensile rupture of brittle rocks. In the σ 1–σ 2 stress plane, there are two possible cases (John, Reference John1969):
(1) when σ 2 + 3σ 1 ≤ 0, the criterion can be expressed as:
 $$\begin{eqnarray} && {\left({{\sigma _1}-{\sigma _2}} \right)^2} + 8\left({{\sigma _1} + {\sigma _2}} \right){\sigma _{\rm T}} = 0 \end{eqnarray}$$
 $$\begin{eqnarray} {\rm{cos}} 2\beta = \big({\sigma _1} -\, {\sigma _2} \big)/2\big({\sigma _1} + {\sigma _2} \big), \end{eqnarray}$$
(2) when σ 2 + 3σ 1 ≥ 0, the criterion can be expressed as:
 $$\begin{equation} {\sigma _1} = - {\sigma _{\rm T}} \end{equation}$$
 $$\begin{equation} {\rm{sin}} 2\beta = 0, \end{equation}$$
where σ T is the tensile stress intensity in MPa, σ 1 and σ 2 are the horizontal principal stresses in MPa, β is the direction of the rupture in °, and η is the dimensionless tensile failure rate, which can be obtained using the following equation:
 $$\begin{equation} \eta = {\sigma _{\rm T}}/{R_{\rm T}}, \end{equation}$$
where R T is the tensile strength of the rock in MPa. For the study of the No. 3 coal rocks, the tensile strength value is one-tenth of its compressive strength value.
According to the Mohr–Coulomb failure criterion, the shear failure of the rock is related to the effective normal stress δ n and the shear stress τ n. These criteria can be expressed as (Hardy, Hudson & Fairhurst, Reference Hardy, Hudson and Fairhurst1973):
 $$\begin{eqnarray} {\tau _{\rm n}} & = & C + {\delta _{\rm n}} {\rm{tan}} \varphi , \end{eqnarray}$$
where C is the rock cohesion in MPa, and φ is the internal angle of friction within the rock in °. When the effective normal stress and shear stress satisfy the above formula, shear failure will occur. The shear rate (S) can be expressed using the principal stresses via the following equation (Wang et al. Reference Wang, Wang, Wang, Sun and Qiao2004):
 $$\begin{eqnarray} S &=& (\left({\left( {{\sigma _1} - {\sigma _2}} \right)/2} \right) + \left( {\left( {{\sigma _1} + {\sigma _2}} \right)/2} \right) {\rm{sin}} \varphi)/C {\rm{cos}} \varphi .\nonumber\\ \end{eqnarray}$$
The principal stresses in the above equation have been obtained using a stress field simulation for the Himalayan period, and the other parameters can be obtained through experimental and logging interpretations. Finally, the integrated rupture rate (I F) can be expressed as:
 $$\begin{equation}{I_{\rm F}} = a\eta + bS,\end{equation}$$
where a and b are the proportions of tensile and shear fractures. The value of I F generally ranges between 0 and 4 (Ding et al. Reference Ding, Fan, Yu, Huang and Liu2012). In general, I F = 1 is a critical point. If the value of I F is greater than 1, internal core-scale fractures of the rock will be produced. The higher the value of I F is, the higher the degree of fracture development in the rock.
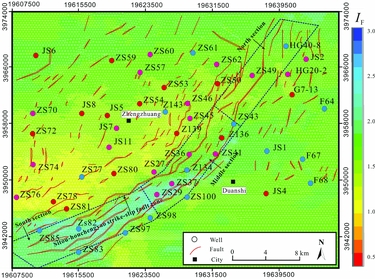
The planar distribution of I F of the No. 3 coal rocks is shown in Figure 12. It can be seen that the I F value of the No. 3 coal seam is primarily distributed between 1 and 2.5. The I F value being greater than 1 indicates that the core-scale tectonic fractures within the coal rock are relatively developed. We divided the I F value into four grades to quantitatively characterize the degree of fracture development in the No. 3 coal rocks. The classification of different I F levels and the corresponding fracture development degrees is shown in Table 7.
The distribution of the integrated rupture rate of the target No. 3 coal seam.

Criteria for the assessment of the fracture development degree

The strong rupture zone (I F ≥ 2.0) is primarily distributed in the Sitou–Houchengyao strike-slip fault zone (Fig. 12). Particularly in the middle and southern strike-slip fault zone, the fault activity is the strongest and the rupture degree of the coal seam is high. In this area, the CBM storage conditions are poor and the productivity of gas wells is generally low. The areas where 1.5 ≤ I F < 2.0 are primarily distributed in the region surrounding the study area. While there are some fourth-grade faults developed in these areas, the scale of the faults is not large, and the fracture development degree is relatively high. Under good preservation conditions, the gas wells in these areas can have good productivity. The areas where 1.0 ≤ I F < 1.5 are primarily distributed in the northwestern area of the Sitou–Houchengyao strike-slip fault zone. The tectonic deformation of the strata in these areas is gentle, the rock rupture degree is low and the tectonic movement is weak. This weak tectonic movement did not cause clear damage to the coal reservoir, which means that these areas have better preservation conditions and the gas wells generally have higher production capacity than those of areas with stronger tectonic movement.
Fracture prediction is based on a 3D finite element method (FEM) (Kattenhorn, Aydin & Pollard, Reference Kattenhorn, Aydin and Pollard2000; Ding et al. Reference Ding, Fan, Yu, Huang and Liu2012), so the prediction is a dynamic result. We can determine the development degree of the fractures by observing the distribution trend of the predicted I F results. Overall, the fracture prediction results are in good agreement with the actual geological conditions; thus, we think that this method is reliable. The development degree of fractures in the No. 3 coal rocks is related to the regional tectonic deformation and the fault development scale. Fractures are generally highly developed near the large-scale opening faults, and these fracture-grouting systems accelerate the dissolution of the CBM. Comparatively, for the zone with only small-scale faults, the development degree of the tectonic fractures is lower. The appropriate fracture development degree can improve the petrophysical properties of the coal reservoirs while maintaining good storage conditions, under which the gas wells can achieve a higher CBM capacity.
4.e. Evaluation indexes of coalbed methane accumulation
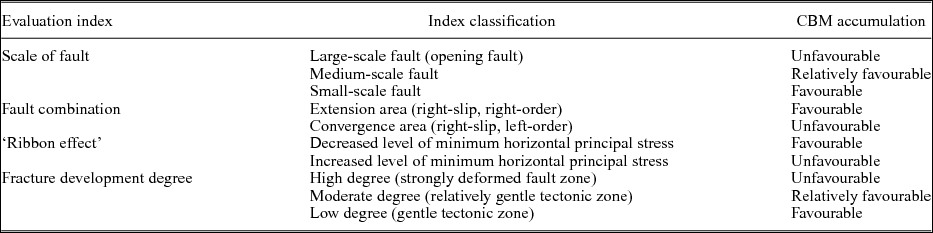
The areas surrounding a sedimentary basin are generally highly deformed, and the oil and gas exploration degree is usually low (Ding et al. Reference Ding, Dai, Zhu, Zhang, He, Li and Wang2016). Therefore, it is meaningful and interesting to study the factors that influence oil and gas enrichment in these areas. In this paper, through the above study, we obtained the evaluation indexes related to CBM accumulation in the highly deformed strike-slip fault zone (Table 8). We found that the fault scale, the fault combination, the tectonic stress, the preservation conditions and the fractures all have an important effect on the enrichment of CBM. Both the deformation and rupture characteristics of rocks are related to geomechanics. Therefore, this study is of great significance for the enrichment of the geomechanical theory of oil and gas geological exploration.
Evaluation indexes of CBM accumulation in the highly deformed strike-slip fault zone considering the tectonics and fractures in the southern Qinshui Basin

5. Conclusions
(1) In this paper, the evaluation indexes that consider tectonics and fractures related to CBM accumulation in the highly deformed strike-slip fault zone were proposed, including the scale of faults, combination of faults, tectonic stresses, preservation conditions and fractures.
(2) According to the strip-strike fault arrangement principle, the right-slip, right-order region represents the area of extension, while the right-slip, left-order region represents the area of convergence. Gas wells with higher productivity are primarily distributed in the area of extension, while the productivity of the gas wells in the area of convergence is low.
(3) A 3D geomechanical method was used to analyse the influence of the ‘ribbon effect’ of strike-slip faults on the CBM distribution. Due to the influence of the ‘ribbon effect’, the tectonic stress presents in situ stress heterogeneity along a plane, which in turn affects the gas well productivity. Low horizontal tectonic stress is more favourable to a relatively high productivity in gas wells.
(4) The integrated rupture rate (I F) was calculated to characterize the development degree of tectonic fractures of the target coal reservoir by combining the Mohr–Coulomb criterion and the Griffith criterion.
(5) Fractures are generally extremely developed near the large-scale opening faults, and these fracture-grouting systems accelerate the dissolution of the CBM, which is not conducive to the preservation of CBM. For the zone of small-scale faults, the development degree of the tectonic fractures is relatively low. The appropriate fracture development degree, however, can improve the petrophysical properties of the coal reservoirs while maintaining good storage conditions, in which case the gas wells can achieve a higher CBM capacity.
Acknowledgements
This research was supported by the National Natural Science Foundation of China (Grant Nos 41772140) and the Open Foundation of Shandong Provincial Laboratory of Depositional Mineralization & Sedimentary Mineral, Shandong University of Science and Technology (Grant Nos DMSM2017081).