Introduction
The name ‘olivacea’ has been used in a very broad sense in the past, to describe various species of brown Parmelia, either corticolous or saxicolous and with or without isidia or soralia. Nylander (Reference Nylander1868) was the first to define Parmelia olivacea s. str. as a non-isidiate and non-sorediate species, with pseudocyphellae on the lobes. Lynge (Reference Lynge1912) segregated P. septentrionalis from P. olivacea, by a combination of morphological and anatomical characters, primarily the rarity of pseudocyphellae on the lobes, smaller spores and a thinner subhymenium. Later, Ahti (Reference Ahti1966) gave a detailed description of P. olivacea in his monograph of the corticolous brown species of Parmelia in the Northern Hemisphere. He was soon followed by Esslinger (Reference Esslinger1977), who confirmed the definition of Ahti (Reference Ahti1966), but also mentioned that the measurements of the spores and hymenium of the two species overlapped. Both authors took this overlap into account, but stated that intermediate forms were rare when using a combination of characters. Nevertheless, this later contributed to some confusion, and although most recent floras cite the two species (Poelt and Vezda Reference Poelt and Vězda1981; Purvis et al. Reference Purvis, Coppins, Hawksworth, James and Moore1992; Krog et al. Reference Krog, Østhagen and Tønsberg1994; Wirth Reference Wirth1995; Brodo et al. Reference Brodo, Duran Sharnoff and Sharnoff2001; Holien and Tønsberg Reference Holien and Tønsberg2004), in most of the accounts the anatomical characters are inaccurate or not mentioned. For example, in his key of Parmelia s. lat., Wirth (Reference Wirth1995) separated the two species based on morphology only. His measurements of spore size largely overlapped for the two species and he did not mention the hymenium characters.
At the generic level, Esslinger (Reference Esslinger1978) segregated the brown Parmelia from Parmelia s. lat. and included P. olivacea and P. septentrionalis in a new genus named Melanelia Essl. Ever since, the circumscription of Melanelia has been questioned (i.e. Lumbsch et al. Reference Lumbsch, Kothe and Elix1988; Thell Reference Thell1995) and recent molecular studies have shown that the genus was not monophyletic (Blanco et al. Reference Blanco, Crespo, Divakar, Esslinger, Hawksworth and Lumbsch2004; Thell et al. Reference Thell, Feuerer, Kärnefelt, Myllys and Stenroos2004; Blanco et al. Reference Blanco, Crespo, Ree and Lumbsch2006). Therefore, Blanco et al. (Reference Blanco, Crespo, Divakar, Esslinger, Hawksworth and Lumbsch2004, Reference Blanco, Crespo, Ree and Lumbsch2006) proposed the clustering of the Melanelia species based on their phylogenetic clades and this resulted in the segregation of two new genera from Melanelia: Melanelixia O. Blanco et al. and Melanohalea O. Blanco et al., the latter including M. olivacea and M. septentrionalis.
Both M. olivacea and M. septentrionalis are boreal species, being at the south-west limit of their distribution in Switzerland (Otte et al. Reference Otte, Esslinger and Litterski2005). Specimens at the limit of the species distribution range are often poorly-developed and can therefore be difficult to identify based solely on morphology. This is the case in Switzerland where the status of M. olivacea and M. septentrionalis has remained unclear. Frey (Reference Frey1959) considered only the presence of M. olivacea s. lat. (including M. septentrionalis) in Switzerland, whereas in the Red List of Switzerland (Scheidegger & Clerc Reference Scheidegger and Clerc2002), only M. septentrionalis was included. The checklist of Switzerland (Clerc Reference Clerc2004) indicated that the presence of M. olivacea in Switzerland needed to be verified. Recently, Hawksworth et al. (Reference Hawksworth, Blanco, Divakar, Ahti and Crespo2008), in their checklist of parmelioid lichens in Europe, stated that records of M. olivacea from Switzerland in fact belonged to M. glabra or M. septentrionalis.
Character variability among populations of the same species or overlapping ranges among similar species is a common problem in lichen taxonomy and statistical tests, such as ANOVA or multivariate analysis, can help to circumscribe species. Different scenarios can occur, depending on the strength of statistical differences, the geographic situation of the taxa and, of course, the underlying species concept (Arup Reference Arup1994; Herrera-Campos et al. Reference Herrera-Campos, Nash and Garcia2001). In this paper we wanted to test, 1) the ability of the anatomical characters to segregate the two species despite the fact that they overlap and 2) how anatomical characters can be used to identify specimens with a poorly-developed morphology, such as those encountered in Switzerland, at the limit of the distribution range of the species.
Materials and Methods
Fieldwork was conducted in the cantons of Neuchâtel (NE), Jura, (JU) and Bern (BE), in the Jura region of Switzerland, to verify the presence of the species, to search for potential new sites and to collect more material for the analyses.
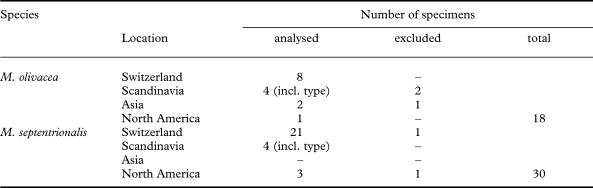
A total of 48 specimens collected in the field and selected from the herbarium collections at G, O, UPS and US were studied (Table 1). Morphology was investigated under the stereomicroscope (Leica MS5), with an emphasis on the characters proposed by Ahti (Reference Ahti1966) and Esslinger (Reference Esslinger1977): 1) presence, shape and location of pseudocyphellae on the lobes, 2) brilliancy of the thallus, 3) lobe margins entire or eroded, 4) apothecia distribution on the thallus and 5) degree of erosion of apothecial margin.
Numbers of specimens of Melanohalea olivacea and M. septentrionalis studied from the different geographical areas. A few specimens were excluded from the statistical analyses because not enough spores could be measured (less than 5 per individual)

To verify that the chemistry of both species was consistent with previous results (Esslinger Reference Esslinger1977), chemical analyses were performed using thin-layer chromatography (TLC) on 8 specimens of M. olivacea and 10 specimens of M. septentrionalis, following the standard method of Culberson & Ammann (Reference Culberson and Ammann1979) with the solvent B modified according to Culberson & Johnson (Reference Culberson and Johnson1982).
Statistical tests on the anatomical dataset
Sections of apothecia were prepared to study the anatomical characters (spore length and width; hymenium, subhymenium and hypothecium height) under the microscope (Leica DM2000).
A total of 10–14 spores per specimen were measured, from a well-developed apothecium. Spores need to be of good quality and at maturity and (outside the asci), so that they had reached their full size or did not appear deformed. Such parameters can greatly affect the size of spores and bias the measurements. When it was not possible to obtain spores of good quality from old herbarium specimens, especially in M. olivacea, fewer spores were measured (minimum 5) or the individual was omitted from the analysis (3 specimens of M. olivacea and 2 of M. septentrionalis, see Table 1). A total of 135 M. olivacea and 285 M. septentrionalis spores were measured. Additionally, hymenium, subhymenium and hypothecium average height were measured for all 48 specimens (see Fig. 5E), by taking measurements of both the thinnest and the thickest parts, as well as 3 random measurements in between.
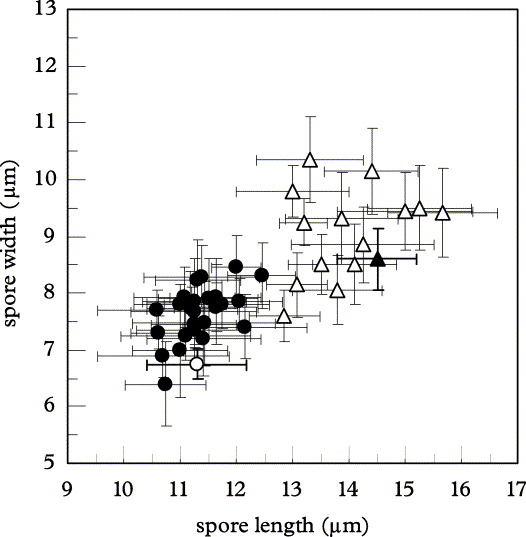
Mean spore length and width per individual in Melanohalea olivacea (Δ, n=15) and M. septentrionalis (•, n=28). Although standard deviations (± σ) are slightly overlapping, the two species exhibit two distinct clusters and the type specimens (▲, ○)nest within each species.

Normality of the data was tested with Shapiro tests in the software R 2.5.0 (R Development Core Team 2007) and variance homoscedasticity was checked using Fmax tests (Sokal and Rohlf Reference Sokal and Rohlf1995), both at the individual and the species levels. Once verified, a nested ANOVA was performed on the spore dataset using the software SYSTAT 11 (San Jose, CA, USA), to test for species divergence based on spore length and width. In both cases the following model was used:

where Yijk is the measurement of the k th spore in the j th individual in the i th species, μ being the whole mean (constant), (βj)i the individual effect (j = 15 or 28 individuals measured) nested to the species effect αi, and Eijk the residual (k = 5 to 14 spores measured).
Similarly, species differentiation based on hymenium, subhymenium and hypothecium mean height was tested with a two-sample t-test (Wilcoxon test when normality was not met) using the software R 2.5.0.
To summarize the data, a Principal Component Analysis (PCA) was performed on the mean values of the anatomical dataset per individual (spore length and width; hymenium, subhymenium and hypothecium height) in the software SYSTAT 11, to see how the variation was distributed among the two species.
A Discriminant Linear Analysis (DLA) was performed to verify the assignment of specimens to each species and identify which variables were the best predictors to discriminate the two species. The following model was used:

where Yi is the score attributed to the i th individual, resulting from the addition of a constant μ and the canonical function αj of the j th variable (mean spore length and width; mean hymenium, subhymenium and hypothecium height) times the mean value βij of each individual.
Results
The Shapiro and Fmax tests both indicated that normality and homoscedasticity were met at the 5% level (homoscedasticity at 1% for subhymenium height and spore width), showing that the dataset was suitable to be used in the parametric analyses presented here. Since normality was not met for hymenium height, a non-parametric Wilcoxon test was performed instead of a t-test. This variable was still included in the multivariate analysis (PCA and DLA), since these analyses are usually more sensitive to heteroscedasticity than normality.
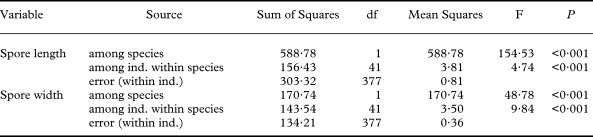
The nested ANOVA showed that spore length and width were both significantly different between M. olivacea and M. septentrionalis (P < 0·001, Table 2). The variation for spore length (width) was 155 (49) times higher between species than within species, the latter being 5 (10) times bigger than within individuals. Although standard deviations overlapped slightly, the two species behaved as two distinct clusters with the type specimens nesting within their own species (Fig. 1).
Nested ANOVA of spore length and width used to test for among and within species variation of M. olivacea (n = 15) and M. septentrionalis (n = 28). Mean Squares (MS) values show that for spore length (width), the variation among species is 155 (49) times bigger than among individuals of the same species, itself 5 (10) times bigger than within individuals (error). Both variables significantly explain the variation among species (P < 0·001)

df = degree of freedom, Famong species = MS (among species) / MS (among ind. within species) and Famong ind. = MS (among ind. within species) / MS (within ind.)
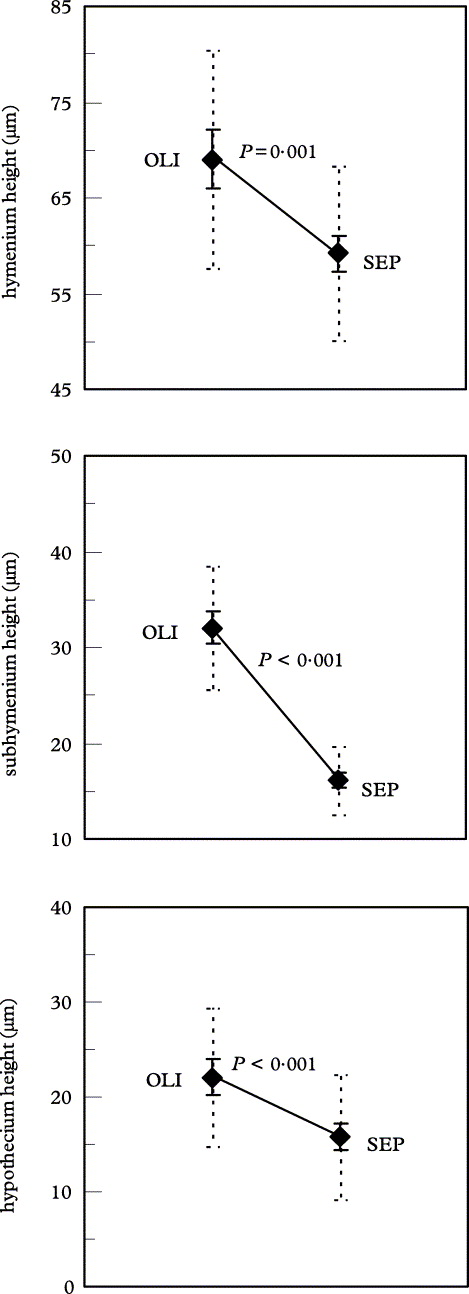
The t-tests (Wilcoxon test for hymenium height) showed that the two species were significantly different for the mean hymenium, subhymenium and hypothecium height (P ≤ 0·001, Fig. 2). Confidence intervals (± 1·96σ/√n at the 95% level) were well-separated, but standard deviations (± σ) largely overlapped between the two species for the hymenium and hypothecium height.
Mean height of hymenium, sub-hymenium and hypothecium in Melanohalea olivacea (OLI, n = 15) and M. septentrionalis (SEP, n = 28). P values of the two samples t-Test (Wilcoxon test for the hymenium) indicate that the 3 variables are significantly different between species. Confidence intervals (± 1·96 σ/√n at the 95% level) are indicated by straight lines and standard deviations (± σ) in dotted lines.

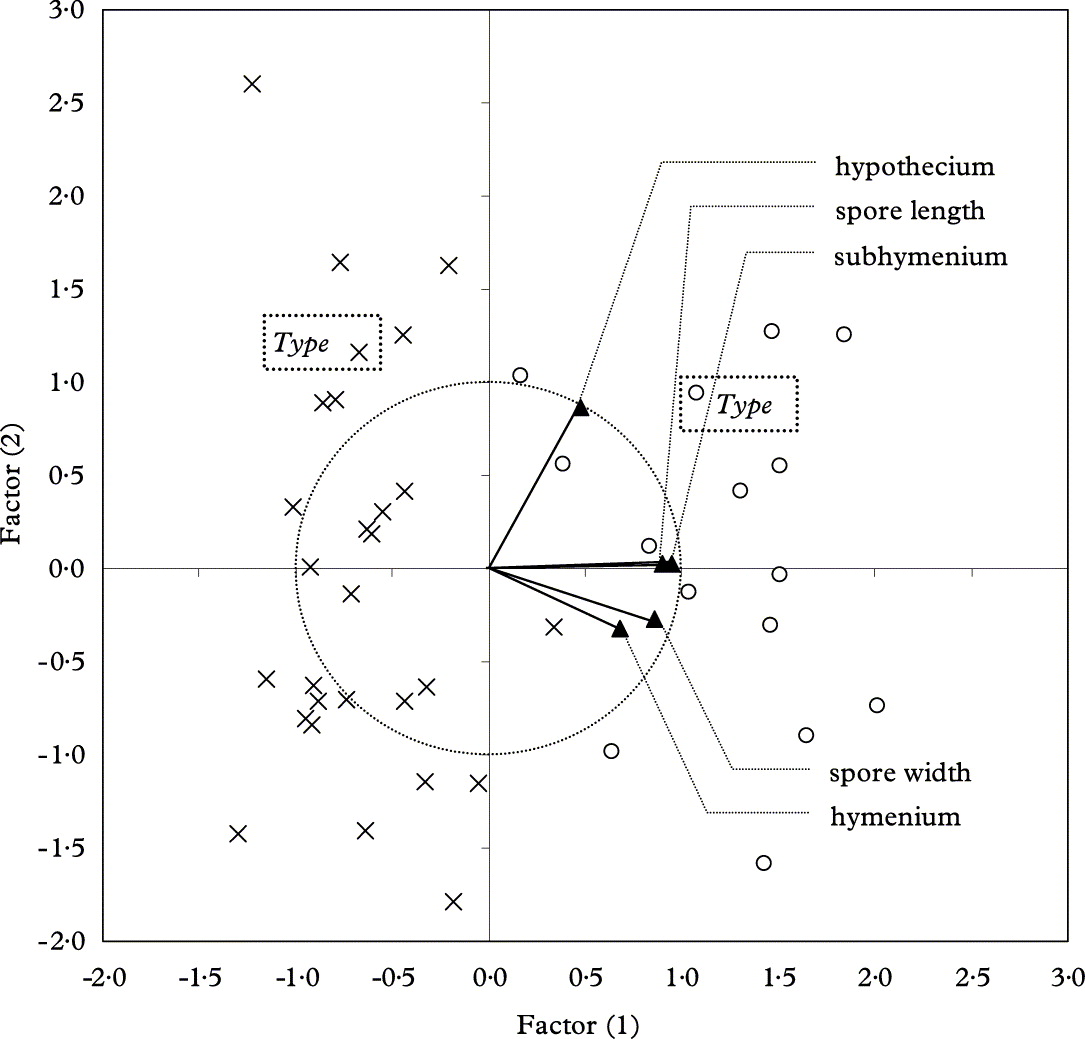
The PCA computed from the mean values of the anatomical dataset (Fig. 3) showed that despite a substantial variation of the anatomical characters within species, the first axis, which accounted for 62·35% of the total variance, significantly segregated the two species (t-test on factor (1); P < 0·001), whereas no significant difference between species was found on the second axis (18·39 % of the total variance; P = 0·62). The best variables to discriminate the two species based on the first axis were subhymenium height and spore length. Again, the type specimens nested within their own species.
Principal Component Analysis (PCA) on the mean values of the anatomical dataset (spore length and width; hymenium, subhymenium and hypothecium height) per individual of Melanohalea olivacea (○, n = 15) and M. septentrionalis (×, n = 28). A significant differentiation of the two species appears on the first axis (t-test on factor (1); P < 0·001), which accounts for 62·4% of the total variance, whereas the second axis (18·4 % of the total variance) does not discriminate between species (P = 0·62). The correlation circle (dotted-line) shows that subhymenium height and spore length are highly correlated with the first axis.

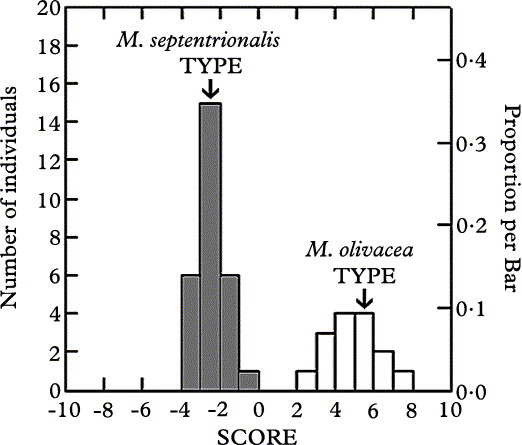
The DLA on the mean values of the anatomical dataset assigned 100% of the individuals to the right species and the two species clearly clustered according to individuals' scores (Fig. 4), with species means of −2·56 for M. septentrionalis and 4·77 for M. olivacea (canonical correlation = 0·96; constant = −16·26). Scores of the type specimens were found close to the mean of their own species. The variables that best discriminated the two species were again subhymenium height, with a standardized canonical coefficient of 1·11, followed by spore length (0·89), and finally hymenium height (−0·46), spore width (−0·32), and hypothecium height (−0·14).
Discriminant Linear Analysis (DLA) on the mean values of the anatomical dataset (spore length and width; hymenium, subhymenium and hypothecium height) per individual of Melanohalea olivacea (n = 15) and M. septentrionalis (n = 28). The two species show two distinct clusters according to the individual scores, with species means of −2·56 for M. septentrionalis and 4·77 for M. olivacea (canonical correlation = 0·96; constant = −16·26). Scores of the type specimens are found near the mean of each species. The variables that best discriminate the two species were subhymenium height, with a standardized canonical coefficient of 1·11, followed by spore length (0·89), and finally hymenium height (−0·46), spore width (−0·32), and hypothecium height (−0·14).

Discussion
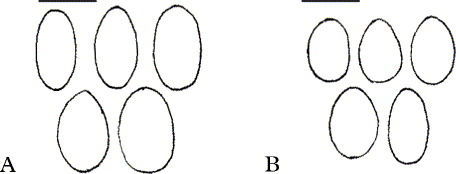
Both the ANOVA (Table 2) and the graph of spore dimensions (Fig. 1) showed that the two species were significantly different for the variation in spore size, and more specifically for spore length. Spore length was also the second best predictor to discriminate the two species in the PCA (Fig. 3) and the DLA (Fig. 4). This confirms that it is a good diagnostic character to identify specimens as one or the other species. Although the size range of spores for the two species overlaps slightly, spores of M. septentrionalis are distinctly smaller than those in M. olivacea (Fig. 6). However care is needed, because of the great variability of spore size (and shape) observed within individuals of both species, especially in M. olivacea. The nested ANOVA showed that the variation in spore length was 5 times smaller within individuals than between individuals of the same species (Table 2). This difference is significant enough to consider spore size as a good character but emphasizes that there is a non-negligible variation within individuals. It is therefore important to observe and measure numerous spores, in order to have a good representation of the average spore size of a specimen.
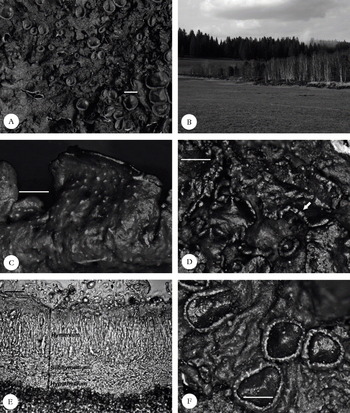
Melanohalea olivacea (A,C,E); A, habitus; C, laminal and punctiform pseudocyphellae; E, hymenium. M. septentrionalis (B,D,F); B, birch belt along a raised bog, the typical habitat in Switzerland; D, marginal and elongated pseudocyphellae; F, apothecia.
Scales : A = 2 mm; C, D & F = 0·5 mm; E = 25 μm.

The two-sample t-tests (or Wilcoxon test) for species differentiation based on mean hymenium, subhymenium and hypothecium heights were all significant. Figure 2 shows that although character means and intervals of confidence were distinct between the two species, standard deviations largely overlapped for the hymenium and hypothecium height. Herrera-Campos et al. (Reference Herrera-Campos, Nash and Garcia2001) separated Usnea brasiliensis Motyka from U. cornuta Körb. on the basis of significant differences of anatomical characters (mainly medulla/axis ratio) using one-way ANOVAs and a discriminant analysis, although standard deviations of the characters overlapped. In the present case, the rather large overlap of hymenium and hypothecium heights means that these characters are not suitable to separate the two species. Since hymenium height seems to be correlated with the size of the apothecia, this could lead to confusion when identifying Swiss specimens of M. olivacea, which tend to be less developed and to have smaller apothecia than Scandinavian specimens. Hypothecium height seems to be quite variable within individuals and therefore cannot be used as a diagnostic character. On the other hand, with no overlap between species, subhymenium height is a very good diagnostic character. Indeed, it was also the variable showing the smallest variation and therefore the easiest character to use. Specimens with a poorly developed morphology are often covered with apothecia, and when the spores are too old, or too few, the subhymenium height remains easy to measure. Subhymenium height was the best predictor to discriminate the two species in the PCA (Fig. 3) and the DLA (Fig. 4), with a canonical score 2·5 (8) times higher than hymenium (hypothecium) height. In M. septentrionalis, the subhymenium is distinctly shorter than in M. olivacea, and this was often visible immediately under the microscope, even before taking any measurements.
Such analyses demonstrate the usefulness of statistical tests, such as ANOVA or multivariate analysis, in circumscribing species in lichens. In Caloplaca, Arup (Reference Arup1994) found significant differences (one-way ANOVA) in spore size and hymenium height among American and European populations, but since he found no discontinuities in the range of the characters, he concluded that both populations belonged to the same species. He argued that the differences may arise because of the isolation on different continents (allopatry). In our case, the two species occur sympatrically and although the values of the anatomical data can overlap, the DLA (Fig. 4) showed that there is a clear discontinuity in the distribution of the characters between the two species.
In summary, the anatomical characters previously stated by Ahti (Reference Ahti1966) proved to be powerful characters to differentiate the two species despite the fact that they overlap. The PCA on the anatomical dataset (Fig. 3) showed that the two species distinctly segregated based on the first axis, even though intra-specific variation occurred. In the various analyses, the type specimens were always nested within their own species. Subhymenium height and spore length were the best predictors to discriminate the two species in the DLA, which attributed 100 % of individuals to the right species. Being the least variable and the easiest to measure, they are therefore the best diagnostic characters. Such characters are particularly useful to identify specimens with a poorly-developed morphology, such as those encountered in Switzerland, where both species are at the edge of their distribution ranges.
The Species
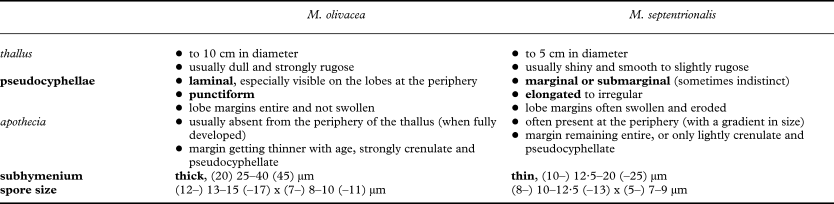
For a detailed description of the two species, see Ahti (Reference Ahti1966) and Esslinger (Reference Esslinger1977). Table 3 briefly summarises the characters used to differentiate the two species.
Morphological and anatomical characters used to differentiate Melanohalea olivacea from M. septentrionalis. Characters in italics represent tendencies only and should be used in correlation with the other diagnostic characters (in bold)

Melanohalea olivacea (L.) O. Blanco et al.
Mycol. Res. 108: 883 (2004).—Melanelia olivacea (L.) Essl., Mycotaxon 7: 48 (1978).—Parmelia olivacea (L.) Ach., Methodus: 213 (1803).—Lichen olivaceus L., Spec. Pl.: 1143 (1753); type: Sweden, Härjedalen, Fjällnäs, E. Vrang in Krypt. Exsicc. Vindob. (UPS! 3063—neotype (see Jorgensen et al. Reference Jorgensen, James and Jarvis1994a, Reference Krog, Østhagen and Tønsbergb)).
Ascospores. A, Melanohalea olivacea ; B, M. septentrionalis. Scales: A & B = 10 μm.

Distinctive features. Thallus olive to dark brown, rosette-forming, often dull, bearing obscure to distinctive, punctiform pseudocyphellae on the surface of the lobes, which are particularly visible at the periphery of the thallus; lobe margins usually entire, not swollen or eroded.
Apothecia are usually present and numerous, often crowded towards the centre of the thallus and usually not extending to the periphery of the thallus; apothecial margins are at first entire, with age becoming thinner and strongly crenulate with punctiform to somewhat elongated pseudocyphellae. Hymenium hyaline, (50–) 60–90 (–110) μm tall, with a pale brown epihymenium; subymenium rather thick, (20–) 25–40 (–45) μm tall; hypothecium (10–) 12·5–30 (–40) μm tall. Ascospores hyaline, ovoid to oblong or ellipsoid, often quite variable in size and shape, (12–) 13–15 (–17) × (7–) 8–10 (–11) μm.
Chemistry. Fumarprotocetraric acid, protocetraric acid (sometimes only as traces) ±atranorin; rarely no secondary compounds detected by TLC (Esslinger Reference Esslinger1977).
Notes. The morphology of M. olivacea is characterized by the pseudocyphellae being distinctly punctiform and laminal. Conversely in M. septentrionalis, pseudocyphellae are more elongated to irregular in shape and they remain confined along the lobe margins (Fig. 5C & D). The shape and location of pseudocyphellae on the lobes were already pointed out by Ahti (Reference Ahti1966), but he did not include them in the key used to distinguish M. septentrionalis from M. olivacea. Later, Esslinger (Reference Esslinger1977) segregated the two species based on the abundance of pseudocyphellae, stating that they were numerous in M. olivacea, but sparse or absent in M. septentrionalis. He did not mention the shape and location of pseudocyphellae on the lobes and these two characters were subsequently forgotten. Pseudocyphellae are always present in M. septentrionalis, although they can be few, obscure and therefore difficult to observe. The lobe margins are often slightly swollen and seem rather eroded by the pseudocyphellae, whereas in M. olivacea, they remain entire and do not look swollen. Occasionally, M. septentrionalis may exhibit laminal pseudocyphellae, which may have expanded from the margin towards the upper surface of the lobes, but the majority of pseudocyphellae are always found along the margins.
Other morphological characters previously discussed by Ahti (Reference Ahti1966), such as the size or brilliancy of the thallus, the position and size of the apothecia and the morphology of the apothecial margins, are typically more variable. These characters may depend on the size and developmental stage of the thallus or be strongly modified by environmental factors. Melanohalea olivacea is usually dull towards the centre of the thallus, whereas M. septentrionalis has an upper surface which is shiny throughout. However, old herbarium specimens of either species often look dull. Apothecia, on fully developed specimens, tend to be restricted to the centre of the thallus in M. olivacea, whereas they occur towards the periphery (with a gradient of size) in M. septentrionalis. Well-developed specimens of M. olivacea often exhibit large marginal lobes without apothecia, but this character is not easy to evaluate, especially in small, poorly developed specimens, where the lobe margins are quasi absent. In M. olivacea, apothecia are slightly larger, which correlates with a larger size of the thallus in general. The apothecial margins often bear numerous pseudocyphellae, even on small and young apothecia, and tend to become very thin and crenulate, even disappearing, with age. Pseudocyphellae are also common on the apothecial margins of M. septentrionalis but not to the same extent, the margins usually remaining entire and only slightly crenulate. Again, these characters can help in differentiating the two species, but they remain difficult to quantify and should be used only in complement to other diagnostic characters.
In conclusion, the position, as well as the shape of the pseudocyphellae on the lobes, being laminal and punctiform in M. olivacea whereas they are marginal and more elongated in shape in M. septentrionalis, are the only morphological characters that enable a clear separation of the two species. In poorly developed specimens anatomical characters are needed for the identification: M. septentrionalis having smaller spores and a thinner subhymenium than M. olivacea.
Substratum and ecology. Melanohalea olivacea is a cold-tolerant species that grows in open and moderately humid habitats (Ahti Reference Ahti1966) on a variety of deciduous trees, particularly on Betula, more rarely on conifers (Otte et al. Reference Otte, Esslinger and Litterski2005), dead wood or rocks (Santesson et al. Reference Santesson, Moberg, Nordin, Tønsberg and Vitikainen2004). In Switzerland, it is restricted to the bark of Betula, which forms a typical birch belt along raised bogs in the cold valleys of the Jura. It was always found together with M. septentrionalis, which is the more abundant species.
Distribution. Melanohalea olivacea is essentially a boreal species, with an almost circumpolar distribution showing a slight oceanic tendency (Ahti Reference Ahti1966; Esslinger Reference Esslinger1977; Otte et al. Reference Otte, Esslinger and Litterski2005). In Europe it is common in Scandinavia, but becomes less and less abundant in the temperate zone further south, and is probably absent from the Alps [see Hawksworth et al. (Reference Hawksworth, Blanco, Divakar, Ahti and Crespo2008) for the list of countries in which the species occurs in Europe]. In Switzerland, it is very rare as it reaches the south-west limit of its distribution range. So far, it is known only from 3 localities in the Jura chain, in the cantons of NE, BE and JU so that its presence in Switzerland is confirmed here.
Conservation status. Because of its uncertain taxonomic status, M. olivacea was omitted from the Red List of Switzerland (Scheidegger & Clerc Reference Scheidegger and Clerc2002). According to the IUCN Red List criteria (2001), applied at the regional level (Gärdenfors et al. Reference Gärdenfors, Hilton-Taylor, Mace and Rodríguez2001), the species can be considered as critically endangered (CR) in Switzerland and the Jura, owing to the very restricted geographical range and extremely small population sizes. It is to be noted, however, that the two Swiss populations found in the collections of Frey (from the 1950s) are still present today so they have been able to maintain themselves. In neighbouring countries, the species is considered as CR in Germany (Wirth et al. Reference Wirth, Schöller, Scholz, Ernst, Feuerer, Gnüchtel, Hauck, Jacobsen, John and Litterski1996) and in France, the very few records (many of them misidentified specimens of similar species, especially M. septentrionalis) lead to the same conclusion (Hawksworth et al. Reference Hawksworth, Blanco, Divakar, Ahti and Crespo2008; C. Roux pers. comm.). Melanohalea olivacea should be taken into consideration in future conservation assessments in Switzerland, as it is much rarer than M. septentrionalis.
Selected specimens examined Canada: Ontario: Rainy Lake district, 65 miles E Atikokan, granite outcrops and Jack pine woods, 1969, M. E. Hale 36432 (US).— Finland: Nylandia: Helsinki, Mellunmäch, 30 ix 1970, T. Erb s. n. (G).—Japan: Honshu: Prov. Shinano, c. 4 km ESE of Azusayama, 35° 56′ N, 138° 43′ E, about 1400 m., open Larix kaempferi forest along the river, on bark of Betula ermanii, 1996, K.-H. Moon 1865 (G).— Russia: Primor'e Territory: Lazo Reserve, 1 km E of Kordon Petrov, 42° 43′ N, 133° 52′ E, 30 m., coastal hill covered by a low Quercus manchurica shrub forest, on trunks of Quercus manchurica, 1991, L. Tibell 19324 (UPS).—Sweden: Härjedalen: Tänäs Paroecia, Ramundberget, 700 m., in ramulis Betulae, 1973, R. Santesson 24373 (G).—Switzerland: Canton BE: Bellelay, bord de la tourbière de la Sagne, 935 m, sur Betula, 1960, E. Frey 23.420 (G). Canton NE: Les Ponts-de-Martel, Bois des Lattes côté E depuis le Joratel, 49° 92′ 80″ N, 01° 90′ 87″ E, 995 m, sur Betula en bordure de tourbière, 2006, C. Truong 07-13 (G). Canton JU: Le Noirmont, tourbière de la Saigne, 50° 10′ 67″ N, 02° 26′ 16″ E, 980 m., sur Betula, branches tombées au sol au bord du chemin, le long du marais asséché, 2007, C. Truong 07-17 (G).
Melanohalea septentrionalis (Lynge) O. Blanco et al.
Mycol. Res. 108: 883 (2004).—Melanelia septentrionalis (Lynge) Essl., Mycotaxon 7: 48 (1978).—Parmelia septentrionalis (Lynge) Ahti, Acta Bot. Fenn. 70: 22 (1966).— Parmelia olivacea var. septentrionalis Lynge. Bergens Mus. Årbok 10: 4 (1912); type: Norway, Troms, Målselven, Likkavarre, 1911, Holmboes & Lynge (O!—holotype; W—isotype).
Distinguishing features. Thallus small, olive to dark-brown, usually shiny, with obscure to distinctive, elongate to irregular pseudocyphellae, that are confined to the lobe margins.
Apothecia usually present and numerous, often crowded towards the periphery of the thallus; margins of apothecia usually remaining entire, but sometimes becoming thinner and slightly crenulate, with punctiform to somewhat elongated pseudocyphellae. Hymenium hyaline, (40–) 50–70 (–90) μm tall, with a pale brown epihymenium; subymenium thin, (10–) 12·5–20 (–25) μm tall; hypothecium 10–25 (–30) μm tall. Ascospores hyaline, ovoid to oblong or ellipsoid, (8–) 10–12·5 (–13) × (5–) 7–9 μm.
Chemistry. Fumarprotocetraric acid (major), protocetraric acid (traces), ± atranorin ±confumarprotocetraric acid (cph-2) ; rarely no secondary compounds detected by TLC (Esslinger Reference Esslinger1977).
Notes. For differentiation from M. olivacea, see under M. olivacea. The occurrence of confumarprotocetraric acid in M. septentrionalis requires further investigation to determine if the chemotype can be used to distinguish the species from M. olivacea.
Substratum and ecology. Melanohalea septentrionalis is a cold-tolerant species that prefers open and moist habitats (Ahti Reference Ahti1966) where it grows on a variety of deciduous trees, more rarely on conifers and wood (Otte et al. Reference Otte, Esslinger and Litterski2005). In Switzerland, it is strictly corticolous on Betula, rarely on Pinus or Picea, growing along raised bogs in the cold valleys of the Jura. Small thalli are often found abundantly on small branches of Betula.
Distribution. Circumpolar, M. septentrionalis is widespread in the northern boreal regions (Ahti Reference Ahti1966; Esslinger Reference Esslinger1977; Otte et al. Reference Otte, Esslinger and Litterski2005). In Europe, it is common in Scandinavia, but becomes rare in the temperate zone further south, being confined to more continental sites than M. olivacea, for example in the Tyrolean Alps [see Hawksworth et al. (Reference Hawksworth, Blanco, Divakar, Ahti and Crespo2008) for the list of countries in which the species occurs in Europe]. It reaches the south-west limit of its distribution range in Switzerland, where it is only present in a few localities in the Jura chain, in the cantons of NE, BE and JU.
Conservation status. Melanohalea septentrionalis was mentioned as endangered (EN) in Switzerland and the Jura in the Red List of Switzerland (Scheidegger & Clerc Reference Scheidegger and Clerc2002). The small population sizes and the restricted geographical range confirm this status. In neighbouring countries, the species has the same trend of rarity as M. olivacea. Both M. septentrionalis and M. olivacea are considered relicts of the last ice age; the actual trend of global climate warming makes them very vulnerable in Switzerland, since they are northern, cold-tolerant species, at the southern limit of their European distribution range.
Selection of specimens examined. Austria: Niedere Tauern: Salzburg, NE vom Prebersee c. 9 km NE von Tamsweg, c. 1530 m., Hochmoor, an Betula pubescens, 1989, J. Hafellner & W. Obermayer 394721 (G).—Canada: Alberta: 16 miles S of Rocky Mountain House, 52° 09′ N, 114° 52′ W, 3500 ft., extensive Larix laricina – Picea mariana – Betula pumila var. glandulifera bog, 1971, M. Hale 38940 (US).—Denmark: SW Greenland: area near the head of Sangujaarssuit, Ilulialik, 64° 52′ N, 50° 47′ W, on bark of Alnus crispa, 1997, E. S. Hansen 465985 (G).—Finland: Kuusamo: ad ripam boreo-occidentalem lacus Toranginjärvi propre pagum Kuusavo, 250 m., ad corticem Salicis phylicifoliae in fruticeto paludoso, 1965, T. Ahti 20.154 (G).—Switzerland: Canton Bern: Tramelan, “la Tourbière” dans les Prés de la Montagne, 57° 72′ N, 02° 29′ E, 1160 m, sur Betula, 1961, E. Frey 24384 (G). Canton Jura: La Chaux-des-Breuleux, “la Tourbière”, 50° 16′ 77″ N, 02° 27′ 07″ E, 980 m, sur Betula dans la tourbière, 2007, C. Truong 07-08 (G). Canton Neuchâtel: vallée de la Brévine, le Brouillet, südwestlichstes Hochmoor des Tales, 1055 m, an Betula und Pinus mugo, 1958, E. Frey 21864 (G). Canton Vaud: La Chaux, marais des Mouilles côté SW, (CH) 49° 74′ 74″ N, 01° 70′ 46″ E, 1085 m, sur Betula en bordure de tourbière, 2006, C. Truong 07-16 (G). —USA: Northern Alaska: along the ridge of the Colville River, at Umiat, 69° 25′ N, 152° 10′ W, on alders, 1958, J. W. Thomson & S. Shushan 6250 (US).
The authors thank the Conservatoire et Jardin botaniques de Genève, host of the project Numerical Flora of the Swiss Lichens, Michelle Price for correcting the English, Claude Roux for providing us with information about the species in France, curators of the herbaria of O, UPS, and US for sending us specimens on loan and finally Teuvo Ahti and two anonymous reviewers who improved our manuscript through their valuable comments.