1 Introduction
Preserving historic sites offers both sentimental and economic benefits. Access to historic structures provides a tangible connection to peoples’ pasts. Historical monuments are beneficial for local economies, as they often attract tourism dollars. Preservation of old structures is likely more environmental friendly than their demolition and new construction. For all of these reasons, governments create multiple incentives to preserve heritage buildings, including direct expenses for reconstruction and maintenance, subsidies, and tax incentives. Tax credits, which go toward the rehabilitation of historic buildings in Ohio, are the main focus of this paper.
Tax credits, similar to other preservation incentives, are believed to promote economic development in certain areas (Reichl, Reference Reichl1997) by attracting construction jobs and helping communities to rebuild (Frizzell & Mitchell, 2002; Swaim, Reference Swaim2003). Historical preservation and designation results in mostly positive price changes for the historic structures and nearby properties (Noonan, Reference Noonan, Rizzo and Mignosa2013). Historical rehabilitation of existing buildings was also found to be more profitable for investors than building completely new structures (Mason, Reference Mason2005). On the other hand, historical preservation tax credits, like any other tax preferences, are argued to reduce the transparency of the tax system, and lack the annual scrutiny of direct government appropriations (Swaim, Reference Swaim2003).
This paper studies another potential advantage or disadvantage of such credits; it evaluates whether historical preservation tax credits in Ohio generate net benefits for residents of Ohio in general (societal benefit-cost analysis) and Ohio’s public sector in particular (fiscal impact study). There is an ongoing debate among Ohio policymakers about the continuation of the Ohio Historic Preservation Tax Credit (OHPTC) program. In June of 2015 the Ohio State Senate, for example, proposed a budget amendment with a two-year freeze on the OHPTC program which, ultimately, did not pass into law.
The OHPTC program was created in 2006 and awarded its first credits in 2007. The first projects were certified to receive credits in 2009.Footnote 1 Since the program is still in place, the benefit-cost and fiscal impact analyses in this paper are conducted in media res for the period of 24 years, and include both ex post analyses of the program from 2007 to 2015, and ex ante analyses from 2016 to 2030.Footnote 2 This societal benefit-cost analysis is the first study of its kind of the OHPTC program (there are very few studies of other state credits). The fiscal impact analysis has been a part of the report (not a research journal article) published by Lendel et al. (Reference Lendel, Candi, Ellen, Tatyana, Merissa, Stephanie, Charlie and Kenneth2015). The earlier fiscal impact analysis, however, had only about 57% of the actual property and property tax records (all missing data were approximated) and did not include the data on property tax delinquencies.
The following sections provide a more comprehensive review of the OHPTC program, including benefits and costs of the program and the ways they were approached and estimated. The estimates are followed by a sensitivity analysis. The concluding section discusses if the program produces net benefits for the public and private sectors in Ohio.
2 Background
The federal government, as well as approximately thirty states including Ohio, currently offer historic preservation tax credits. The Federal program was created in 1976 and offers 20% income tax credit toward qualified historic rehabilitation expenses. Of the state programs, Ohio currently offers one of the most generous credits (25% of total qualified rehabilitation expenses).Footnote 3 Other states with large programs are Iowa, Missouri, New York, Oklahoma, Virginia, and Wisconsin. North Carolina also had a large state program that expired in December of 2014.
The OHPTC was enacted on December 13, 2006. OHPTC provides up to 25% of qualified rehabilitation expenditures, and can be combined with the federal credit. It can be taken in lieu of any state tax liabilities,Footnote 4 is refundable, and is capped at five million dollars for most projects. Catalytic projects (the larger projects that are expected to spur higher economic development in the area surrounding the OHPTC site) can qualify for up to 25 million in the tax credits. The OHPTC can be claimed for several years; however, the entire credit is typically used in a single year, since the credit can be applied to multiple taxes (see footnote #4 for the list of taxes). The credit can be used for rehabilitation expenses of commercial, but not residential properties in Ohio.
OHPTC can be claimed only when the rehabilitation project is complete. But the applications to be eligible for the credit must be submitted before any rehabilitation works begin. If rehabilitation is already under way before the credit is awarded, the OHPTC can only be claimed for the amount of new rehabilitation activities that happen since the award. The applications can be submitted twice a year with deadlines on February 28 and August 31. The first round of submissions included all applications approved before May 9, 2008. On December 20th, 2016, the 17th round of applications were awarded.
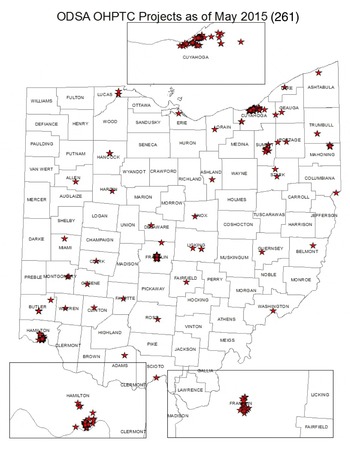
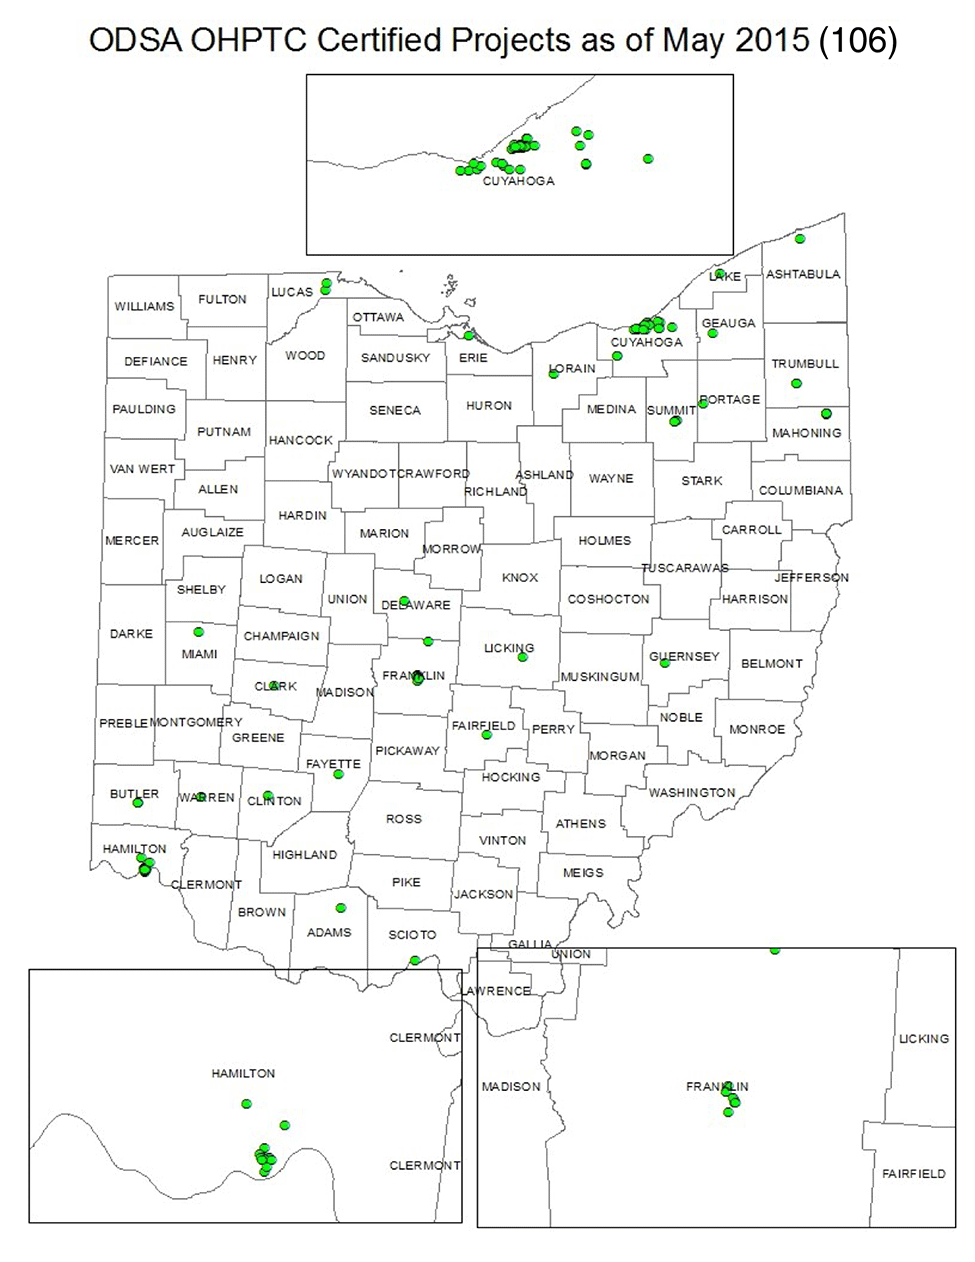
From the day of OHPTC inception and up until the cut-off day for current research in July 2015, 106 projects were certified for the credits and then completed (see Picture 1 for the geography of the projects).Footnote 5 Completed projects rehabilitated about 120 historic buildings in Ohio, while 155 additional projects rehabilitating a total of 230 historical buildings were under way throughout the state.Footnote 6 Most of the rehabilitation activities have happened in the cities of Cleveland, Cincinnati, and Columbus. A smaller number of projects have been underway in the cities of Akron and Youngstown (see Picture 2 for the map of all projects that were awarded a credit). After renovation, buildings are primarily being used for retail, hotels, and multifamily rental units.
The geography of projects awarded OHPTC.

The geography of certified OHPTC projects.

3 Methods
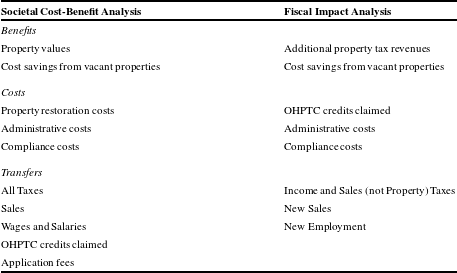
As noted earlier, this paper provides both a societal benefit-cost analysis (BCA) and a fiscal impact analysis (BCA from the government perspective) of the OHPTC. The study estimates such societal benefits as increases in property values and cost savings (on fire and police protection and property maintenance or demolition costs) generated from previously abandoned or underutilized properties, as well as such societal costs as property restoration costs, administrative, and compliance costs. From a fiscal perspective, the paper evaluates tax expenditures,Footnote 7 administrative and compliance costs, and additional property tax revenues collected from the rehabilitated buildings, and buildings nearby as well as cost savings on previously abandoned properties. The benefits and costs of OHPTC from the societal and government perspectives are compared side by side in Table 1 and discussed in details later.
Benefits, costs, and transfers from the societal and fiscal perspectives, included in the analysis.

As would any BCA, this study compares existing (OHPTC) program with status quo, or potential benefits and costs in the absence of the program. The existing program outcomes are observed. The task is to understand what benefits and costs would be in the absence of the program. For example, in societal BCA the OHPTC is a transfer from government (government cost) to eligible developers (benefits to tax payers). In fiscal impact analysis OHPTC is a cost. On the other side, in the societal BCA taxes are the transfers from tax payers (costs to tax payers) to the government (benefits to the government). From the fiscal impact analysis property taxes are the benefits. The challenge is to estimate what additional tax benefits the program generates that would not be available in the absence of the program.
This BCA study, with several notable exceptions,Footnote 8 does not estimate external benefits and costs associated with OHPTC renovations. In societal BCA, for example, the properties nearby the OHPTC sites are getting potentially worse off during the rehabilitation phase due to the construction process, including dirt and noise as well as the restricted access to the properties. This study applies the Kaldor–Hicks efficiency criterionFootnote 9 and assumes that losing parties get compensated for the losses after renovations are completed via improvements to curb appeal and improved access to neighborhoods that become potentially more attractive for private residents and businesses, and less likely to be crime sites.
For benefit estimates in the societal BCA, 2007 (the year just before the first round of OHPTC applications was approved) is considered the base year. The value added every tax is estimated as a difference between tax collections in each consecutive year and the base year (2007). This is not the best approach, as all OHPTC projects start (and end) at different times. More detailed discussion of benefit and cost estimates, and what is considered a transfer rather than a benefit or cost is described later in a case-by-case basis.
For the ex post analysis, all benefits and costs are transferred to 2015 inflation-adjusted dollars, using the GDP deflator for nondefense expenses estimated by the federal Office of Management and Budget (OMB).Footnote 10 Deflator estimates are rescaled from a 2009 base year in current OMB tables to a 2015 base year in this analysis.
To predict future costs and benefits in ex ante analysis current and historical values were analysed. They were first plotted on the graphs to see general trends and potential seasonal changes. Since the OHPTC program is very young (the first credits were awarded in 2007 and certified in 2009) and some changes are even more recent (for example, fees are introduced in 2011) the trends began to form only recently, as the program slowly matures and settles. Based on the depicted trends and due to the impossibility of using more sophisticated forecasting techniques with available data, the future benefits and costs were predicted either using a three or four-year moving average, or with the assumption that the growth rate continues at the same path as in the past three or four years.
 $$\begin{eqnarray}\text{Moving average}=\frac{\mathop{\sum }_{i}^{i-n}Y_{i-n}}{T},\end{eqnarray}$$
where
 $n=\text{periods}$
, 0 to 2 (or 3) for three-year (or, four-year) moving average estimates;
 $i=$
the latest year;
 $T=$
total number of years (3 or 4 for three- and four-year moving average estimates, respectively).
The formula that was used to estimate the growth rate is the following:
 $$\begin{eqnarray}\text{Compound growth rate}=\left(\frac{Y}{X}\right)^{1/N}-1\end{eqnarray}$$
where
 $Y=$
end value (in the year 2015),
 $X=$
beginning value, and
 $N=$
the number of periods of growth.
After each benefit and cost category was estimated it was also plotted on a graph along with past trends, to be able to select a future forecast that looked more likely from the author’s perspective.
Additional estimation details are discussed for each benefit and cost category separately.
3.1 Discount rate
To evaluate whether the OHPTC program pays for itself, this paper estimates the net present value (NPV) of OHPTC from the societal and government perspectives. NPV is the difference between the present value of benefits and present value of costs:
 $$\begin{eqnarray}\mathit{NPV}=\mathit{PV}(B)-\mathit{PV}(C).\end{eqnarray}$$
The present value is estimated as
 $=\mathit{FV}/(1+r)^{n}$
, where FV is a future value of each benefit and cost (discussed in the previous section),
 $n$
is the number of considered years in the future, and
 $r$
is the discount rate. The discount rate is the interest rate that could potentially be generated if OHPTC dollars were invested elsewhere.
In this study, the future flows of benefits and costs are brought to their present values using a 2.8% nominal discount rate in the preferred analysis. The 2.8% yield was the yield on taxable state-issued General Obligation (GO) bonds in Ohio dated in 2015 with maturities in 2025 (there are no recent GO bond issues with longer maturities).Footnote 11 Taxable bonds are viewed as more appropriate for the benefit-cost analysis of government projects as the yield on such bonds better reflects the market borrowing rate for the government (Mikesell, Reference Mikesell2013, p. 328).
4 Data
Data for the benefit-cost study come from multiple sources. The estimates of administrative costs in 2014 and full-time employment estimates are compiled by the State Historic Preservation Office (SHPO) and the Ohio Development Services Agency (ODSA). The estimates for the other years are approximated based on the provided administrative data.
Data on compliance costs, property restoration costs, and information on buildings’ usage before and after the project come from proprietary data generated from an internet survey administered with the help of the Center for Economic Development at the Maxine Goodman Levin College of Urban Affairs at Cleveland State University (the survey is referenced as “CSU online survey” further in the paper). A total of 86 individuals representing 83 projects answered the survey. Duplicates (if two individuals representing the same project answered the survey) were removed from the analysis.
Property valuation and property tax data, including the data on property tax delinquencies, come from the auditors’ and county assessors’ web sites for each county with OHPTC properties. When data were not available online they were requested directly from the county auditors. Hamilton and Franklin were the largest two counties (in terms of the number of OHPTC properties) that sent the data directly.
Finally, OHPTC tax expenditure estimates were prepared jointly by the ODSA and Ohio Department of Taxation.
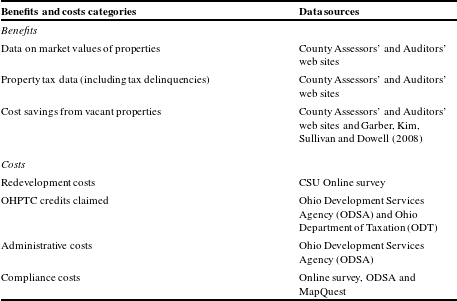
The complete list of sources used for the analysis is provided in Table 2.
Sources of data.

5 Societal benefit-cost analysis
Both the benefit-cost analysis and the fiscal impact analysis estimate benefits and costs associated with existing OHPTC programs, and compare those estimates to the status quo, or what would happen in the absence of the program. One of the limitations of this study is that it does not consider the opportunity costs of investing OHPTC dollars in alternative programs, such as direct subsidies, property tax abatements, property tax freezes, or even changes in the OHPTC programs rules or requirements (considering alternative amounts of credit, program caps, eligibility requirements, and others).
5.1 Benefits
Two types of benefits are included in the analysis. These are (1) cost savings on previously abandoned propertiesFootnote 12 and (2) increased property values of renovated structures and nearby properties affected by spillover effects from renovation. This study includes only extrinsic benefits and costs that can be quantified and monetized for the BCA purposes. Intrinsic benefits, such as a higher satisfaction from preserving cultural and historical inheritance, for example, are not a part of this analysis.
5.1.1 Property values
The property value data for the ex post analysis are calculated only for completed and certified OHPTC projects. To get certified for the credit, after the renovation efforts are completed, developers are required to reassess the value of OHPTC buildings for the property tax purposes.
The property tax data for most years and parcels were collected from the county assessors’ and auditors’ web sites. When the data were not available online the assessors’ offices were contacted directly (via e-mail and phone). Out of 106 completed projects, the data on 98 projects (218 parcels) were collected. The remaining 8 projects were assigned the average property tax values for specific years. The property tax data were collected not only on the project sites, but also on the surrounding properties within 150 feet from the centroids (geographical centers of one building to another building) using GIS systems. In total, 617 property records were included in the study after the elimination of duplicate properties in overlapping buffer zones.Footnote 13 The choice of the distance for adjacent properties was based on the Ding, Simons and Baku (Reference Ding, Simons and Baku2000) study that showed that (in Cleveland) new construction and rehabilitation have, on average, positive effects on property values located primarily within 150 feet from the investment sites. The property values of buildings outside of 150 feet zone were almost unaffected.Footnote 14
The property records could not be located for 15 OHPTC parcels (the addresses exist, but the property records are not available on auditors’ web sites). These were approximated based on the average values of OHPTC properties. The property values for the additional 22 OHPTC and non-OHPTC properties were not available for earlier years and were also approximated. Finally, 46 out of 157 OHPTC parcels (26 projects out of 106) do not have actual property records for the nearby properties. The property values and the number of parcels for these projects were approximated based on the state averages for existing parcels surrounding OHPTC properties.
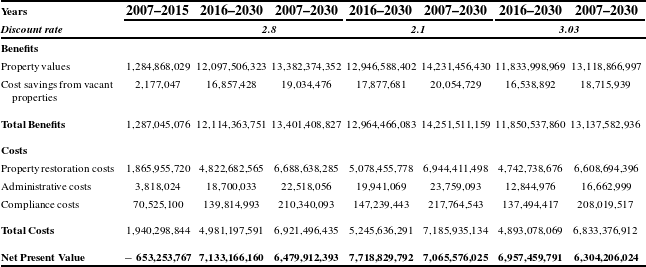
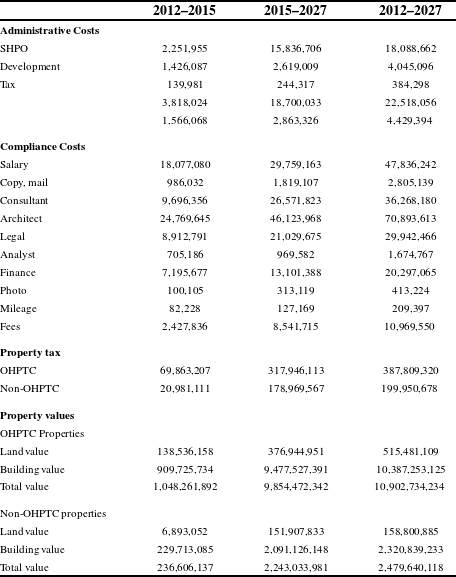
The total property values include separate estimates for the land and buildings. The increase in property values is approximated as a difference in the real (in 2015 dollars) market value of properties in the current and base (2007) year. The future property values are forecasted based on the growth rate of properties between 2007 (the first year the credit became available) and 2015 calendar years. Such mean annual growth rate in nominal terms is estimated at 3% for land, 13.7% for buildings, and 10.9% for the total property values for OHPTC properties. The values of the adjacent properties have also increased over the considered time frame, but at a much lower rate. The land value of adjusted properties increased by 0.7%, building value by 3.1%, and overall value by 2.3% over the 8-year period. The overall nominal increase in OHPTC property values was 128.5% and in non-OHPTC values, 20.5%. Table 3 shows the overall increase in (real) property values between 2007 and 2015 and predicted increase until 2030. Table 5 demonstrates such gain in values separately for land and buildings on OHPTC and nearby properties.
Societal Cost-Benefit Analysis: Net Present Value (NPV) Estimates under Different Discount Rates.

5.1.2 Cost savings from abandoned properties
Not only are abandoned properties subject to higher maintenance and demolition costs incurred by the local government, but they are also frequent sites for vandalism, arson, and other crimes that require deployment of police, fire, and other government resources. The property or any other tax revenues collected from abandoned properties are small or nonexistent. The presence of abandoned properties lowers the value, and, therefore, the property tax revenue collected from the abandoned property itself and nearby properties. Negative spillover effects from an abandoned property can spread to as far as 1500 feet. The 2008 study of the Community of Research Partners identified about 25,000 abandoned properties in the eight cities in Ohio (Cleveland, Columbus, Dayton, Ironton, Lima, Springfield, Toledo, and Zanesville). The study estimated the maintenance and demolition costs of these properties to be over 13.2 million dollars in 2006. Fire services cost an additional 1 million dollars, personnel cost of police services was about 64 thousand dollars, and the loss of tax revenues totaled over 49.2 million dollars (Garber et al., Reference Garber, Kim, Sullivan and Dowell2008).
Properties were assumed to be abandoned if property tax records indicated property tax delinquencies for more than one year. The CSU online survey additionally asked OHPTC project developers whether the property they claimed for the credit was abandoned or vacant before OHPTC renovations began. About 74% of such respondents reported that OHPTC properties they currently own were abandoned or vacant before the renovation. The other 3% mentioned that only about 50% of the buildings were in use before renovations. And, only the remaining 23% said that the properties were in use before the projects commenced. When property tax delinquency data were compared with the vacancy data reported by the developers, only about 16% of the abandoned properties reported by the respondents had delinquent tax payments. The abandoned properties in this study were chosen based on the auditors’ data on property tax delinquencies. This was done for two reasons. One, for the purposes of this research it was assumed that if the property taxes were paid on time and in full, the property was not considered abandoned (and physically maintained) even if no one physically resided in it. Second, auditors’ information allowed collecting the data not only on OHPTC, but neighboring properties as well (while the survey asked only about OHPTC and not neighboring properties). It was observed that OHPTC properties with delinquent property tax payments were more likely to be surrounded by other properties with delinquent payments. It was decided to go uniformly with auditors’ data to be able to include info on neighboring properties as well.
A total of 81 OHPTC parcels and 96 nearby parcels had delinquent payments between 2007 and 2015 calendar years and were considered vacant or abandoned in the analysis. The average cost of vacant properties is derived from the Garber et al. (Reference Garber, Kim, Sullivan and Dowell2008) estimates.Footnote 15 The same average cost per property was assigned to all cities within the same county as a city in the Garber et al. (Reference Garber, Kim, Sullivan and Dowell2008) report. For the counties not included in the report the average cost of each vacant property across eight cities was estimated for the analysis. The first projects were completed in 2009. So, 2009 is considered the first year when cost savings from abandoned properties began to materialize. The cost savings average about $2,332 and include savings from property tax loss, fire and police runs, grass cutting, etc. The savings grow each year as more and more properties undergo renovation. Cost savings from maintenance and recovered property taxes from previously abandoned properties are estimated to be around $482 thousand. As more and more properties undergo renovation, the savings are expected to add up to $4.6 million overall in the considered time frame between 2007 and 2030. The estimates of the societal cost savings from formerly abandoned properties can be found in Table 3.
5.2 Costs
Cost estimates for the societal BCA include property restoration costs that were incurred by the developers, compliance costs that were incurred by the developers, and administrative costs incurred by the OHPTC program administrators. Cost estimates do not include potential intrinsic inconvenience costs incurred by property neighbors.
5.2.1 Property restoration costs
Property restoration costs are approximated based on the survey responses by property developers, and the estimates of the Center for Economic Development at the Maxine Goodman Levin College of Urban Affairs at Cleveland State University. Future values are estimated based on a four-year moving average. Expenses for restoration are by far the major cost in societal BCA; they added up to $1.8 billion in real values between 2007 and 2015. The costs are expected to total additional $4.8 billion between 2015 and 2030 under the 2.8% discount rate. The estimates are presented in Table 3.
5.2.2 Administrative costs
Any tax policy implementation process involves two types of costs, costs of administering the tax policy (OHPTC policy in this case), and costs of complying with the policy requirements. Two government agencies, the ODSA and the Ohio Department of Taxation (ODT), and one nonprofit organization, the State Historic Preservation Office (SHPO), are responsible for administering the OHPTC program. ODSA and SHPO play key roles in administering the credit. The ODSA accepts and evaluates the applications for OHPTC, certifies the projects, and awards the credit. SHPO determines the historical value of OHPTC properties and approves and oversees the renovations. ODT mainly administers the credit claims process. Certified Local Government (CLG) may also be involved with the OHPTC program if a project qualifies as a local rather than national landmark (CLG is required to list the project as a local landmark or local historic district). CLGs are, however, rarely involved with OHPTC and in addition they are partially financed from federal funds. Their costs on a state level, from which the analysis is performed, are therefore extremely small and are not included in the analysis.
The dollar value of administrative costs in 2014 and the full-time employment equivalent (FTE) for ODSA, SHPO, and ODT between 2007 and 2014 were estimated by the ODSA staff. Administrative costs include: salary and fringe benefits; personal services (these include contracts, memberships, trainings, etc); supplies and maintenance; equipment; indirect costs; and, grants and scholarships to the developers. Only the share of administering the OHPTC is included in the analysis; the federal rehabilitation tax credit is not. The past growth in salaries was estimated based on the history of state worker pay (a 3.5% increase in 2008, and 2.5% increase in 2015 that was expected to be repeated annually for the next three years). It was assumed that there will be no salary hikes then until 2020, and the salary will be increasing at a 1.5% annual rate after 2020. For SHPO a 1.5% annual increase in salary was assumed for all analysed years. ODSA and tax departments have the same number of staff members working on the project from 2009 and according to ODSA this number is not expected to change. The dollar values of other categories were approximated based on the costs per employee in 2014 and adjusted for changes in FTE and inflation. The administrative costs were about $3.8 million (in real 2015 dollars) between 2007 and 2015, and are expected to total about $18.7 million between 2015 and 2030. The total administrative costs’ estimates can be found in Table 3. The costs for each agency are presented in Table 5.
5.2.3 Compliance costs
The OHPTC compliance costs are the resources spent to compile the application for OHPTC and ultimately claim the credit. These are the costs on company personnel such as wages, salaries, and fringe benefits; working on applications; costs of office materials; application fees; travel expenses to attend the required SHPO and sometime ODSA meetings; and costs of hiring outside contractors including architects, accountants or financial advisors, historic preservation consultants, market analysts, legal counsel, or photographers. Typically, the developers who apply for the OHPTC also apply for the federal tax credit.Footnote 16 Only the share of compliance costs related to the OHPTC, and not the federal credit, was applied to the estimates. The estimates were made based on the information collected in the CSU online survey that asked the developers to indicate the approximate share of time spent on federal and state applications. If such information was not available, it was assumed that the costs were shared in half.
The estimates of other compliance costs identified above, excluding fees and mileage, similarly come from the CSU online survey. The survey was administered to the developers who were certified (approved) to receive the OHPTC. About 40% of the survey respondents answered compliance questions. The pool of such respondents, however, was very diverse and representative of the project sites, types of renovated properties, and the project costs. The share of each type of compliance costs in the total project costs was identified for each project for which the data were available. These percentages where then averaged by year and applied to the total project size for every project where compliance costs were not available. The numbers were adjusted by the project size to account for economies of scale for larger properties.Footnote 17 The totals for each category were further adjusted to account for the percentage of the projects that identified that they did not face certain expenses (did not hire an architect, for example).
To estimate the travel costs the distance between all the approved OHPTC project sites and the ODSA office in Columbus, where meetings take place, was estimated using MapQuest. For nonapproved projects the average distance was applied. The distance was then multiplied by the per mile rate, which is annually identified by IRS.Footnote 18
The compliance costs are estimated at $70.5 million in real values between 2007 and 2015 and expected to grow up to $210.3 million until 2030. The estimates of the compliance costs can be found in Table 3. The detailed estimates by each category of costs are presented in Table 5.
5.3 Transfers
There are several types of transfer payments in the current societal BCA (cost benefit analysis). These are taxes, OHPTC claimed credits and application fees, wages and salaries, and new sales revenues. From a societal perspective, sales revenues are the transfers from consumers to producers (these are the costs to consumers and benefits to producers). Similarly, salaries and wages are the transfers from producers to consumers (costs to producers and benefits to consumers). Taxes are the transfers from consumers and producers (their costs) to government (benefits). Application fees are also transfers from developers (costs) to the ODT, ODSA, and SHPO (benefits). And OHPTC credits are the transfers from government (costs) to developers (benefits).
5.4 Overall results of the societal BCA
The societal benefit-cost analysis estimates the negative net present value (NPV), the difference between the present value of benefits and present value of costs, in ex post analysis (2007–2015). The OHPTC program, however, is estimated to pay for itself in ex ante analysis (2016–2030) (see Table 3). Under the 2.8% discount rate the annual benefits begin to outweigh annual costs toward the end of 2017 in the societal BCA. The cumulative NPV becomes positive in the beginning of the year 2023. The increase in property values is by far the highest benefit category, while property restoration costs are by far the largest source of costs in the societal BCA.
6 Fiscal impact analysis
For the fiscal impact analysis, the benefits and costs are studied purely from the government perspective. Current analysis does not consider the opportunity of investing OHPTC dollars in other projects (different tax incentives, direct subsidies, etc), which may have generated even higher tax revenues. As mentioned earlier, this analysis simply compares OHPTC credits to the status quo.
6.1 Benefits
From the government perspective the benefits of the preservation credit include cost savings for local governments on maintenance of properties abandoned before OHPTC rehabilitation efforts, as well as additional tax revenues generated by property taxes on newly renovated OHPTC and nearby properties.
6.1.1 Property tax revenues
Similar to the property values, the property tax data are collected for completed and certified projects. The property tax is expected to increase only after the value of renovated projects is getting reassessed after all renovation efforts are completed. The revenue estimates are based not on the property tax charged, but on the property tax actually collected. The estimates, therefore, incorporate information on property tax delinquencies (including those on previously abandoned properties).
The estimates show about 170% increase in nominal (136% increase in real) property tax collections between 2007 and 2015 across all OHPTC project sites, and 62% increase in nominal (42% in real) property tax collections across all adjacent properties. For 2016 estimates and beyond, similarly to how future property values were forecasted, the overall rate of growth in property values during the entire period between 2007 and 2016 is considered. The nominal annual growth rate for OHPTC properties was 13.2% and neighboring properties, 6.2%.
For the benefit-cost analysis the focus is not on the property tax collections per se, but on the additional tax revenues generated by the OHPTC projects. For each year of the analysis the real value of 2007 tax revenue was estimated. It is assumed that 2007 revenue is the base tax yield that would be generated in the absence of OHPTC rehabilitation projects. To identify the value added by the OHPTC projects, the base revenue is subtracted from the observed property tax revenues in an ex post analysis and from the predicted values in an ex ante analysis. Current approach overestimates the value added by OHPTC as some of the projects would happen even in the absence of the credit (this possibility is accounted for in the Sensitivity analysis). However, out of 48 respondents who answered the question of whether the renovations would happen in the absence of OHPTC in the online survey, 43 respondents said no, and 5 others replied yes, but mentioned that their project expanded thanks to OHPTC.Footnote 19
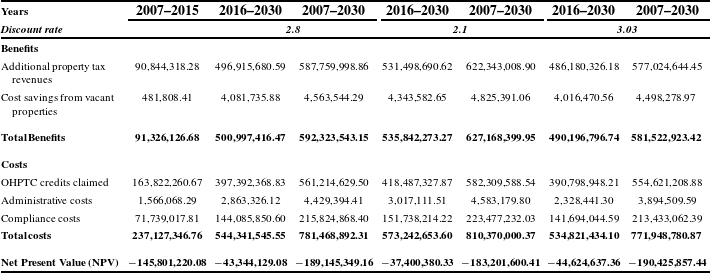
Overall estimates of the additional property tax revenues under different discount rates can be found in Table 4. The estimates of the property tax values separately for OHPTC and nearby non-OHPTC properties are presented in Table 5.
Fiscal Impact Analysis: Net Present Value (NPV) Estimates under Different Discount Rates.

Detailed Cost and Benefit Estimates under 2.8% Discount Rate.

6.1.2 Cost savings from abandoned properties
The estimates of the cost savings from previously abandoned properties are the same as those discussed in societal BCA. They are similarly based on collected property tax data and the cost of abandoned properties as estimated in Garber et al. (Reference Garber, Kim, Sullivan and Dowell2008). The only difference is that the savings from property tax delinquencies are now handled separately in the “Property Tax Revenues” section above. The cost of every abandoned property with the subtraction of the tax loss is about $1,004.11.Footnote 20 The cost savings between 2007 and 2015 accumulated to $481.8 thousand real dollars (with the subtraction of property tax losses) and expected to increase to $4.1 million in the next 15 years between 2016 and 2030. The estimates can be found in Table 4.
6.2 Costs
The three major categories of costs related to the OHPTC are the loss of the tax revenues associated with the provision of the credit itself (tax expenditures), the costs of administering the credit, and compliance costs. The potential loss of property tax revenues during construction are not singled out in a separate category of costs, but rather is incorporated in the estimates of the property tax revenues that are reduced by the amount of tax delinquencies.
6.2.1 Tax expenditures due to OHPTC
Similar to any other credit OHPTC is designed to reduce the tax liability of a claimant. While credits and other tax preferences are introduced either to help taxpayers to cope with certain financial hardships they may have incurred during the tax year, or to encourage a certain type of behavior (preservation of historical structures, in our case), they inevitably lead to a loss of tax revenues that could have been collected if such provisions did not exist in the tax code. According to the estimates offered in this fiscal impact analysis, about $163.8 million were claimed between 2009, the year when the first tax credits were claimed, and 2015. By 2030, the last analysed year, the revenue loss due to OHPTC may add up to $561 million (see Table 4 for estimates under different discount rates). The future loss of tax revenues by claiming OHPTC was estimated as a moving average of the credit claimed in the past three years. The amount of claimed credits was constant in the past five years (except for a drop in 2013), just like the amount of OHPTC awarded. Nothing indicates that there might be a spike, or substantial drop in the amount of the credits claimed in the considered future.
6.2.2 Administrative costs
Of three agencies analysed in societal BCA only two, ODSA and ODT, are government organizations. SHPO is a nonprofit. Since the assessment of benefits and costs is conducted from the government perspective, the administrative costs of SHPO are not included in the fiscal analysis (but are a part of societal benefit-cost analysis). The administrative costs of all three agencies, estimated in the societal BCA, were around $3.8 million between 2007 and 2015 (Table 3), and totaled to a little less than $1.6 million in the fiscal impact analysis, over the same period of time, when only the administrative expenses of ODSA and ODT are included (Table 4). The detailed administrative costs estimates for each agency can be found in Table 5.
6.2.3 Compliance costs
The compliance costs estimates in the fiscal impact analysis are similar to those, discussed in societal BCA. The only difference is in how developers’ fees are handled. In societal BCA, fees are pure transfers from developers to three agencies administering the credit. Since, one of the agencies that receives a portion of the fees, the SHPO, is a nonprofit organization, not included in the fiscal impact analysis, the fees are treated somewhat differently in fiscal impact estimates.
Three types of fees are associated with the OHPTC application and claiming process. These are application, servicing, and certification fees. The fees were introduced in July of 2011 and were collected beginning in 2012. The fees are applied at different stages of the process. An application fee is paid when the application for OHPTC is submitted, a servicing fee is collected within three months of application approval, and a certification fee is submitted after the project is completed and certified to receive a credit. The application fee is, therefore, paid by all developers who apply for the OHPTC. Servicing and certification fees are paid only on the projects that were awarded the credit. The fees were estimated based on official OHPTC fee schedules and the status of each project.Footnote 21 The future fees were approximated based on the three-year moving average. The revenues from application fees are divided equally between SHPO and ODSA, as only ODSA is a government agency. The 50% of the fees that ODSA receives are considered a transfer (an expense for the developers and a revenue for ODSA). The 50% that is paid to SHPO is considered a compliance cost.
Compliance costs in societal BCA totaled $70.5 million between 2007 and 2015 (see Table 3). The compliance costs in the fiscal impact analysis accumulated to $71.7 million (see Table 4). The detailed estimates of the compliance costs are offered in Table 5.
6.3 Transfers
New sales and employment (and, consequently, additional sales and income taxes) originated on OHPTC (and nearby) properties are regarded as transfers in this fiscal impact analysis. Such new sales and employment are assumed to be relocated to OHPTC properties geographically from the other nearby locations. The scale of OHPTC projects is relatively small. The sales and employment might be “new” for a city, or even a county, but it is reasonable to consider them as transfers on the state level, on which the analysis is performed. It is also extremely hard to assess the employment benefits for previously unemployed individuals who might be newly employed on OHPTC properties, since it is unknown how much they valued their leisure before work (including the opportunity cost of losing free time, unemployment benefits, potential tax advantage and direct benefits from government assistance programs for lower income individuals).Footnote 22 Besides, the developers noted in the CSU online survey that after reconstruction OHPTC facilities are mainly used for such purposes as book and grocery stores, restaurants, hotels, hair salons, antiques galleries, and others. It is logical to expect that individuals employed in these renovated facilities are likely to be lower skilled and receive lower wages, closer to the value of their leisure time.
6.4 Results
The net present value in the fiscal impact analysis is negative in both the ex post analysis (2007–2015) and in ex ante analysis (2015–2030) (see Table 4). Although, annual benefits begin to outweigh annual costs in the very beginning of 2025, the cumulative NPV does not turn positive because of the high initial costs and low benefits. Property tax revenues are by far the highest source of benefits in the fiscal impact analysis. However, time is needed to accumulate such revenues. Despite 13.2% average annual growth rate observed in ex post analysis, the revenues begin accumulating not earlier than renovations are completed on the first OHPTC projects and properties get reassessed for tax purposes. The more projects are completed the higher the revenues. While both types of benefits included in the fiscal impact analysis, the additional property tax revenues, and costs savings from abandoned properties, accumulate over time, the costs do not accumulate over time, but remain particular for the specific year. For example, additional property tax revenues steadily increased between 2011 and 2015, from $2.8 million to $12.1 million in real 2015 dollars (the increase was much smaller before than). Cost savings from previously abandoned properties increase from $26 thousand to $144 thousand in real values. However, the cost categories, including the highest one of them, the amount of tax losses from claiming the credit, while also increased (as the number of projects receiving the OHPTC became higher), grew at a much lower rate. Over time the accumulated benefits are forecasted to outweigh accumulated costs, but it is not expected to happen until the end of the forecasted period, under current assumptions.
7 Sensitivity analysis
The sensitivity analysis assumes different (lower and higher) discount rates. The sensitivity analysis additionally assumes that not 100% of benefits and certain costs are attributed to OHPTC, but some of these are attributable also to the federal historical preservation credit. The selection of alternative discount rates and results, when different weights are applied to benefits and some costs are discussed below. Additionally, the sensitivity analysis discusses the potential of accounting for implicit benefits of the credit, and accounting for properties with denied OHPTC applications.
7.1 Alternative discount rates
Sensitivity analysis is performed with additional discount rates of 2.1% and 3.03%. The latest taxable general obligation bonds issued by the state of Ohio in March of 2016 have a 10-year yield of 2.45%. The latest tax-exempt Ohio GO bonds issued in March 2017 have a 10-year yield of 2.13 and 2.22%. The current yield on 10-year AA-rated municipal bonds has been about 2.28% (in March 2017), and the yield on similar rated corporate bonds has been about 3.03%, according to Yahoo Finance.Footnote 23 The lower and the upper bound of current rates, the 2.1% and 3.03% were included in sensitivity analysis.
As expected, the OHPTC program is paid off quicker under the lower discount rate and paid off slower under the higher discount rate. The accumulated NPV under the preferred 2.8% discount rate in the societal BCA is $7,133 million between 2016 and 2030. It is $7,718 million under the 2.1% discount rate and $6,957 under the 3.03% discount rate (see Table 3 for details). Under the 2.1% discount rate the OHPTC program will start to generate a positive NPV in the middle of 2017, and accumulated NPV will turn positive in year 2022 (compared to 2025 under the 2.8% discount rate in the preferred analysis).
The fiscal impact analysis indicates that the present value of costs will still outweigh the present value of benefits in the considered period under different discount rates, but the losses will be smaller under the lower discount rate. Losses of $43.3 million are expected between 2016 and 2030 under the preferred 2.8% discount rate, compared to $37.4 million under 2.1% discount rate, and $44.6 million under 3.03% discount rate. The present value of benefits in a single year will begin to outweigh the present values of costs earlier in 2025 under the lower discount rate and later in 2025 under a higher discount rate.
7.2 The share of OHPTC in total benefits
The sensitivity analysis is additionally performed with different contributions of OHPTC to total benefits. OHPTC is awarded in addition to the federal credit. While costs (besides project renovation costs in the societal BCA) are estimated based on the perception of developers and government officials about how many resources they spend on OHPTC rather than federal credit, and actual tax loss due to OHPTC, the benefit estimates in the preferred specification attribute all benefits to OHPTC. It is likely that the larger share of benefits should indeed be attributable to OHPTC because OHPTC is competitively awarded, while Federal credits are guaranteed with every application. As discussed earlier, OHPTC is more generous that the federal credit. The sensitivity analysis is performed with two assumptions. First, it is assumed that the total estimated amount of cost savings, property values, tax revenues, and renovation costs of the OHPTC projects are reduced by 25%. 75% is assumed to be a relative contribution of OHPTC rather than federal projects. Second assumption is that equal shares of benefits (50% and 50%) are attributable to the OHPTC program and federal credits.
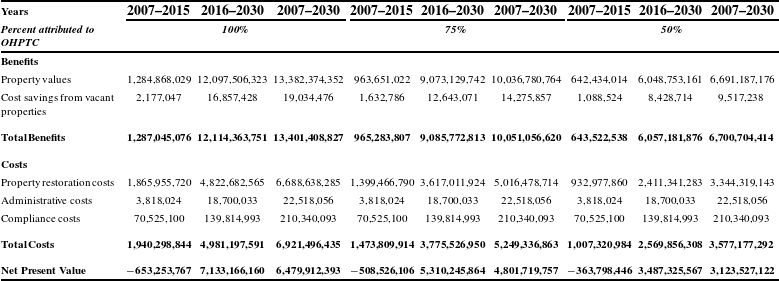
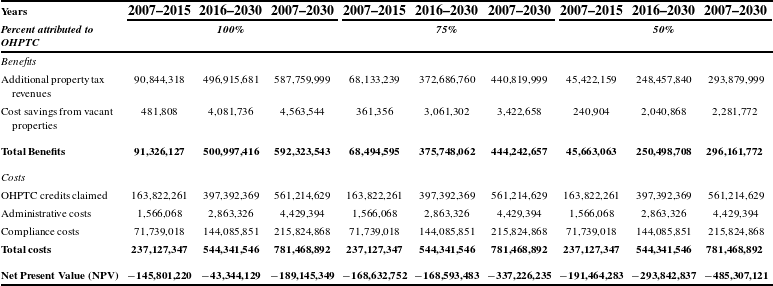
In the societal BCA we still observe the negative NPV in ex post analysis under the 75% and 50% assumptions (see Table 6 for details). Here both types of benefits, and the property restoration costs are reduced by 25% and 50%, while administrative and compliance costs remain the same. The past costs are estimated to exceed the past benefits by $363.8 million under the 50% assumption, compared to $508.5 million under the 75% assumption, and $653.2 million under the assumption that 100% of benefits are attributable to OHPTC. The NPV is estimated to remain positive in ex ante analysis under any considered scenarios. The present value of benefits exceeds present value of costs by $3,487 million between 2016 and 2030 under the 50% assumption.
In the fiscal impact analysis (Table 7) benefits are reduced by 25% or 50%, while all costs (administrative, compliance, and tax revenues loss due to the credit) are already approximated solely for the OHPTC. Expectedly, the NPV under any hypothesis goes further down and takes the highest plunge under the 50% assumption, meaning that it would take even longer for OHPTC program to pay for itself, from the government perspective, if OHPTC benefits are attributed not only to OHPTC, but also to the federal preservation credit.
Societal Cost-Benefit Analysis: Net Present Value (NPV) Estimates under 2.8% Discount Rate and Various Shares of OHPTC in Total Benefits and Costs.

Fiscal Impact Analysis: Net Present Value (NPV) Estimates under 2.8% Discount Rate and Various Shares of OHPTC in Total Benefits and Costs.

7.3 Accounting for properties with denied OHPTC applications
The societal BCA and fiscal impact analysis may yield more precise results, if property values and property tax revenues of existing OHPTC projects are compared to the properties that were denied the credit. From 46 projects that applied before 2012, but never received the credit, the property tax data were collected on 38 properties (the earlier year was chosen to better capture the incidence of properties that were denied the credit repetitively). The parcel search of the remaining 8 properties showed that these properties have likely been demolished. The property value of 38 properties (58 parcels) not approved for the credit increased by $60.3 million between 2007 and 2015 ($1 million on average per parcel). The additional property tax collections were $1.38 million ($23.8 thousand on average per parcel). To put this into the perspective, the value of properties that received the OHPTC increased on average by over $4.6 million per parcel and the property tax collections increased by $402 thousand per parcel.
Despite the sharp differences in the magnitude of the increase in property values and tax collections between the properties that received and were denied the OHPTC, the property values clearly grew in both cases. If there is indeed an upward trend, then the preferred BCA and fiscal impact analyses overestimate the benefits of OHPTC. Unfortunately, it is hard to say if this is true. A number of properties that were repetitively denied the credit were demolished and the property tax records simply do not exist for them any longer. An example of such property would be a historic Kress Building in Youngstown, OH that was denied the OHPTC for the $5.2 million restoration costs and was eventually demolished in 2014 (Lendel et al., Reference Lendel, Candi, Ellen, Tatyana, Merissa, Stephanie, Charlie and Kenneth2015). Incorporating the property data on demolished properties would bring the estimates on the projects that were denied the credit, down.
The property estimates on 38 properties that were not approved for the credit are also overestimated because they include some of the properties that have been renovated thanks to other, non-OHPTC grants, loans, and other incentives. Magnolia on Detroit apartments in Cleveland is one such example. The application for OHPTC was submitted in 2011 and denied. The building was eventually renovated with the help of the low-income housing tax credit by the Ohio Housing Finance Agency, funds provided by the City of Cleveland’s Housing Trust Fund, HUD-insured mortgage, and additional loan.Footnote 24 The total assessed value of this property increased from under $26 thousand in 2013 to over $2.1 million in 2014. The property tax collections increased from $899 in 2013 to $99,400 in 2014. The effect of other factors that may have contributed to the increase in property values, including the potential presence of an overall upward trend, can be estimated with regressions analysis, which is outside of the scope of this study, and was not included in the base, or the sensitivity analysis.
7.4 Accounting for implicit benefits
As noted earlier, this research has also not accounted for implicit values of historical preservation. To estimate implicit benefits (and costs), separate contingent valuation studies are needed. Such studies are based on the surveys that inquire how much respondents would be willing to contribute to a preservation of a historic site (directly, or through tax withholding, for example). In one such project, Chambers, Chambers and Whitehead (Reference Chambers, Chambers and Whitehead1998) estimate the willingness to pay (WTP) to measure the nonmarket value of historic preservation of the Ste. Genevieve Academy in Missouri. The authors approximate the WTP between $5.07 and $6.48 per household.
Kling, Revier and Sable (Reference Kling, Revier and Sable2004) estimate WTP and paired comparison (PC)Footnote 25 , to measure the nonmarket value of a historic Northern Hotel in downtown Fort Collins, Colorado. The authors’ estimates were highly sensitive to the assumptions, the extent of respondents’ knowledge about the historic site, and personal characteristics. WTP ranged between as little as $3 to as much as $353 per household. PC ranged between $24 and $779 per household. The authors note that the actual restoration of the Hotel occurred after the completion of the survey and before the research was published at a cost of about $17 per household.
Given the wide range of existing estimates, the lack of relevant contingent valuation studies in Ohio (and a very small number of such studies in the United States in general), and the vast variety of historical buildings participating in OHPTC, it is hard to quantify the implicit benefits of OHPTC sites. A simple break-even analysis shows that under the 2.8% discount rate, from the societal perspective the project would pay for itself in current 2017, if explicit benefits added up to about $715.3 million, and would have to be about $380 million for OHPTC program to break even in 2020. Given these high numbers it is not reasonable to assume that explicit benefits would be high enough for OHPTC program to break even any time before 2023. For example, under the assumption that 100 households would be willing to pay an average of $15 for the restoration of each one of the OHPTC 106 completed sites, the total WTP for restoration would be only $159,000 (and this is not accounting for the implicit restoration costs).
8 Conclusions and policy implications
Overall, both the societal BCA and fiscal impact analysis show that the OHPTC program has not yet paid for itself (Net Present Value, NPV, is negative). The costs of providing the credit outweighed the monetary benefits for society and for state and local government. In general, from the societal perspective, the OHPTC program has generated approximately $1.3 billion in benefits and $1.9 billion in costs. From the fiscal perspective alone, the OHPTC program has generated approximately $91.3 million in benefits over the eight years since its inception in 2007, while the combined costs of providing the credit over the same time totaled approximately $237.1 million.
The historical preservation tax credit program in Ohio was introduced less than 10 years ago. Any such large-scale program requires high start-up costs and ongoing investments that are not initially accompanied by sufficient benefits. Such benefits, however, accumulate over time. The societal cost-benefit analysis shows that future, single-year benefits are expected to outweigh future, single-year costs starting in 2017. The combined accumulated benefits are forecasted to exceed accumulated costs in 2023 under the 2.8% and 3.03% discount rates, and in 2022 under the 2.1% discount rate.
In the fiscal impact analysis, the present value of benefits in a single year begins to exceed the present value of costs in 2025. But, when the overall costs accumulated from the day of program inception in 2007 are compared to total accumulated benefits, NPV remains negative over the entire studied period (until 2030), although the gap between the benefits and costs consistently decreases and is expected to eventually turn in a positive direction.
As with any benefit-cost analysis, this study includes only the benefit and cost estimates that can be quantified and monetized. Preservation of heritage, however, creates much more than construction jobs for localities, return on investment for developers, and additional tax revenues for government. Historic preservation allows people to learn from past to build a better future. It pays respect to those who lived before us. It provides satisfaction from visualizing certain buildings and artifacts, and much more. All these intangible values are not a part of this benefit-cost assessment. A separate contingent valuation study would be beneficial to help answer some of these questions.