







1. Introduction
Self-propulsion at the micrometre scale frequently occurs in nature (Bray Reference Bray2000; Lauga & Thomas Reference Lauga and Thomas2009; Jeanneret et al. Reference Jeanneret, Pushkin, Kantsler and Polin2016; Lauga Reference Lauga2016). For example, microorganisms self-propel to search for nutrients, different temperatures or sunlight. Inspired by such motile biological organisms, extensive studies on artificial microswimmers have been done over the last one and a half decades, especially on self-propelled phoretic particles (Golestanian, Liverpool & Ajdari Reference Golestanian, Liverpool and Ajdari2007; Jiang et al. Reference Jiang, Chen, Tripathy, Luijten, Schweizer and Granick2010; Maass et al. Reference Maass, Krüger, Herminghaus and Bahr2016; Jin, Krüger & Maass Reference Jin, Krüger and Maass2017; Moran & Posner Reference Moran and Posner2017; Bär et al. Reference Bär, Großmann, Heidenreich and Peruani2020; Qi et al. Reference Qi, Westphal, Gompper and Winkler2020). Also, dissolving or chemically reacting droplets can show such phenomena (Krüger et al. Reference Krüger, Klös, Bahr and Maass2016; Li et al. Reference Li, Diddens, Prosperetti, Chong, Zhang and Lohse2019; Vajdi Hokmabad et al. Reference Vajdi Hokmabad, Baldwin, Krüger, Bahr and Maass2019; Lohse & Zhang Reference Lohse and Zhang2020). A typical feature of the self-propelled particles is that, instead of swimming with appendages, they can propel themselves by converting free energy from the environment into kinetic energy (Ebbens & Howse Reference Ebbens and Howse2010; Ramaswamy Reference Ramaswamy2010).
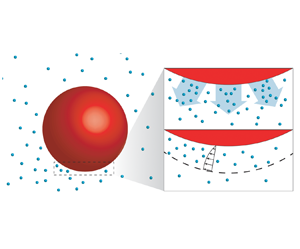
The driving mechanism behind the propulsion of phoretic particles is diffusiophoresis (Anderson Reference Anderson1989). Note that in some literature the terminology ‘diffusio-osmotic effect’ is used to indicate the same mechanism. The basic feature is that whenever there exists a tangential concentration gradient on the surface of the particle, there is an induced flow within the interaction layer adjacent to the surface, as shown in figure 1. Since the layer is much thinner than the size of the object, the flow is conveniently described with a slip velocity at the surface (Golestanian et al. Reference Golestanian, Liverpool and Ajdari2007). This effect can also be generalized to other coupled fields such as the temperature or the electric fields. The resulting flows are, respectively, referred to as thermo-phoretic or electro-phoretic (Long, Stone & Ajdari Reference Long, Stone and Ajdari1999; Squires & Bazant Reference Squires and Bazant2006; Piazza Reference Piazza2008; Moran & Posner Reference Moran and Posner2011).
Schematic illustration of the catalytic particles (red) with chemical reaction and diffusiophoresis near the interface. The product originating from the catalytic reaction at the particle surface is shown in cyan. Panel (b) shows a close-up of panel (a). If there is a concentration gradient at the interface, a slip velocity is induced (diffusiophoresis). Beyond a critical reaction rate (expressed as a critical Péclet number), such gradient emerges through a linear instability.

The classical mathematical framework for the study of self-propelled particles has often neglected the effect of solute advection (Golestanian et al. Reference Golestanian, Liverpool and Ajdari2007). Michelin, Lauga & Bartolo (Reference Michelin, Lauga and Bartolo2013), however, it has revealed that the Péclet number  $Pe$ is an important parameter controlling the motion of self-propelled particles. Here
 $Pe$ is the ratio of the solute advection to the diffusion rates. Through a linear stability analysis and corresponding simulations, Michelin et al. (Reference Michelin, Lauga and Bartolo2013) found that when
 $Pe$ is larger than the critical value
 $Pe_{cr}=4$, a spherical active particle by dissolution and chemical reaction exhibits a motion in a preferred direction which breaks the rotational symmetry of the system. Later, Michelin & Lauga (Reference Michelin and Lauga2014) performed a comprehensive theoretical study on how the moving speed of the active particle depends on
 $Pe$, and generalized the theory to any coverage of the reacting surface.
For large enough  $Pe$, some fascinating features can emerge. Hu et al. (Reference Hu, Lin, Rafai and Misbah2019) have numerically observed that for large enough Péclet numbers, such an active isotropic particle acquires chaotic trajectories. Analogously, in the problem of active droplets, Ruckenstein (Reference Ruckenstein1981) also found similar helical or chaotic motions, as caused by the interfacial Marangoni flow (Herminghaus et al. Reference Herminghaus, Maass, Krüger, Thutupalli, Goehring and Bahr2014; Maass et al. Reference Maass, Krüger, Herminghaus and Bahr2016; Suga et al. Reference Suga, Suda, Ichikawa and Kimura2018). Though the phenomena of active droplets and active particles look similar, Krüger et al. (Reference Krüger, Klös, Bahr and Maass2016) explained that the helical trajectory of the active droplet is attributed to the coupling between the internal flow and the direction of the nematic field, whereas such internal flow is obviously absent in particles. In a further study, Morozov & Michelin (Reference Morozov and Michelin2019a) have considered both Marangoni and diffusiophoretic effects into their numerical simulation, and also demonstrate that a chaotic oscillation of the droplet can occur.
Very recently, Michelin et al. (Reference Michelin, Game, Lauga, Keaveny and Papageorgiou2020) investigated a simplified system, namely a uniform phoretic channel. They reported spontaneous symmetry-breaking of the solute distribution which provides a route to understanding the propulsion of isotropic active particles. However, it remains necessary to understand how the Schmidt number (defined as the ratio of kinematic viscosity to solute diffusivity) influences the diffusiophoretic instability. Furthermore, the high Péclet number regime is still not fully explored, and we will see that an interesting chaotic flow arises there.
A flow closely related to the diffusiophoretic flow is Bénard–Marangoni convection, where a spontaneous flow instability occurs too. In that system, the flow is driven by a surface tension difference caused by a variation of the temperature at the fluid surface (Pearson Reference Pearson1958; Davis Reference Davis1987; Bergeon et al. Reference Bergeon, Henry, Benhadid and Tuckerman1998; Boeck & Vitanov Reference Boeck and Vitanov2002). These two systems share some similarities in their symmetry-breaking mechanism and with the chaotic flow motion at high enough Péclet or Marangoni number. However, the two systems are different problems, with diffusiophoretic flow being driven by the phoretic velocity at the surface, and Bénard–Marangoni being driven by the difference in surface tension.
Motivated by the above mentioned recent findings, in this paper we focus on the instability due to chemical reactions and the resulting diffusiophoretic flow near a catalytic interface, especially in the large  $Pe$ regime. To start with some reduced complexity, we first consider a simplified model, namely diffusiophoretic flow over a catalytic plane, in order to study the dynamics near the catalytic surface (see figure 2). This simplified model can reproduce the important features of the diffusiophoretic flow, and it is also convenient to avoid the added complexities arising from the curvature of the surface. In the second part of the paper we go beyond the simplified model and numerically examine the plume emission and merging phenomena for chaotically moving phoretic particles.
The set-up of the system with the boundary conditions. A catalytic plane is located at the bottom of the domain. Periodic boundary conditions are applied in the  $x$-direction.

The paper is organized as follows. After a description of the problem set-up and the control parameters in § 2, the linear stability analysis for the catalytic plane system is performed in § 3. Then the numerical method and numerical set-up are provided in § 4.1. The numerical results for the catalytic plane are presented in § 4.2. Then we extend our research to phoretic particles in § 5. Finally, conclusions and a look forward to further work are given in § 6. The details of the linear stability analysis is given in Appendix A.
2. Problem set-up and control parameters
We start with the two-dimensional system sketched in figure 2. The domain has periodic boundary conditions on both sides and a catalytic plane at the bottom. The width and height of the domain are denoted by  $L$ and
 $H$. The physical variables to describe the system are the concentration of the product
 $\hat {c} (x,y,t)$ and the velocity of the fluid
 $\hat {\boldsymbol {u}}(x,y,t)$. Note that all dimensional physical variables are marked with a hat (e.g.
 $\hat {c}$,
 $\hat {\boldsymbol {u}}$), while the dimensionless ones without (e.g.
 $c$,
 $\boldsymbol {u}$). At the catalytic surface, chemical reactions take place which convert the reactant into the product. By assuming a constant reaction rate, the concentration boundary condition of the product at the bottom plane is given by
 \begin{equation} \left. D\frac{\partial \hat{c}}{\partial \hat{y}}\right|_{y=0}={-}\alpha, \end{equation}
where  $D$ is the diffusivity of the product in the fluid and
 $\alpha$ measures the strength of the reaction activity at the catalytic surface, i.e. the generation of solute by the reaction.
The tangential concentration gradient induces a slip velocity at the surface of the plane. This is the so-called diffusiophoretic flow, which is parallel to the surface and its magnitude is proportional to the tangential concentration gradient. The relationship between the induced slip velocity and the tangential concentration gradient is given by
 \begin{equation} \hat{u}|_{y=0}=M\frac{\partial \hat{c}}{\partial \hat{x}}, \end{equation}
where  $M$ is the phoretic mobility. The sign of
 $M$ can either be positive or negative, depending on the type of the solute-surface interaction (Anderson Reference Anderson1989). Michelin et al. (Reference Michelin, Lauga and Bartolo2013) prove that the diffusiophoretic system is unstable only if
 $M\alpha$ is positive. In this work, we study the case
 $M>0$ and
 $\alpha >0$.
The time evolution of the concentration field  $c(x,y,t)$ and the velocity field
 $\boldsymbol {u}(x,y,t) =(u(x,y,t),v(x,y,t))$ are governed by the Navier–Stokes equations and the convection–diffusion equation. The characteristic scales for non-dimensionalization are
 $M \alpha /D$ for velocities,
 $L$ for lengths and
 $\alpha L/D$ for concentrations. The dimensionless form of the governing equations can then be written as
 \begin{gather} \frac{\partial c}{\partial t}+\boldsymbol{u}\boldsymbol{\cdot}\boldsymbol{\nabla} c= \frac{1}{Pe}\nabla^2 c, \end{gather}
 \begin{gather} \frac{\partial \boldsymbol{u}}{\partial t}+(\boldsymbol{u}\boldsymbol{\cdot} \boldsymbol{\nabla})\boldsymbol{u}={-}\boldsymbol{\nabla} p+\frac{Sc}{Pe}\nabla^2 \boldsymbol{u},\quad \boldsymbol{\nabla} \boldsymbol{\cdot} \boldsymbol{u}=0, \end{gather}
where  $Pe$ is the Péclet number, characterizing the ratio of the solutal advection rate to the diffusion rate and
 $Sc$ the Schmidt number, characterizing the ratio between the momentum and mass diffusivities,
 \begin{equation} Pe=\frac{M\alpha L}{D^2}, \quad Sc=\frac{\nu}{D}. \end{equation}
Note that for the case of fixed  $Pe$ and
 $Sc \rightarrow \infty$, the pressure term in (2.4a) should be rescaled as
 $p'={p}/(Sc/Pe)$, since the pressure gradient always exists, even in Stokes flow, where it then balances the viscous forces.
In dimensionless form, the concentration boundary condition at the catalytic plane becomes
 \begin{equation} \left.\frac{\partial {c}}{\partial {y}}\right|_{y=0}={-}1. \end{equation}
The tangential velocity is proportional to the tangential concentration gradient, and its dimensionless form is
 \begin{equation} u|_{y=0}=\frac{\partial c}{\partial x}, \end{equation}
while the normal component of the velocity vanishes at the plane surface
 \begin{equation} v|_{y=0}=0. \end{equation}
Both the velocity and the concentration boundary conditions at the top wall are zero,
 \begin{equation} \boldsymbol{u}|_{y=H}=0, \quad c|_{y=H}=0. \end{equation}
In § 3, we have conducted the linear stability analysis with a semi-infinite domain. We note that for aspect ratios  $H/L > 0.8$ (discussed in § 4), the growth rate of the instability becomes insensitive to the aspect ratio. Therefore, we can compare the results on a linear stability analysis for a semi-infinite domain with the numerical results for a finite domain with
 $H/L=1$.
3. Linear stability analysis for catalytic plane
In this section, the linear stability analysis is performed to investigate the stability of the system. In the linear stability analysis we add small amplitude perturbations to the basic state
 \begin{align} \boldsymbol{u} = \bar{\boldsymbol{u}}(y,t)+\epsilon \tilde{\boldsymbol{u}}(x,y,t), \quad p =\bar{p}(y,t)+ \epsilon \tilde{p}(x,y,t), \quad c = \bar{c}(y,t) + \epsilon \tilde{c}(x,y,t), \end{align}
where  $\bar {\boldsymbol {u}}$,
 $\bar {p}$ and
 $\bar {c}$ are the basic state of the velocity, pressure and concentration fields, and
 $\epsilon \tilde {u}, \epsilon \tilde {p}$ and
 $\epsilon \tilde {c}$ are small perturbations with the coefficient
 $\epsilon \ll 1$.
A trivial solution to the basic configuration is a static state with zero velocity and pressure. Substitute zero velocity into (2.3), the concentration field is (see Appendix A, see also Wu, Ma & Zhou (Reference Wu, Ma and Zhou2006, p. 144))
 \begin{equation} \bar{c}(y,t)=\int_0^t \frac{ 1 }{\sqrt{{\rm \pi} Pe (t-\tau)}} \exp \left[ - \frac{Pe y^2}{4 (t-\tau)} \right] \textrm{d} \tau. \end{equation}
For  $t\rightarrow \infty$ and any finite
 $y$, we obtain the following concentration gradient:
 \begin{equation} \frac{\partial \bar{c}}{\partial y} ={-}1 \end{equation}
at the catalytic plane.
Substituting (3.1a–c) and (3.3) into the governing equations (2.3) and (2.4a,b), with base flow  and
 $\bar {p}(y,t)=0$, and keeping only the
 $O(\epsilon )$-terms, we get that the linearized governing equations are
 \begin{gather} \frac{\partial \tilde{c}}{\partial t}={-}\tilde{v}+ \frac{1}{Pe}\nabla^2 \tilde{c}, \end{gather}
 \begin{gather} \frac{\partial \boldsymbol{\tilde{u}}}{\partial t}={-}\boldsymbol{\nabla} \tilde{p}+\frac{Sc}{Pe}\nabla^2 \boldsymbol{\tilde{u}}, \quad \boldsymbol{\nabla} \boldsymbol{\cdot} \tilde{\boldsymbol{u}}=0. \end{gather}
The boundary conditions become
 \begin{equation} \left. \frac{\partial \tilde{c}}{\partial y} \right|_{y=0} = 0, \quad \left. \tilde{u} \right|_{y=0} = \left. \frac{\partial \tilde{c}}{\partial x} \right|_{y=0}, \quad \left. \tilde{v} \right|_{y=0} = 0. \end{equation}
We now assume as ansatz a separation of variables and periodic behaviour in the lateral direction, such that the perturbation can be written as
 \begin{equation} (\tilde{u}(x,y,t), \tilde{v}(x,y,t), \tilde{p}(x,y,t),\tilde{c}(x,y,t))=(\check{u}(y), \check{v}(y), \check{p}(y), \check{c}(y))\exp({\textrm{i}kx + st}), \end{equation}
where  $k=2{\rm \pi} n$ and
 $n \in \mathbb {N}$ is the wavenumber. This is the standard normal mode analysis (see, for example Drazin & Reid (Reference Drazin and Reid2004)). Note that the sign of
 $s$ determines the flow stability of the system:
 $s>0$ means exponential growth, or instability (the larger, the more unstable), whereas
 $s<0$ indicates stability. Combining the above equations, (3.4)–(3.7), and the boundary conditions, we obtain the following relation which allows us to calculate how the stability depends on
 $Pe$ and
 $Sc$ (detailed derivations are in Appendix A):
 \begin{equation} Pe = k \sqrt{1+ \frac{ s Pe }{ k^2}} \left( 1 + \sqrt{1+ \frac{ s Pe }{ k^2}} \right) \left( \sqrt{1+ \frac{ s Pe }{ Sc\, k^2}} + \sqrt{1+ \frac{ s Pe }{ k^2}} \right). \end{equation}
Assuming  $s=0$ in (3.8), we get the critical
 $Pe$ for transition from stability to instability for different wavenumber
 $n$,
 \begin{equation} Pe_{cr}=4k=8{\rm \pi} n. \end{equation}
Note that  $Pe_{cr}$ is independent of
 $Sc$.
If we combine (3.8) and its derivative with respect to  $n$, we obtain the following function of the maximum growth rate at different wavenumber for
 $Sc=1$ (for a detailed derivation see Appendix A),
 \begin{equation} s=\frac{85 \sqrt{17} - 349}{128}Pe\approx 0.0114Pe, \end{equation}
and the corresponding wavenumber is
 \begin{equation} n_{{max}}=\left\lfloor \frac{ 31 - 7 \sqrt{17} }{32{\rm \pi}} Pe \right\rceil \approx \lfloor 0.0213Pe \rceil, \end{equation}
where the symbol  $\lfloor \ \rceil$ represents the calculation of the nearest integer.
The exponential growth rate  $s$ as obtained from (3.8) as function of
 $Pe$ and
 $Sc$ for the case of
 $n=1$ is shown in figure 3(a). Moreover,
 $s$ as a function of
 $Pe$ for different wavenumbers and
 $Sc=1$ is plotted by the solid curves in figure 3(b). The dashed line shows the maximum growth rate curve, which is (3.10). The way to calculate figure 3 from (3.8) is explained in Appendix A.
(a) Stability diagram for the catalytic plane in the  $Pe$ versus
 $Sc$ parameter space for wavenumber
 $n=1$. An eigenvalue
 $s >0$ indicates instability. The colour represents the actual value of
 $s$, i.e. the strength of the exponential growth. When
 $Pe>8{\rm \pi}$,
 $s$ is positive and the system is unstable, independently of
 $Sc$. (b) Here
 $s$ as a function of
 $Pe$ at various wavenumber for
 $Sc=1$ by linear stability analysis. The wavenumber of the curve increases from left to right. For wavenumber
 $n$, when
 $Pe<8{\rm \pi} n$,
 $s$ is negative and the system is stable. When
 $Pe>8{\rm \pi} n$,
 $s$ becomes positive and the system becomes unstable towards this mode
 $n$. The function of the maximum growth rate curve (dashed line in panel (b)) is (3.10).

The linearized diffusion–convection equation, (3.4), helps us to understand the physical mechanism of the diffusiophoretic instability. If there is local concentration variation at the surface, the diffusion term  $({1}/{Pe})\nabla ^2c$ smoothens out the local concentration difference, which makes the system stable. In contrast, dominance of the advection term
 $-\boldsymbol {u}\boldsymbol {\cdot }\boldsymbol {\nabla } c$ will increase the concentration difference, such that the system becomes unstable. Thus it can be seen that the competing mass transport by diffusion and advection determines the instability, which is quantified by
 $Pe$. If
 $Pe$ is above a critical value, the advection term results in positive feedback, which amplifies the disturbance and leads to the instability.
4. Simulation of catalytic plane
We now numerically study the diffusio-omostic instability. The objective of the numerical simulation is to understand the effect of the nonlinear terms and random initial perturbation which are ignored in the linear stability analysis.
4.1. Numerical set-ups
The fluid motion and concentration field are solved using direct numerical simulation of the Navier–Stokes equations and diffusion–convection equation in Cartesian coordinates. Equations (2.3)–(2.4a,b) are spatially discretized using the central second-order finite difference scheme. Along both horizontal and vertical directions, homogenous staggered grids are used. The equations are integrated by a fractional-step method with the nonlinear terms computed explicitly by a low-storage third-order Runge–Kutta scheme and the viscous terms computed implicitly by a Crank–Nicolson scheme (Verzicco & Orlandi Reference Verzicco and Orlandi1996; van der Poel et al. Reference van der Poel, Ostilla-Mónico, Donners and Verzicco2015). The simulations are then conducted with the concentration and the velocity boundary conditions written in (2.6)–(2.9a,b). We first examine how the growth rate responds to the domain size. Figure 4(a) shows that when the aspect ratio  $H/L\geqslant 0.8$, the growth rate of the instability becomes insensitive to the aspect ratio. Besides, the mesh refinement test is given in figure 4(b), from which we see the convergence of the growth rate when the number of grid points in one direction has reached roughly
 $300$. Therefore, we chose
 $H/L=1$ and the mesh
 $401 \times 401$ for all our phoretic channel simulations.
(a) Normalized growth rate of the dominant unstable mode  $s/s_0$ for
 $Pe=50$ and
 $628$ with different aspect ratio
 $H/L$, where
 $s_0$ is the growth rate obtained at
 $H/L=2$. It can be seen that when
 $H/L\geqslant 0.8$, the growth rate becomes insensitive to the aspect ratio. (b) Mesh refinement test with growth rate
 $s$ versus the number of grid points in one dimension. For the case of
 $Pe=628$, the percentage change of
 $s$ is less than
 $1\,\%$ when the grid resolution increases from
 $401 \times 401$ to
 $801 \times 801$.

The initial condition is the fluid at rest and a constant concentration gradient along the  $y$-direction (see (3.3)). Then a small sinusoidal perturbation is added to the concentration field to trigger the instability,
 \begin{equation} \delta c= 10^{{-}4} \sin (2{\rm \pi} nx), \end{equation}
where  $n$ is the wavenumber of the perturbation.
4.2. Nonlinear saturation
To quantify the long term growth of the instability, we examine how the kinetic energy  $E_k=({1}/{A})\int _A ({v^2}/{2} )\,\textrm {d}S$ (
 $A$ is the whole domain and
 $v$ is the velocity) changes in time. An example time series of
 $E_k$ is shown in figure 5, which corresponds to the case of
 $Sc=1$ and
 $Pe=125$. The result suggests that after the initial perturbation, there is a transient stage during which the kinetic energy grows exponentially, i.e.
 $E_k \sim \textrm {e}^{2st}$. As a consistency test, our simulation confirms that the involvement of nonlinear terms in the simulation does not change the initial growth rate
 $s$. However, later the growth of
 $E_k$ begins to level off after some time because of nonlinear saturation. Such nonlinear saturation is common in most linearly unstable nonlinear systems, such as Rayleigh–Bénard convection (Greenside & Coughran Reference Greenside and Coughran1984), Taylor–Couette flow for inner cylinder rotation (Grossmann, Lohse & Sun Reference Grossmann, Lohse and Sun2016) or Rayleigh–Taylor instability (Haan Reference Haan1989). The concentration fields at different times show that during the saturated stage, the emitted plumes merge into a larger one, and eventually the flow structure develops into the state with a single large plume.
Next, we compare the exponential growth rate  $s$ of the instability for various wavenumber cases (
 $n=1,2,3$) during the initial stage with exponential growth as shown in figure 6. For the benchmark cases with only the linear terms, the data points (circles) agree excellently with the linear stability analysis (solid curves). This result can be regarded as further validation for our numerical code.
Time evolution of the kinetic energy  $E_k$ for the case
 $Pe=125$ and
 $Sc=1$ with random perturbation from simulations with only linear terms (blue solid curve) and with both linear and nonlinear terms (red solid curve). The kinetic energy
 $E_k$ is in a logarithmic scale. For the case with both linear and nonlinear terms, the growth of
 $E_k$ levels off near time-instant b, compared with that with only linear terms, because of nonlinear saturation. The process is divided into two subprocesses: plume generation; plume growth and merging. During the first subprocess,
 $E_k$ grows exponentially
 $E_k \sim \textrm {e}^{2st}$. The points at the curve represents four states in the process, of which the concentration fields are shown in time-instants a–d, respectively. Plume generating (time instant a): triggered by a perturbation, the kinetic energy increases exponentially. Plume growing and merging (time instants b–d): as
 $E_k$ reaches around 0.02, the kinetic energy reaches a plateau; at the same time the plumes emerge in the concentration field. The plumes grow and merge with each other. In the end, only one major plume remains in the field (time instant d).

Theoretical (solid lines) and numerical results (circles) of growth rate  $s$ for different wavenumber
 $n=1,2,3$ and
 $Sc=1$. The simulations are performed with only linear terms.

We further examine the situation with random initial perturbation solved with the full equations, including nonlinear terms. The above theoretical analysis has shown that for higher  $Pe$, the larger wavenumber mode can be triggered. The concentration fields in figure 7(a) provide more insight into the triggering of higher-order modes for larger
 $Pe$. Different time instants of the concentration fields for different
 $Pe$ are shown in the figure. For
 $Pe=50$, there is a single concentration plume generating initially. However, for larger
 $Pe=125$, multiple plumes are initially emitted. They undergo a merging process to form a single large plume. After formation of the single large plume,
 $E_k$ reaches the asymptotic value shown in the time series in figure 7(b). Interestingly, for even larger
 $Pe=628$,
 $E_k$ has spiky signals within a statistically steady state as shown in figure 7(c). The corresponding concentration fields in figure 7(a) reveal that small plumes are continuously generated from the reacting wall, and the merging of the plumes occurs simultaneously. Such continuous plume emission and merging can also clearly be seen in the supplementary movie available at https://doi.org/10.1017/jfm.2021.370.
(a) The concentration contours for different  $Pe$ numbers:
 $Pe=50$,
 $Pe=125$ and
 $Pe=628$. The simulations are based on random initial perturbation and performed with the full equations, including the nonlinear terms. Four snapshots in time are plotted for each
 $Pe$. First column, beginning state; second and third column, intermediate states; final column, final (statistical) stable state. (b,c) Time evolution of the total kinetic energy of the velocity field for
 $Pe= 125$ (b) and
 $628$ (c). For the case of
 $Pe=125$, the kinetic energy in the final stage converges, while for
 $Pe=628$ it shows spiky and intermittent signals.

Finally, we classify the four regimes based on the three criteria:
(i) growth rate of the instability;
(ii) number of plumes generated initially;
(iii) fluctuation of the kinetic energy (
 $E_k$) after reaching the statistically steady state.

To quantify the number of generated plumes in the initial stage, we perform a Fourier transformation of the concentration field along the reacting wall ( $y=0$) at the instant when the plumes emerge (time-instant b in figure 5). The wavenumber, i.e. the initial number of plumes (circles), is compared with the dominant wavenumber as obtained from linear stability analysis (red dashed line) in figure 8(b). Both are in good agreement. The dominant wavenumber is that of the maximum growth rate
 $s$ at a certain
 $Pe$. Regarding the fluctuation of
 $E_k$, we evaluate the standard deviation of
 $E_k$ after reaching the statistical steady state in figure 8(c).
The simulation result for the catalytic plane with nonlinear terms and random initial perturbation for  $Sc=1$ and different
 $Pe$. (a) Theoretical (dashed curve, which is (3.10)) and numerical result (circle) of
 $s$ as a function of
 $Pe$, which indicates that the system becomes unstable when
 $Pe>8{\rm \pi}$. (b) Theoretical (dashed line, (3.11) without rounding operation) dominant wavenumber and numerical wavenumber
 $n$ calculated by Fourier transform (circle) as a function of
 $Pe$. The result indicates that when
 $Pe>16{\rm \pi}$, multiple plumes are generated. (c) Standard deviation
 $\sigma$ of the kinetic energy for different
 $Pe$, which indicates that when
 $Pe \gtrsim 603$, the kinetic energy eventually fluctuates because small plumes are continuously generated. Thus four regimes are classified, marked with different colours: stable (I, blue); a single wave (II, green); multiple waves which merge with each other (III, orange); multiple waves with small plumes continuously being regenerated (IV, pink).

The four regimes are as follows.
(i) Regime I (
$Pe\leqslant 8{\rm \pi}$): the system is stable.(ii) Regime II (
$8{\rm \pi} < Pe\leqslant 16{\rm \pi}$): the system becomes unstable. Single plumes generate as can be seen in figure 8(b), and thus the dominant wavenumber is $1$.(iii) Regime III (
$16{\rm \pi} < Pe\lesssim 603$): the initial wavenumber $n$ becomes larger than one, and it increases with $Pe$. The trigger of the higher-order mode can be explained by the linear stability curve in figure 6. As $Pe>16{\rm \pi}$, the perturbation of wavenumber ${n>1}$ becomes unstable. For high enough $Pe$, a higher wavenumber mode can grow even faster than the single wavenumber mode. After a while, the individual plumes merge into a single large one, and the system reaches an asymptotic state with constant $E_k$ ($\sigma =0$ shown in figure 8(c)).(iv) Regime IV (
$Pe \gtrsim 603$): the plume emission and merging happen continuously even after reaching statistically steady state, and therefore $E_k$ fluctuates with time ($\sigma >0$).


Figure 8(a,b) indicate that the exponential growth rate and the number of plumes generated initially can be approximately predicted by linear stability analysis. However, at high  $Pe$, there is a small deviation between the theory and our simulation. An explanation is that at high
 $Pe$, various wavenumbers are excited simultaneously, such that the average growth rate becomes lower than the maximum growth rate predicted by linear stability analysis (3.10).
4.3. Dependence on Schmidt number
Based on the same classification criteria, we work out the full phase diagram in the  $(Pe,$
 $Sc)$ parameter space, for
 $0.1\leqslant Sc \leqslant 10$. Figure 9 shows the four different regimes, namely the stable regime (I), the single plume regime (II), the multiple plume regime with a steady final state (III) and the regime with an unstable final state (IV). The transition points between the stable and the unstable regime (
 $Pe=8{\rm \pi}$), and between the single plume and the multiple plume regime (
 $Pe=16{\rm \pi}$), are insensitive to
 $Sc$. This can be understood from the linear stability analysis where the onset
 $s$ for the
 $n$th wavenumber is
 $Pe=8{\rm \pi} n$, independent of
 $Sc$. However, the onset of regime IV occurs at smaller
 $Pe$, provided
 $Sc<1$. When
 $Sc \geqslant 1$, the onset
 $Pe$ of regime IV becomes independent of
 $Sc$.
The phase diagram for the case of the catalytic plane with different  $Sc$ and
 $Pe$: for
 $Pe<8{\rm \pi}$, the system is stable; for
 $8{\rm \pi} < Pe<16{\rm \pi}$, the system becomes unstable and a single plume is generated; finally, for
 $Pe>16{\rm \pi}$, multiple plumes are generated. For the last regime, there are two subregimes: for low
 $Pe$ (orange triangle), multiple plumes eventually merge to a single one and for higher
 $Pe$ (red circle), there is a newly found regime where the smaller plumes are continuously regenerated. The underlay colours are to guide the eyes.

To further understand why the onset of regime IV behaves differently for  $Sc<1$ and
 $Sc\geqslant 1$, we have a close inspection of the event of the plume emission and merging for
 $Sc = 0.1$ and
 $Sc = 1$ shown in figure 10. First, for both cases when
 $Pe$ is large enough, chaotic plume emissions are observed near the catalytic surface. However, the dynamics of the concentration plume are different for large and small
 $Sc$: for
 $Sc = 1$ as shown in figure 10(a), the emitted small plumes gradually merge into the domain-sized plume, and this large plume is relatively stable. Thus, the velocity and concentration fluctuations are limited to near the vicinity of the catalytic surface without penetrating into the bulk region. In contrast, for
 $Sc = 0.1$ as shown in figure 10(b), separate plumes merge and eventually become energetic enough to penetrate into the bulk, causing strong fluctuations in the bulk region.
The concentration contours of plume emission and merging for (a)  $Sc=1$ and (b)
 $Sc=0.1$ with
 $Pe=754$. For
 $Sc=1$, the small plumes merge into the stable major plume, and fluctuations are limited in the near-boundary region, while for
 $Sc=0.1$, the plume merging causes strong fluctuations in the bulk.

To quantify this effect, we compute the fluctuation strength, once the system has reached the statistically steady state. It is characterized by the standard deviation of the horizontally averaged horizontal velocity  $u_{std} (y)$:
 \begin{equation} u_{std}(y)=\langle \sqrt{\langle(u(x,y,t)-\langle u(x,y,t)\rangle _t)^2\rangle _t} \rangle_x, \end{equation}
where  $u(x,y,t)$ is the instantaneous horizontal velocity and
 $\langle \rangle$ represents the average over time or
 $x$-direction, which is denoted by the subscript. The result is plotted in figure 11. From the figure, we find that the fluctuation is maximum at the bottom wall
 $y=0$ since the diffusiophoretic flow at the wall drives the fluid flow. Moreover, for
 $Sc<1$, the strong velocity fluctuations are not limited to the near-wall region, but also penetrate into the bulk. In contrast, for
 $Sc \geqslant 1$, there are only large fluctuations in the near-wall region and
 $u_{std}(y)$ is monotonically decaying with wall distance
 $y$.
The standard deviation  $u_{std} (y)$ as function of the wall distance
 $y$ for different Schmidt numbers with Péclet number
 $Pe=754$. Averaging was done of time and over the
 $x$-direction. All cases belong to regime IV.

We now understand that the chaotic fluctuations observed in regime IV originate from different physical mechanisms for small and large  $Sc$. For small
 $Sc$, as the fluctuations are mainly contributed from the bulk, one expects that the bulk viscous dissipation plays a role, and thus lower onset
 $Pe$ should be obtained for smaller
 $Sc$. However, it does not hold for the situation of large
 $Sc$ since the fluctuations are mainly contributed by the chaotic plume emission close to the catalytic surface. To work out the details of the chaotic plume emission, nonlinear stability is worthy to be conducted in the future.
As already mentioned in the introduction, our results share some similarities with those of the Bénard–Marangoni instability. For both cases, if the Péclet or Marangoni number is above a critical value, the system becomes unstable. Bergeon et al. (Reference Bergeon, Henry, Benhadid and Tuckerman1998) comprehensively studied the Marangoni convection and found that as the Marangoni number increases, the plume will develop into single-roll or multiple-roll structures, which is similar to the single wavenumber or higher-order wavenumber modes observed in regime II and III, respectively.
As a final remark, Michelin et al. (Reference Michelin, Game, Lauga, Keaveny and Papageorgiou2020) have shown the diffusiophoretic instability in a confined phoretic channel, from which they also observe the generation of the plumes. Note that Michelin et al. (Reference Michelin, Game, Lauga, Keaveny and Papageorgiou2020) have also considered the nonlinear terms in the advection–diffusion equation, however, for the momentum equation, they consider the case of Stokes flow, such that the nonlinear terms and effects of Schmidt number have not been considered. The chaotic plume emission observed in regime IV is the unique feature for high Péclet numbers, which, however, has not been focused on in most of the previous studies. Moreover, with an analytical calculation, we obtain the dominant wavenumber and its growth rate for different  $Sc$ and
 $Pe$, which agrees with our simulation.
5. Simulation of the phoretic particle
Given the analysis of the catalytic plane, we now conduct three-dimensional simulations of a spherical phoretic particle to study the effect of plume emission and merging on the particle motion.
5.1. Numerical set-up
The set-up is as follows: a phoretic particle is positioned at the centre of the domain, and then due to diffusiophoresis, the particle will self-propel. The governing equations consist of two parts. The first is the same as that in § 4.1, which is to solve the three-dimensional version of equations (2.3) and (2.4a,b), except for the characteristic length which now is the radius of the particle. The second part involves the governing equation for the dynamics of the phoretic particle. However, one faces the challenge of dealing with a moving immersed boundary condition. To deal with it, we make use of a moving least squares (MLS) based immersed boundary (IB) method, where the particle interface is represented by a triangulated Lagrangian mesh. For details of our MLS-based IB method, we refer to Spandan et al. (Reference Spandan, Meschini, Ostilla-Mónico, Lohse, Querzoli, de Tullio and Verzicco2017). The concentration boundary condition is that the wall normal concentration gradient is a constant  ${\partial c}/{\partial n} =- 1$, which can be achieved by forcing the concentration at the particle surface based on the concentration interpolated at the probe located at a short distance (1 grid size) from the surface of the particle. The velocity boundary condition is
 \begin{equation} u_s=\boldsymbol{\nabla}_s c, \end{equation}
where  $u_s$ is the surface gradient (
 $\boldsymbol {\nabla }_s$) of the concentration.
The domain size is  $L_x \times L_y \times L_z=20R \times 20R \times 40R$, in terms of the particle radius
 $R$. We use uniform grids
 $N_x \times N_y \times N_z =201 \times 201 \times 401$. Mesh refinement tests are done at
 $Pe=15,16$ and
 $20$ with doubled grid numbers in each dimension. Figure 12(a) indicates that the result for the grid
 $401 \times 401 \times 801$ is nearly indistinguishable from that for
 $201 \times 201 \times 401$.
(a) The terminal velocity  $U^\infty$ of phoretic particles as function of
 $Pe$ for
 $Sc=1$. The result from the axisymmetric simulation by Michelin et al. (Reference Michelin, Lauga and Bartolo2013) is shown as blue solid curve. Our results for the full three-dimensional case of different grid size are indicated by red circles (grid
 $201 \times 201 \times 401$) and green squares (grid
 $401 \times 401 \times 801$). The points for
 $Pe>15$ indicate the average terminal velocity and the range of fluctuations is shown by the solid bars. The motion of the phoretic particle is divided into three different regimes: stable; symmetry breaking; and chaotic motion due to plume generation. (b) The normalized terminal velocity of different
 $Sc$ for the case
 $Pe=8$ and
 $12$. The velocity is normalized by the terminal velocity at
 $Sc=40$. The result shows that when
 $Sc>1$, the terminal velocity converges to a constant. (c) The temporal autocorrelation function of the unit direction vector for three different
 $Pe$ for
 $Sc=1$. The temporal autocorrelation indicates whether the particle performs chaotic motion or not.

For the spherical particle, the radius  $R$ is used as the length scale in Péclet number
 \begin{equation} Pe=\frac{M \alpha R}{D^2}. \end{equation}
We will present the result of phoretic particles for different  $Pe$ from 3 to 20 with
 $Sc=1$.
5.2. Result of the phoretic particle
Similar to the case of the catalytic plane, the diffusiophoretic instability breaks the rotational symmetry of the phoretic particle. It has been shown by Michelin et al. (Reference Michelin, Lauga and Bartolo2013) that the phoretic particle breaks the symmetry when  $Pe$ is larger than 4. Therefore, as a validation, we first simulate cases with small
 $Pe$ and compare with the results obtained from Michelin et al. (Reference Michelin, Lauga and Bartolo2013). In figure 12(a), we plot the numerical terminal velocity
 $U^{\infty }$. For
 $Pe>4$, indeed symmetry breaking occurs (e.g. figure 13(a) for
 $Pe=10$) and the particle moves along a straight trajectory. The terminal velocities agree with those obtained from Michelin et al. (Reference Michelin, Lauga and Bartolo2013). Furthermore, in figure 12(b) we check whether the terminal velocity is sensitive to the Schmidt number
 $Sc$. Interestingly, the figure suggests that when
 $Sc\geqslant 1$ for
 $Pe=8$ and
 $12$, the terminal velocity converges to a constant. However, to understand why terminal velocity levels off, further study is needed in the future. Regarding the grid resolution requirement, the necessary grid resolution will increase dramatically for very large
 $Sc$. In order to run as many cases as possible to fully explore the phase diagram, we stick to
 $Sc=1$ for the rest of our simulations.
The concentration cross-section from three-dimensional simulations of an isotropic catalytic particle for  $Pe=10$ and
 $60$; again,
 $Sc=1$. The simulation is at a domain
 $L_x \times L_y \times L_z = 20R\times 20R\times 40R$, in terms of the particle radius
 $R$. The grids are
 $201 \times 201 \times 401$. To better demonstrate the chaotic trajectory, the motion of the particle in panel (b) is projected to
 $x$–
 $z$ plane. (a) Here
 $Pe=10$, the particle moves in a straight way; (b)
 $Pe=60$, plumes are generated at the surface of the particle, which starts to move irregularly.

After this validation we now extend the calculations to higher  $Pe$. Multiple plumes emission and merging occur at the surface of the phoretic particle (e.g. figure 13(b) for
 $Pe=60$), which is similar to that observed for the catalytic plane. The continuously emitted plumes change the direction of the phoretic particle and lead to chaotic motion.
To characterize the motion of the particle, we calculate the mean temporal autocorrelation of the particle direction,

where  is the unit direction vector of the particle velocity at
 $t$. The integral upper limit
 $T$ is chosen large enough to achieve statistical stationary. The autocorrelation for different
 $Pe$ is shown in figure 12(c). When
 $Pe=20$, the autocorrelation becomes considerably less than 1 with increasing
 $\Delta t$, which means that the particle starts to meander in different directions. The chaotic behaviour of the particle has also been shown by the fluctuation of velocity in figure 12(a), which is represented by the solid bars. Interestingly, for
 $Pe \gtrsim 15$, the average velocity (the red circle) still lies near the result by Michelin et al. (Reference Michelin, Lauga and Bartolo2013), but for larger
 $Pe$, the velocity shows larger fluctuation, i.e. more chaotic behavior.
Thus we can classify the motion for a phoretic particle into three regimes:
(i)
$Pe<4$, the particle remains stable;(ii)
$4< Pe\lesssim 15$, symmetry breaking occurs and the particle moves straight;(iii)
$Pe\gtrsim 15$, the particle moves chaotically.


Figure 13(b) shows that the plumes are continuously generated and merge, which alters the concentration distribution and steers the moving direction of the phoretic particle. This shows that our newly found regime IV in figure 9 leads to the chaotic motion for the case of phoretic particles.
5.3. Comparison between the phoretic particle and catalytic plane
We now compare the various regimes for the catalytic plane (§ 4) with those for the phoretic particle (§ 5). The similarity between the two set-ups is that both the instability and chaotic flow can be observed for both set-ups. A major difference between them is that the regimes for the catalytic plane are classified by the distinct plume dynamics whereas the regimes for the phoretic particle are classified by the distinct particle motions. However, both regimes II and III for the catalytic plane lead to a steady final state with a single plume, which for the case of the phoretic particle implies straight motion. For classification of the particle motion, the same fate of particle motion leads one to define only one regime despite the distinct plume dynamics during the initial transient stage.
Another difference between the catalytic plane and phoretic particle is that the onset Péclet numbers are different. However, this difference simply reflects that the characteristic length scales in the definition of  $Pe$ are different for both systems.
We note that also Hu et al. (Reference Hu, Lin, Rafai and Misbah2019) numerically observed the chaotic motion of phoretic particles. However, the plume generation and merging, which could provide a route to understand the chaotic motion of the particle at high enough  $Pe$, were not studied in that paper. Besides, in the experiments of active droplets, it is also observed that the droplet can move in a helical or even chaotic trajectory at high
 $Pe$ (Suga et al. Reference Suga, Suda, Ichikawa and Kimura2018; Maass et al. Reference Maass, Krüger, Herminghaus and Bahr2016). Morozov & Michelin (Reference Morozov and Michelin2019b) also observed the helical and chaotic motion of the catalytic particle. Recently, the stochastic dynamics of active particles was analysed (Gaspard & Kapral Reference Gaspard and Kapral2018; Chamolly & Lauga Reference Chamolly and Lauga2019). Based on the stochastic approach using Langevin equations, the active particle motion is split into a diffusive part and a ballistic part. In our work here, it is the deterministic plume emission that is the source of the diffusive motion, and a one-to-one comparison is difficult due to the quite different natures of the approaches. Very recently, Vajdi Hokmabad et al. (Reference Vajdi Hokmabad, Dey, Jalaal, Mohanty, Almukambetova, Baldwin, Lohse and Maass2021) observed plume generation and merging at the surface of a meandering chemically active droplet. This recent finding reflects the importance of the plume dynamics in determining the droplet motion. Here, for the diffusiophoretic particle, we have also revealed such plume generation and merging phenomena and have related it to the instability of the flow near the surface.
6. Concluding remarks
In summary, we have studied the instability driven by diffusiophoretic effects at the interfaces for two different systems: a catalytic plane and a spherical phoretic particle. The Péclet number ( $Pe$) and Schmidt number (
 $Sc$) are the parameters that determine the states of the system.
For a catalytic plane, via linear stability analysis, we quantitatively studied the growth of various wavenumber perturbations. With the assistance of the simulation, we have classified four regimes for different  $Pe$ and
 $Sc$ based on the exponential growth rate of the instability, number of plumes generated initially and fluctuation of the kinetic energy after reaching the statistically steady state (
 $E_k$). For
 $Pe \leqslant 8{\rm \pi}$, the system is stable. For
 $8{\rm \pi} < Pe \leqslant 16{\rm \pi}$, the system becomes unstable, a single plume is generated and the system reaches a steady state eventually. For
 $Pe>16{\rm \pi}$, multiple plumes are generated initially, which merge into a single one to attain a stable state eventually due to nonlinear saturation. However, for even higher
 $Pe$ (
 $Pe\gtrsim 603$ for
 $Sc=1$), small plumes are continuously generated and merge with each other, the system remains unstable and therefore
 $E_k$ fluctuates in time.
Based on the linear stability analysis, we understand that the onset  $Pe$ between regime I and II, and regime II and III are independent of
 $Sc$. However, there is noticeable effect of
 $Sc$ on the transition to regime IV, which is associated with different flow structures for different
 $Sc$. For small
 $Sc$, the strong fluctuations of concentration and kinetic energy also occur in the bulk region, whereas for large
 $Sc$, the fluctuations are only contributed by the chaotic plume emission close to the catalytic plane. As the viscous dissipation in the bulk plays a role for small
 $Sc$ cases, lower onset Péclet numbers of regime IV are obtained for lower
 $Sc$. However, it does not hold for large
 $Sc$.
Then we extended our research to three-dimensional simulations of the spherical phoretic particle. Despite the geometric difference, an analogous phenomenon happens at the surface of the particle which triggers different particle motions. Similar to the case of the catalytic plane, for the case at  $Sc=1$, when
 $Pe>4$, the particle starts to break the symmetry. For higher
 $Pe\gtrsim 15$, also similar to the observation of the catalytic plane, the small plumes start to be generated continuously at the surface of the particle, which will steer the particle and lead to meandering motion. The analogous phenomenon indicates that the chaotic motion of the phoretic particle results from the instability at the interface driven by diffusiophoretic effects.
The present work makes a contribution to the understanding of the diffusiophoretic instability. First, the study reveals the existence of a highly unstable regime at high  $Pe$. We not only study the onset
 $Pe$ of the unstable mode, but also analytically work out the dominant wavenumber as a function of
 $Pe$. For high enough
 $Pe$ (regime III), multiple plumes are emitted into the surrounding fluid. For even higher
 $Pe$ (regime IV), smaller wavelength perturbations are dominant, which leads to continuous plume generation and subsequently to chaotic flow. Second, our results show that the diffusiophoretic instability at the catalytic surface can eventually lead to chaotic motion of the phoretic particle. Through simulations of the phoretic particle at high
 $Pe$, we not only see its chaotic motion, but also observe the plume emission and merging events near the surface of the particle, which is similar to the situation of regime IV for the case of the catalytic plane. The study of the phoretic plane thus provides a framework to understand the motion of the phoretic particle.
Many questions remain open. For example, how does the particle motion and flow field change for phoretic particles in a complicated environment, such as phoretic particle near a wall? How does the plume generation and merging change the collective behaviour of phoretic particles? How about the effect of plume generation on rod particles rather than spheres? Building on the insight obtained here into the mechanism behind the chaotic motion of phoretic particles, it is worthwhile to further explore the effects of the plume generation on the motion of particles in the more complicated set-ups as mentioned above, in particular, on collective effects.
Supplementary movies
Supplementary movies are available at https://doi.org/10.1017/jfm.2021.370.
Acknowledgements
We greatly appreciate the valuable discussions with M. Jalaal, C.S. Ng, Q. Wang, B.V. Hokmabad, C. Maass and A. Prosperetti.
Funding
We acknowledge the support from the Netherlands Center for Multiscale Catalytic Energy Conversion (MCEC), an NWO Gravitation program funded by the Ministry of Education and support from the ERC-Advanced Grant ‘DDD’ under the project number 740479. We acknowledge that the results of this research have been achieved using the DECI resource Kay based in Ireland at Irish HPC centre with support from the PRACE. We also acknowledge PRACE for awarding us access to MareNostrum at the Barcelona Supercomputing Centre (BSC) under PRACE project number 2017174146 and JUWELS at the Jülich Supercomputing Centre. This work was also partly carried out on the national infrastructure of SURFsara with the support of SURF Cooperative, the collaborative ICT organization for Dutch education and research.
Declaration of interests
The authors report no conflict of interest.
Appendix A. Linear stability analysis for catalytic plane
In this appendix, the linear stability analysis is performed to investigate the stability of the system (2.3)–(2.9a,b).
A.1. Base flow
The base flow can be obtained by assuming a static flow,

Substituting (
A1) into (2.4a,b) we obtain the pressure solution,
 \begin{equation} \bar{p} = 0. \end{equation}
Substituting (
A1) into (2.3), we obtain
 \begin{equation} \frac{\partial \bar{c}}{\partial t} = \frac{1}{Pe} \frac{\partial^2 \bar{c}}{\partial y^2}, \quad \left. \frac{\partial \bar{c}}{\partial y} \right|_{y=0} ={-}1, \quad \left. \bar{c} \right|_{t=0} = 0. \end{equation}
Denote the Laplace transform as (Liu Reference Liu2017)
 \begin{equation} \bar{C} = \mathcal{L}( \bar{c}) = \int_0^\infty \bar{c} \,\textrm{e}^{-\alpha t} \,\textrm{d}t, \quad \bar{c} = \mathcal{L}^{{-}1} ( \bar{C}) = \frac{1}{2{\rm \pi} \textrm{i}}\int_{-\textrm{i} \infty}^{\textrm{i} \infty} \bar{C} \,\textrm{e}^{\alpha t} \,\textrm{d}t. \end{equation}
Note that
 \begin{equation} \mathcal{L} \left( \frac{\partial \bar{c}}{\partial t} \right) = \alpha \bar{C}, \quad \mathcal{L} \left( 1 \right) = \frac{1}{\alpha}. \end{equation}
Then (A3a–c) can be transformed to
 \begin{equation} \frac{\textrm{d}^2 \bar{C}}{{\textrm{d} y}^2} - Pe \alpha \bar{C} =0, \quad \left. \frac{\textrm{d} \bar{C} }{\textrm{d} y} \right|_{y=0} ={-}\frac{1}{\alpha}. \end{equation}
The solution of (A6a,b) that vanishes at infinity is
 \begin{equation} \bar{c} = \frac{1}{\alpha} \cdot \frac{1}{ \sqrt{Pe \alpha} } \,\textrm{e}^{- y \sqrt{Pe \alpha} }. \end{equation}
Recall that (Gradshteyn & Ryzhik Reference Gradshteyn and Ryzhik2007, p. 1110)
 \begin{equation} \mathcal{L}^{{-}1} \left( \frac{1}{ \alpha} \right) = 1, \quad \mathcal{L}^{{-}1} \left( \frac{1}{ \sqrt{Pe \alpha} } \,\textrm{e}^{- y \sqrt{Pe \alpha} } \right) = \frac{1}{\sqrt{{\rm \pi} Pe t}} \,\textrm{e}^{ - {Pe y^2}/{4 t} }, \end{equation}
and use the convolution theorem. Then the concentration solution in physical space can be obtained as (Wu et al. Reference Wu, Ma and Zhou2006, p. 144)
 \begin{equation} \bar{c} = \int_0^t \frac{1}{\sqrt{{\rm \pi} Pe (t-\tau)}} \exp \left[-\frac{Pe y^2}{4 (t-\tau)} \right] \textrm{d}\tau. \end{equation}
The corresponding derivative is
 \begin{equation} \frac{\partial \bar{c} }{\partial y} ={-} \int_{ \xi_0 }^\infty \frac{ 2 }{\sqrt{{\rm \pi} } } \,\textrm{e}^{ - \xi^2 } \,\textrm{d} \xi, \quad \text{with}\ \xi^2 = \frac{Pe y^2 }{ 4 (t-\tau)}, \quad \xi_0^2 = \frac{ Pe y^2 }{ 4 t}. \end{equation}
Considering the limit  $t\rightarrow \infty$, i.e.
 $\xi _0\rightarrow 0$, we obtain
 \begin{equation} \frac{\partial \bar{c}}{\partial y} ={-}1. \end{equation}
A.2. Perturbation flow
Substituting the base flow (A1), (A2) and (A11) into the governing equations (2.3) and (2.4a,b) and keeping only the  $O(\epsilon )$-terms, we get the linearized governing equations (3.4) and (3.5a,b). The boundary conditions are equations (3.6a–c).
The perturbation is assumed as (3.7). Substituting the perturbation term (3.7) into the governing equations (3.4) and (3.5a,b), and rearranging the resultant equations, we obtain
 $$\begin{gather} \left( \partial_y^2 - k^2 \right) \check{p} = 0, \end{gather}$$
 $$\begin{gather}\left( \partial_y^2 - k^2 - \frac{s Pe}{Sc} \right) \check{v} = \partial_y \check{p}, \end{gather}$$
 $$\begin{gather}\left( \partial_y^2 - k^2 - s Pe \right) \check{c} ={-} Pe \check{v}. \end{gather}$$
The boundary conditions are
 \begin{equation} \left. \frac{\textrm{d} \check{c}}{\textrm{d} y} \right|_{y=0} = 0, \quad \left. \frac{\textrm{d} \check{v}}{\textrm{d} y} \right|_{y=0} = k^2 \check{c}, \quad \left. \check{v} \right|_{y=0} = 0. \end{equation}
The pressure solution that decays at infinity is
 \begin{equation} \check{p} = \textrm{e}^{{-}k y}, \quad k = 2 {\rm \pi}n, \quad n\in \textbf{N} . \end{equation}
Substituting (A16) into (A13), and using the third equation in (A15a–c), the vertical velocity is found to be
 \begin{equation} \check{v} = \frac{ k }{s} \left( \textrm{e}^{{-}k y} - \exp\left({-k y \sqrt{1+ \frac{s Pe}{ Sc k ^2}} }\right) \right). \end{equation}
Similarly, by substituting (A17) into (A14), and using the first equation in (A15a–c), the concentration is
 \begin{align} \check{c} &= \frac{k}{s^2} \left( \textrm{e}^{{-}k y} - \frac{ \exp\left({-k y \sqrt{1+ \dfrac{s Pe}{ k^2}} }\right)} {\sqrt{1+ \dfrac{s Pe}{k^2}} } \right) \nonumber\\ & \quad - \dfrac{k}{s^2} \sqrt{1+ \dfrac{s Pe}{ Sc k^2}} \dfrac{Sc }{Sc -1} \left( \dfrac{ \exp\left({-k y \sqrt{1+ \dfrac{s Pe}{ Sc k^2}} } \right)}{ \sqrt{1+ \dfrac{s Pe}{ Sc k^2}} } - \frac{ \exp\left( {-k y \sqrt{1+ \dfrac{s Pe}{ k^2}} }\right) }{ \sqrt{1+ \dfrac{s Pe}{ k^2}} } \right). \end{align}
It seems that (A18) could be invalid for  $Sc=1$ since the denominator
 $Sc-1$ therein is zero. However, this is not the case since the term in the brackets of the second line also reduces to zero. By performing a Taylor series expansion of (A18) at
 $Sc=1$ (l'Hospital's rule), one can easily prove that
 \begin{align} \check{c} = \frac{ k }{s^2} \left( \textrm{e}^{{-}k y} - \frac{ \exp\left({-k y \sqrt{1\!+\! \dfrac{s Pe}{ k^2}} } \right)}{ \sqrt{1\!+\! \dfrac{s Pe}{k^2}} } \right) - \frac{Pe \left( 1\!+\! ky \sqrt{1\!+\!\dfrac{sPe}{k^2}} \right) }{ 2 s k \left( 1+ \dfrac{sPe}{k^2} \right) } \exp\left({-ky\sqrt{1+\frac{sPe}{k^2}}}\right). \end{align}
Finally, substitute (A17) and (A18) into the second equation in (A15a–c), we can obtain the equation (3.8) that determines the exponential growth rate  $s=s(k; Pe, Sc)$.
We now explain briefly how to use (3.8) to get the theoretical results in figure 3. Define
 \begin{equation} \delta^2-1 =\frac{s Pe}{k^2}. \end{equation}
Then
 $$\begin{gather} Pe= Pe(\delta; k, Sc) = k \delta \left( \delta+1 \right) \left( \delta+ \sqrt{1+ \frac{\delta^2-1}{Sc} } \right), \end{gather}$$
 $$\begin{gather}s = s(\delta; k, Sc) = \frac{k (\delta^2-1)}{ \delta \left( \delta+1 \right) \left( \delta+ \sqrt{1+ \dfrac{\delta^2-1}{Sc} } \right) }. \end{gather}$$
Thus, for given  $k$ and
 $Sc$, we obtain the curve
 $s$ versus
 $Pe$ in figure 3(b) by varying
 $\delta$. Similarly, for given
 $k$, we obtain the contour
 $s$ in the
 $(Pe, Sc)$ plane in figure 3(a) by varying
 $\delta$ and
 $Sc$.
A.3. Determination of the dominant wavenumber
The maximum growth rate, as well as the dominant wavenumber, can also be determined from (3.8) or equivalently (A21) and (A22). To show this, we rewrite (A21) and (A22) as
 $$\begin{gather} \kappa = \kappa(\delta; Pe, Sc) = \frac{1} { \delta \left( \delta+1 \right) \left( \delta+ \sqrt{1+ \dfrac{ \delta^2-1}{Sc} } \right) }, \end{gather}$$
 $$\begin{gather}\sigma = \sigma(\delta; Pe, Sc) = \frac{\delta^2-1} { \left[ \delta \left( \delta+1 \right) \left( \delta+ \sqrt{1+ \dfrac{\delta^2-1}{Sc} } \right) \right]^2}, \end{gather}$$
where
 \begin{equation} \kappa = \frac{k}{Pe}, \quad \sigma = \frac{s}{Pe}. \end{equation}
For certain Pe and Sc, the maximum growth rate is obtained by  $\partial _k s=0$, which is equivalent to
 \begin{equation} \frac{\textrm{d}\sigma}{\textrm{d}\kappa} = \frac{\textrm{d}\sigma}{\textrm{d}\delta} \left( \frac{\textrm{d}\kappa}{\textrm{d}\delta} \right)^{{-}1} = 0, \quad \text{implying} \ \frac{\textrm{d}\sigma}{\textrm{d}\delta}=0. \end{equation}
By solving (A26) and denoting the solution as  $\delta _e$, the maximum growth rate and the corresponding dominant wavenumber are always given by
 \begin{equation} q s = \sigma_e Pe, \quad k = \kappa_e Pe, \end{equation}
where  $\sigma _e=\sigma (\delta _e)$ and
 $\kappa _e=\kappa (\delta _e)$ can be obtained by substituting
 $\delta _e$ into (A24) and (A23), respectively. Note that in general equation (A26) needs to be solved numerically. However, for some specific
 $Sc$, it can also be solved analytically. Two examples are as follows.
Example A.1. When  $Sc=1$, (A23), (A24) and (A26) reduce to
 \begin{equation} \kappa = \frac{1} { 2 \delta^2 \left( \delta+1 \right)}, \quad \sigma = \frac{\delta -1} { 4 \delta^4 \left( \delta+1 \right)}, \quad \frac{\textrm{d} \sigma}{\textrm{d} \delta} = \frac{2+\delta-2 \delta ^2 }{2 \delta ^5 (\delta +1)^2} = 0. \end{equation}
The corresponding solution is
 \begin{equation} \delta_e = \frac{1 + \sqrt{17} }{4}, \quad \kappa_e = \frac{ 31 - 7 \sqrt{17} }{16}, \quad \sigma_e = \frac{85 \sqrt{17} - 349}{128}. \end{equation}
Example A.2. When  $Sc=\infty$, (A23), (A24) and (A26) reduce to
 \begin{equation} \kappa = \frac{1} { \delta \left( \delta+1 \right)^2}, \quad \sigma = \frac{\delta -1} { \delta^2 \left( \delta+1 \right)^3}, \quad \frac{\textrm{d} \sigma}{\textrm{d} \delta} = \frac{2 + 4 \delta-4 \delta^2 }{\delta ^3 (\delta +1)^4} = 0. \end{equation}
The corresponding solution is
 \begin{equation} \delta_e = \frac{1 + \sqrt{3} }{2}, \quad \kappa_e = 2 \sqrt{3} - \frac{10}{3}, \quad \sigma_e = \frac{4}{9} \left( 26 \sqrt{3} - 45 \right). \end{equation}


 Open access

