INTRODUCTION
The unique rheological properties of doughs made from wheat flour, and hence the characteristics of many wheat-based products, are strongly influenced by the amount and type of storage proteins in wheat endosperms (Shewry & Halford Reference Shewry and Halford2002). The concentration of protein, often expressed crudely as a multiple of nitrogen (N) is, therefore, an important criterion of quality when marketing and utilizing wheat (Blackman & Payne Reference Blackman, Payne and Lupton1987).
Sulphur (S) is also a constituent of protein which has important influences on the visco-elasticity of doughs because: (1) S-containing amino acids provide the inter-chain disulphide bonds that help maintain the polymer network of storage proteins (Shewry & Tatham Reference Shewry and Tatham1997), (2) S availability influences the relative proportions of different storage proteins that are synthesized (Zhao et al. Reference Zhao, Hawkesford and McGrath1999) and (3) glutathione, a S-containing tripeptide, can modify rheology (Chen & Schofield Reference Chen and Schofield1996). Consequently, pan bread quality can be more closely associated with S concentration than with N concentration (Zhao et al. Reference Zhao, Withers, Evans, Monaghan, Salmon, Shewry and McGrath1997).
Achieving sufficient grain protein concentration is a particular challenge in systems where the application of soluble nitrogen fertilizers is reduced or curtailed (Gooding et al. Reference Gooding, Davies, Thompson and Smith1993). For example, low protein concentration in grain often limits the suitability of wheat grown organically for pan bread production (Woese et al. Reference Woese, Lange, Boess and Bögl1997; Gooding et al. Reference Gooding, Cannon, Thompson and Davies1999). This deficiency is indicative of systems that are significantly limited by N availability, particularly during grain filling (Gooding et al. Reference Gooding, Davies, Thompson and Smith1993; Berry et al. Reference Berry, Sylvester-Bradley, Philipps, Hatch, Cuttle, Rayns and Gosling2002; David et al. Reference David, Jeuffroy, Laurent, Mangin and Meynard2005). In addition to N supply, S availability is of increasing concern as industrial emissions are decreased and deposition on agricultural soils thereby reduced (Zhao et al. Reference Zhao, Hawkesford and McGrath1999). Eriksen et al. (Reference Eriksen, Olesen and Askegaard2002) and Guzys & Aksomaitiene (Reference Guzys and Aksomaitiene2005) report considerable negative balances for S, even in organic systems, and anticipate that low S availability could restrict yield and quality in organic production.
The present paper studies the effects of row intercropping, i.e. growing alternate rows of wheat and pulse, on the grain N and S concentrations of the wheat. Intercropping is particularly relevant to organic and other low-input systems of production because advantages over sole crops for resource use efficiency (Ghaley et al. Reference Ghaley, Hauggard-Nielsen, Hogh-Jensen and Jensen2005) and crop protection (Szumigalski & Van Acker Reference Szumigalski and Van Acker2005) are more valued, and realized, when soluble fertilizers and synthetic agrochemicals are excluded. Intercropping cereals with pulses can increase the concentration of nitrogen in the cereal grain (Bulson et al. Reference Bulson, Snaydon and Stopes1997; Knudsen et al. Reference Knudsen, Hauggaard-Nielsen, Jornsgard and Jensen2004; Ghaley et al. Reference Ghaley, Hauggard-Nielsen, Hogh-Jensen and Jensen2005), but the present authors are unaware of any previous work studying the effects of intercropping wheat with pulses on grain sulphur concentration. The present paper describes results from replicated and repeated field experiments at five European sites involving different treatment designs for either wheat:faba bean or wheat:pea intercrops. In addition to N and S analyses, sodium dodecyl sulphate (SDS)-sedimentation volume tests are performed as a small-scale assessment of baking potential that is reliant on disulphide bonds (Axford et al. Reference Axford, McDermott and Redman1979; Adeyemi & Muller Reference Adeyemi and Muller1983).
MATERIALS AND METHODS
Experimental designs
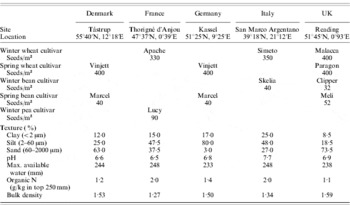
Field experiments were conducted in the 2002/03, 2003/04 and 2004/05 growing seasons at five sites (Table 1; Fig. 1) in Western Europe involving autumn-sown faba bean:wheat (UK and Italy), spring-sown faba bean:wheat (Denmark, UK and Germany) and autumn-sown pea:wheat (France) intercrops in comparison with sole crops. All sites were managed according to organic regulations (Anon. 1991, and as amended thereafter). The experiments followed a cereal, which in turn had usually followed a ley, rich in forage legumes. The faba bean:wheat experiments included additive designs where the full sole-wheat (W) seed rate (Table 1) was added to the full sole-bean (B) seed rate (W100:B100). Additionally, a W50:B50 treatment was compared with W50 and B50 sole crops in Denmark and Germany. Replacement designs were assessed in the UK (W100, W75:B25, W50:B50, W25:B75 and B100) and the pea:wheat experiment in France included both additive and replacement components (W100, W50:P50, W30:P70, W50:P100 and P100). In all experiments intercropping treatment plots (nominally 2×10 m) were replicated in four randomized blocks.
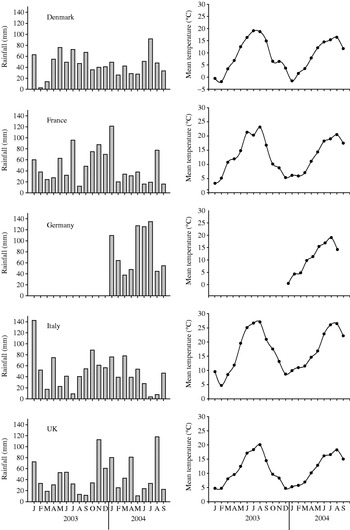
Monthly rainfall and mean temperatures (average of daily maximum and minimum for each month) for the five sites (see Table 1 for further details) in 2003 and 2004.

Site details, cultivars and maximum seed rates used in sole crops

Assessments
After combine or hand harvesting, cereal and pulse grains were separated following various sieving and manual processes. Plot yields were calculated and a subsample dried at 80°C for 48 h for moisture content adjustment. Partial land equivalent ratios for yield (pLER) were calculated:

where Y ic and Y sc are the treatment means for grain yield in intercrop and sole crop, respectively, within any year×site combination.
Dried grain was milled using a Laboratory Mill 3100 (Perten Instruments AB, Huddinge, Sweden). Nitrogen and sulphur concentrations of the dried wholemeal flour were determined after oxidative combustion (Kowalenko Reference Kowalenko2004; AOAC International Reference Howtiz and Latimer2005) using a LECO FP-528 and a LECO SC-144DR (LECO Instruments (UK) Ltd, Cheshire, UK), respectively. SDS-sedimentation volume was measured on wholemeal flour (British Standards Institution 1990).
Statistical analyses
The preliminary statistical approach involved appropriate analyses of variance (ANOVA) on data from individual sites and seasons. For the replacement series in the UK, polynomial regressions were fitted across seed rate levels of the wheat using orthogonal polynomial contrasts in the ANOVA. Where errors appeared to be uniform across seasons and/or locations, larger treatment×site analyses were conducted, using year as an additional blocking structure, in ANOVA. In cases where errors were not uniform, the significance of the site or season×treatment interaction was tested against the Wald statistic following analysis of residual maximum likelihood (REML directive in Genstat 6). In such circumstances, the intercrop treatment means from each site and season were regressed against the mono crop treatment means, weighted for the inverse of the variance for each intercrop mean. A t test was used to assess the significance of the regression coefficient compared with unity, i.e. the null hypothesis is that intercrop=sole crop. Regression analysis was also employed in an attempt to explain effects of intercropping on nitrogen and sulphur concentration in terms of effects on pLER of wheat and pulse.
RESULTS
Wheat intercropped with faba bean in additive designs
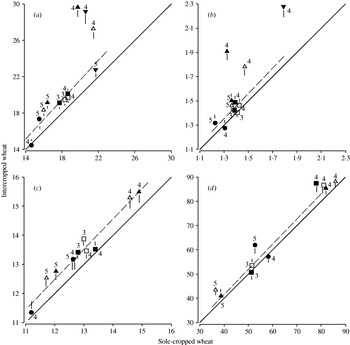
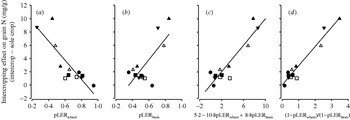
Nitrogen concentration in wheat grain was increased by intercropping with faba bean (Fig. 2a). The effect of intercropping was statistically significant (P<0·05) at all sites and seasons, except in the UK in 2004 and Italy in 2005. The increase in N concentration was particularly marked in Germany and Italy in 2004, contributing to a significant (P<0·05) cropping system×site interaction. The weighted regression analysis suggested that intercropping increased wheat N concentration by 8% compared with sole-cropped wheat (t for regression coefficient compared with 1=4·5; P<0·01). There was little effect of seed rate on the response of wheat N concentration to additive intercropping, i.e. the effect of W50:B50 compared with W50 was similar to the effect of W100:B100 compared with W100. Intercropping increased grain N concentration most when intercropping had a large deleterious effect on wheat yield (Fig. 3a), i.e. there was a negative relationship between pLER for wheat and the effect of intercropping on N concentration. The regression line implies that to increase crude protein concentration (N×5·7) by 10 g/kg, grain yield of the intercropped wheat would need to be reduced by 28% compared with the sole-cropped wheat. The opposite was true with regard to the association with effects on pLER for bean yield, i.e. intercropping increased wheat N concentration most when it had the least deleterious effect on pLER for bean (Fig. 3b). Adding a response to bean yield to that of wheat yield to explain the intercropping effects on N concentration was justified significantly in a multiple regression (Fig. 3c; P=0·024 for the change). Alternatively, the ratio of intercropping effects on wheat yield to effects on bean yield, i.e. (1−pLERwheat)/(1−pLERbean), explained 94·3% of variation (constant omitted) in the intercropping effects on grain N concentration of the wheat (Fig. 3d).
The effect of additive intercropping wheat with faba bean on the wheat grain: (a) nitrogen concentration (mg/g DM); (b) sulphur concentration (mg/g DM); (c) N:S ratio; and (d) SDS-sedimentation volume (ml). Points are treatment means from Denmark (■), UK (●), Germany (▲) and Italy (▾). Solid symbols denote highest seed rate additions; open symbols denote 50% of highest seed rate additions (see Table 1). Numerals are harvest years post 2000. Vertical bars are standard errors. Solid line represents intercropping=sole-cropping; dashed line=regression line weighted for inverse of variance. Regression coefficients: (a) 1·082, s.e.=0·0181; (b) 1·041, s.e.=0·0216; (c) 1·040, s.e.=0·0069; (d) 1·039, s.e.=0·0184.

Relationships between additive intercropping effects on grain nitrogen concentration and intercropping effects on (a) wheat yield, (b) bean yield, (c) a combination of effects on wheat and bean yield, and (d) the ratio of effects on wheat yield to effects on bean yield. pLERwheat=pLER for wheat=wheat yield in intercrop/wheat yield in sole crop. Points are treatment means from Denmark (■), UK (●), Germany (▲) and Italy (▾). Solid symbols denote highest seed rate additions; open symbols denote 50% of highest seed rate additions (see Table 1). Regression coefficients, standard errors and r adj.2: (a) −14·5, 2·87 and 0·69; (b) 15·7, 4·45 and 0·51; (c) 1, 0·135 and 0·83; (d) 2·93, 0·149 and 0·94.

Sulphur concentration in wheat grain was increased by intercropping with faba bean (Fig. 2b). The effect on S was smaller than the effect on N concentration and was not statistically significant (P>0·05) for the lower seed rate in Denmark, or in the UK for 2004. The weighted regression suggests that intercropping increased S concentration by only 4% (t=1·9; P<0·1), although, as with N, data were more variable at high concentrations. There was a strong association between intercropping effects on S and N concentrations in wheat (r=0·995). However, the regression coefficient was shallow (b=0·061, s.e.=0·0021) suggesting N and S were increased at a ratio of over 16:1. As with N, S concentration was: negatively related to pLERwheat (b=−0·90, s.e.=0·190); positively related to pLERbean (b=0·94, s.e.=0·295); better described by a combination of effects on wheat and bean yield (effect on S concentration=0·31−0·688pLERwheat +0·520pLERbean; P=0·039 for the change); and closely associated with 1−pLERwheat/1−pLERbean (r adj.2=91·7%, constant omitted).
The relative benefit of intercropping for N compared with S concentration was reflected in increased N:S ratios (Fig. 2c). The effect was significant in Denmark, in the UK in 2003, and in Germany in 2005. The effect, and variability within experiments, was more consistent over sites and seasons than effects on N and S concentrations. The weighted regression suggested that N:S ratio was increased by 4% by intercropping (t=5·8; P<0·001), which is consistent with the difference in regression coefficients for N (Fig. 2a) and S (Fig. 2b).
The SDS-sedimentation volume tended to be increased by intercropping, significantly so (P<0·05) in Denmark in 2004, and in Germany and the UK in 2005 (Fig. 2d). The weighted regression indicates a 4% increase in sediment volume by intercropping (t=2·1; P<0·1).
Wheat intercropped with faba bean in replacement designs in the UK
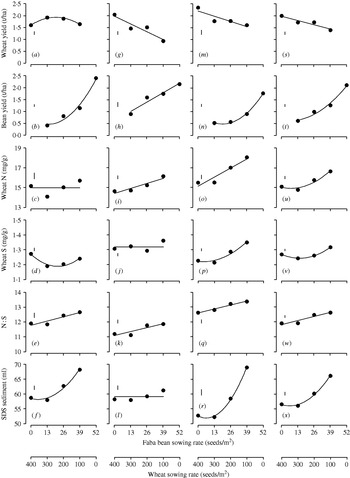
In the spring-sown experiments (Fig. 4), on average over the three years, increasing the seed rate of the bean at the expense of the wheat was associated with a decrease in wheat yield (Fig. 4s), an increase in bean yield (Fig. 4t), and an increase in wheat grain N concentration (Fig. 4u). From the curves fitted in Fig. 4s and u it can be calculated that an increase in crude protein concentration of 10 g/kg was associated with a reduction in wheat yield of 28%. In 2003, when intercropping had no deleterious effect on wheat yield (Fig. 4a), there was no benefit of intercropping for N concentration (Fig. 4c). As with the additive designs, replacement intercropping tended to increase grain S concentration (Fig. 4v), but less reliably and by a smaller proportion compared with effects on N concentration. Within years, intercropping only significantly (P<0·05) increased S concentration of wheat grain in 2005 (Fig. 4p), the year when N concentration had been increased the most (Fig. 4o). The proportionate disparity between intercropping effects on N and S concentration resulted in consistent increases in N:S ratio (Fig. 4e, k, q). Over all years SDS-sedimentation volume of wheat was particularly responsive to intercropping (Fig. 4x). The effect appeared partly reliant on S concentration for, in 2004, neither SDS-sediment volume (Fig. 4l) nor S concentration (Fig. 4j) was significantly increased by intercropping, despite increases in N concentration (Fig. 4i).
The effect of partial replacement of spring wheat with faba bean in the UK on grain yields, and the N, S and SDS-sedimentation volume of the wheat grain in 2003 (a–f), 2004 (g–l) and 2005 (m–r) and the mean of all three years (s–x). Vertical bars are standard errors of the means, 9 d.f. for (a–r) and 33 d.f. for (s–x). Fitted models are either linear or quadratic.

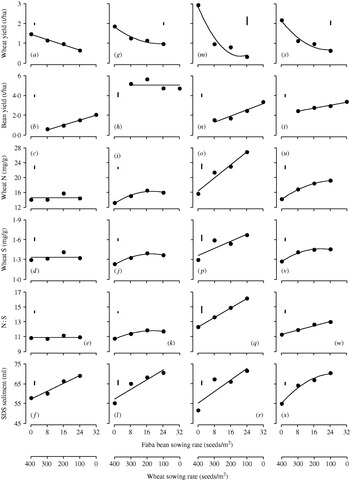
In the autumn-sown experiments (Fig. 5), as in the spring-sown experiments, wheat yields decreased (Fig. 5s), and bean yields increased (Fig. 5t) as the rate of bean inclusion increased at the expense of wheat. In the autumn-sown experiments, however, the deleterious effect on wheat yield (Fig. 5s) was greater than in the spring-sown experiments (Fig. 4s), while the effect of intercropping on the yield of autumn-sown beans was less severe. Indeed, in 2004 (Fig. 5h), there was no effect of intercropping on bean yield. As in previous experiments, intercropping increased wheat N concentration. It can be calculated from Fig. 5s and u that an increase in crude protein concentration of 10 g/kg was associated with a 27% reduction in wheat yield. Comparison of Fig. 5g–i with Fig. 5m–o suggests that the response of wheat N concentration relies more on the effects of intercropping on wheat yield, than on bean yield. Sulphur concentration of the wheat grain was increased by intercropping (Fig. 5v), but again to a lesser extent than increases in N concentration, such that N:S ratio was increased by intercropping (Fig. 5w). SDS-sediment volume was increased by intercropping, even in 2004 (Fig. 5f) when there was no effect on either N (Fig. 5c) or S concentration (Fig. 5d).
The effect of partial replacement of winter wheat with faba bean in the UK on grain yields, and the N, S and SDS-sedimentation volume of the wheat grain in 2003 (a–f), 2004 (g–l) and 2005 (m–r) and the mean of all three years (s–x). Vertical bars are standard errors of the means, 9 d.f. for (a–r) and 33 d.f. for (s–x). Fitted models are either linear or quadratic.

Wheat intercropped with pea
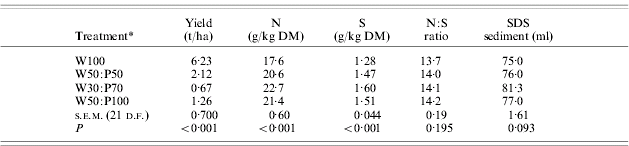
In France, intercropping winter wheat with winter peas resulted in a very large reduction in wheat yield (Table 2) but as with wheat:bean intercropping this was associated with increased concentration of N and S in the wheat grain, and increased SDS-sediment volume.
The effect of intercropping winter wheat with winter pea on wheat grain yield and quality. Values are mean data from France over two harvests (2004 and 2005)
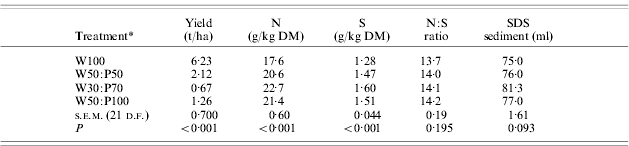
* Numeral denotes percentage of monocropped seed rates (see Table 1).
DISCUSSION
The low average grain nitrogen contents of the sole-cropped wheat in the UK, Denmark, and in Germany in just 2005 suggest that nitrogen availability was seriously limiting productivity in these experiments (Berry et al. Reference Berry, Sylvester-Bradley, Philipps, Hatch, Cuttle, Rayns and Gosling2002), as is often the case in organic farming systems in North Western Europe (Gooding et al. Reference Gooding, Cannon, Thompson and Davies1999; Berry et al. Reference Berry, Sylvester-Bradley, Philipps, Hatch, Cuttle, Rayns and Gosling2002). In particular, the sites in Denmark and the UK were notable for having the lowest soil organic N contents, as well as the sandiest, most leaching-prone soils (Table 1) which may have depleted nitrogen supply to the crop. The nitrogen concentrations of between 14 and 19 g/kg DM, equivalent to 80–100 g/kg DM of crude protein, would have greatly limited the breadmaking potential of the wheat. In contrast, the concentrations of protein in wheat grain from Italy and from Germany in 2004 suggest that nitrogen was not greatly limiting productivity at these sites. In the case of southern Italy, high protein concentrations can be assumed to be at least partly due to the higher summer temperatures (Fig. 1; Gooding et al. Reference Gooding, Ellis, Shewry and Schofield2003).
The current results are consistent with previous studies showing that intercropping cereals and grain legumes can increase the nitrogen (or crude protein) concentrations of the cereal (Bulson et al. Reference Bulson, Snaydon and Stopes1997; Knudsen et al. Reference Knudsen, Hauggaard-Nielsen, Jornsgard and Jensen2004; Ghaley et al. Reference Ghaley, Hauggard-Nielsen, Hogh-Jensen and Jensen2005). The average weighted increase in grain nitrogen concentration of wheat additively intercropped with faba bean of about 8% is broadly consistent with previous studies (Bulson et al. Reference Bulson, Snaydon and Stopes1997), although the present results also find that much larger increases (e.g. both Italy and Germany in 2004) are possible. It is demonstrated that increases in grain N concentration in the wheat are more closely associated with effects on wheat yield, compared with effects on bean yield. However, despite effects on wheat and bean yield being correlated, the multiple regression analysis from the additive experiments does suggest that beans do have additional effects on wheat grain N concentration, other than purely because their presence reduces the yield of wheat. The present results show that over diverse sites, seasons, and different intercropping designs, an increase in wheat crude protein concentration of 10 g/kg with faba bean intercrops is accomplished at the expense of 25–30% of the wheat yield, compared with sole-cropped wheat. The improvement in quality is, therefore, unlikely to be economic if only the wheat crop is considered. Even if a price premium for breadmaking wheat of 25% over livestock feed wheat is available (Lampkin et al. Reference Lampkin, Measures and Padel2004), it is unlikely that the increase in crude protein concentration will always cause a change to the grading of the wheat. However, it is comparatively easy to separate faba bean and wheat grain after harvest (Bulson et al. Reference Bulson, Snaydon and Stopes1997), and the additional utilization of the beans would contribute to the economic performance of the intercrop. In nearly all cases, the total land equivalent ratio for grain dry matter (pLERwheat+pLERbean) was significantly greater than unity (Pristeri et al. Reference Pristeri, Dahlmann, von Fragstein, Gooding, Hauggaard-Nielsen, Kasyanova, Monti, Andreasen, Elsgaard, Sørensen and Hansen2006), suggesting economic potential of the system even disregarding quality benefits for the wheat. Intercropping was not deleterious for other point of sale measures of breadmaking potential such as Hagberg falling number and had inconsistent effects on specific weight (data not presented).
The increase in grain nitrogen concentration in the cereal is possibly the result of the legume not competing strongly for nitrogen below ground, yet still competing for light, and thus limiting cereal biomass production above ground (Hauggaard-Nielson et al. Reference Hauggaard-Nielsen, Andersen, Jornsgaard and Jensen2006). It should, however, be noted that total nitrogen yield in each component crop is reduced by intercropping, although partial complementarity can effect an increase in land equivalent ratio for N (Hauggaard-Nielson et al. Reference Hauggaard-Nielsen, Andersen, Jornsgaard and Jensen2006). Whatever the precise mechanism(s) for the increase in nitrogen concentration in the cereal, it could not cause an equivalent increase in sulphur concentration, as evidenced by increased N:S ratio. Given the above argument, the implication is that pulses compete more effectively with cereals for sulphur than they do for soil nitrogen; a not unreasonable suggestion given that pulses have no special abilities in ‘sulphur fixation’ compared with the cereal. That intercropping increased sulphur concentration at all possibly reflects the close linkages between nitrogen and sulphur uptake (Zhao et al. Reference Zhao, Hawkesford and McGrath1999). Nitrogen and sulphur do, however, differ significantly in their remobilization characteristics (Zhao et al. Reference Zhao, Hawkesford and McGrath1999). Nitrogen in the vegetation is more efficiently redistributed to the grain compared with sulphur. The grain is, therefore, proportionately more dependent on crop uptake (rather than redistribution) of sulphur during grain filling, compared with that of nitrogen. The present authors speculate, therefore, that the relatively consistent effects of intercropping on N:S ratio are due to low soil availability of S during grain filling. However, further work is required to clarify the effects of competition between wheat and beans for sulphur and how this impacts upon late-season uptake and partitioning in the wheat.
The SDS-sedimentation volume contains high molecular weight proteins, particularly the glutenins that impart viscosity and elasticity to dough, expanded in a layer consisting mainly of swollen gluten and occluded starch (Peña et al. Reference Peña, Trethowen, Pfieffer and van Ginkel2002). The volume of the sediment in the hydrated state, however, also depends on disulphide bonds (Adeyemi & Muller Reference Adeyemi and Muller1983). The increased N:S ratio did not prevent SDS-sedimentation volume increasing with intercropping. This is not surprising, given that N:S did not exceed 17:1, the ratio often used to define sulphur deficiency in the grain. That SDS-sediment volume can be increased by intercropping, even with little or no effect on grain N concentration, warrants further study, as do any implications for end-use quality.
In conclusion, it has been shown that intercropping cereals with grain legumes can increase the nitrogen concentration and SDS-sedimentation volume of wheat grain throughout Western Europe. Sulphur concentration can also be increased, but not to the same extent, nor as reliably as the intercropping effect on grain nitrogen concentration so N:S ratio is also increased.
This work was funded by a EU shared cost project under the 5th Framework Programme of RTD, Key Action 5 – Sustainable Agriculture. We are grateful to Ms R. E. Owen and Dr F. Viloria for technical assistance with the nitrogen and sulphur analyses.