


Introduction
Recently, Broockman and Skovron (Reference Broockman and Skovron2018) documented a large and consistent conservative bias among US politicians in their perceptions of public opinion. Elected representatives overestimate the share of citizens holding conservative views. Their findings mark an important contribution to the longstanding research agenda on politicians’ perceptual accuracy and its impact on the quality of democratic representation (Converse and Pierce Reference Converse and Pierce1986; Hedlund and Friesema Reference Hedlund and Friesema1972; Miller and Stokes Reference Miller and Stokes1963; Uslaner and Weber Reference Uslaner and Weber1979; Walgrave et al. Reference Walgrave, Jansen, Sevenans, Soontjens, Pilet and Varone2023).
Yet, we do not know whether the conservative bias is unique to the American context. We address it by studying four countries—Belgium, Canada, Germany, and Switzerland—that substantially differ from the US. We combine a survey of 866 politicians with representative surveys of the general population, and uncover a strong and persistent conservative bias among a large majority of politicians in the four countries and across a variety of issues. The only issue domain on which the conservative bias is not consistently found is immigration, where we observe a mix of conservative (Belgium, Switzerland) and liberal (Canada, Germany) misperceptions.
EXISTING WORK
Broockman and Skovron (Reference Broockman and Skovron2013; Reference Broockman and Skovron2018) show that American politicians hold a persistent conservative bias in their perception of public opinion on a host of economic and social-cultural policy issues (see also Hertel-Fernandez , Mildenberger, and Stokes Reference Hertel-Fernandez, Mildenberger and Stokes2019, for similar findings with staffers). The authors suggest that the found conservative bias might be due to a skewed “information environment” whereby some segments of the public (i.e., conservative citizens) are more actively conveying their preferences to politicians.
That US politicians consistently get the “public mood” wrong (Stimson [1991] Reference Stimson2018) has direct implications for democratic representation. Politicians’ perceptions of public opinion impact their ability to perform their roles (Butler and Nickerson Reference Butler and Nickerson2011; Lax and Phillips Reference Lax and Phillips2012; Mansbridge Reference Mansbridge2003; Stimson, Mackuen, and Erikson Reference Stimson, Mackuen and Erikson1995), their in-office behavior, and their policy responsiveness (Converse and Pierce Reference Converse and Pierce1986; Esaiasson and Wlezien Reference Esaiasson and Wlezien2017; Miller and Stokes Reference Miller and Stokes1963).
It is therefore crucial to examine whether it exists also in other countries. Outside the US, politicians might not be exposed to a skewed information environment in which conservative views have gained prominence via partisan media like Fox News (Clinton and Enamorado Reference Clinton and Enamorado2014), or with highly-mobilized conservative movements (Blee and Creasap Reference Blee and Creasap2010; Fang Reference Fang2013). Yet, there are other factors—like the success of radical right parties (Rooduijn Reference Rooduijn2015) or the erosion of social-democratic parties (Abou-Chadi and Wagner Reference Abou-Chadi and Wagner2020)—that could also be predictive of politicians’ perception of public opinion moving to the right.
DATA
Our study tests the presence of a bias in politicians’ perceptions of public opinion. It is based on data from the POLPOP survey of MPs (see the Appendix for more details) in Belgium (where we distinguish between the separate party systems of Flanders and Wallonia), Canada, Germany, and Switzerland.Footnote 1 All four countries differ significantly from the US, and also from each other. They have fragmented party systems, with six parties in the Canadian and German Parliaments, 12 in Switzerland and 13 in Belgium. The electoral systems vary as well: single-member-district in Canada, a mixed-member system in Germany, list PR in Belgium, and panachage list PR in Switzerland. Belgium and Switzerland are emblematic examples of “consensus democracies,” whereas Canada is a typical, majoritarian Westminster system (Lijphart Reference Lijphart1999). Party system evolutions have also been very different. When our survey was fielded, Germany had been dominated by the conservative CDU-CSU (Christian Democratic Union) for 13 years. In Switzerland and Flanders, there had been a gradual rise of radical-right parties (i.e., Swiss People Party and Vlaams Belang). By contrast, in 2015, Canada experienced a shift from a Conservative to a Liberal Party majority, while Wallonia remained dominated for decades by the Socialist Party. Finally, the ideological orientations of the national governments in these countries at the time of the survey also vary, with grand coalitions in Germany and Switzerland, a liberal cabinet in Canada, and a right-wing coalition in Belgium.
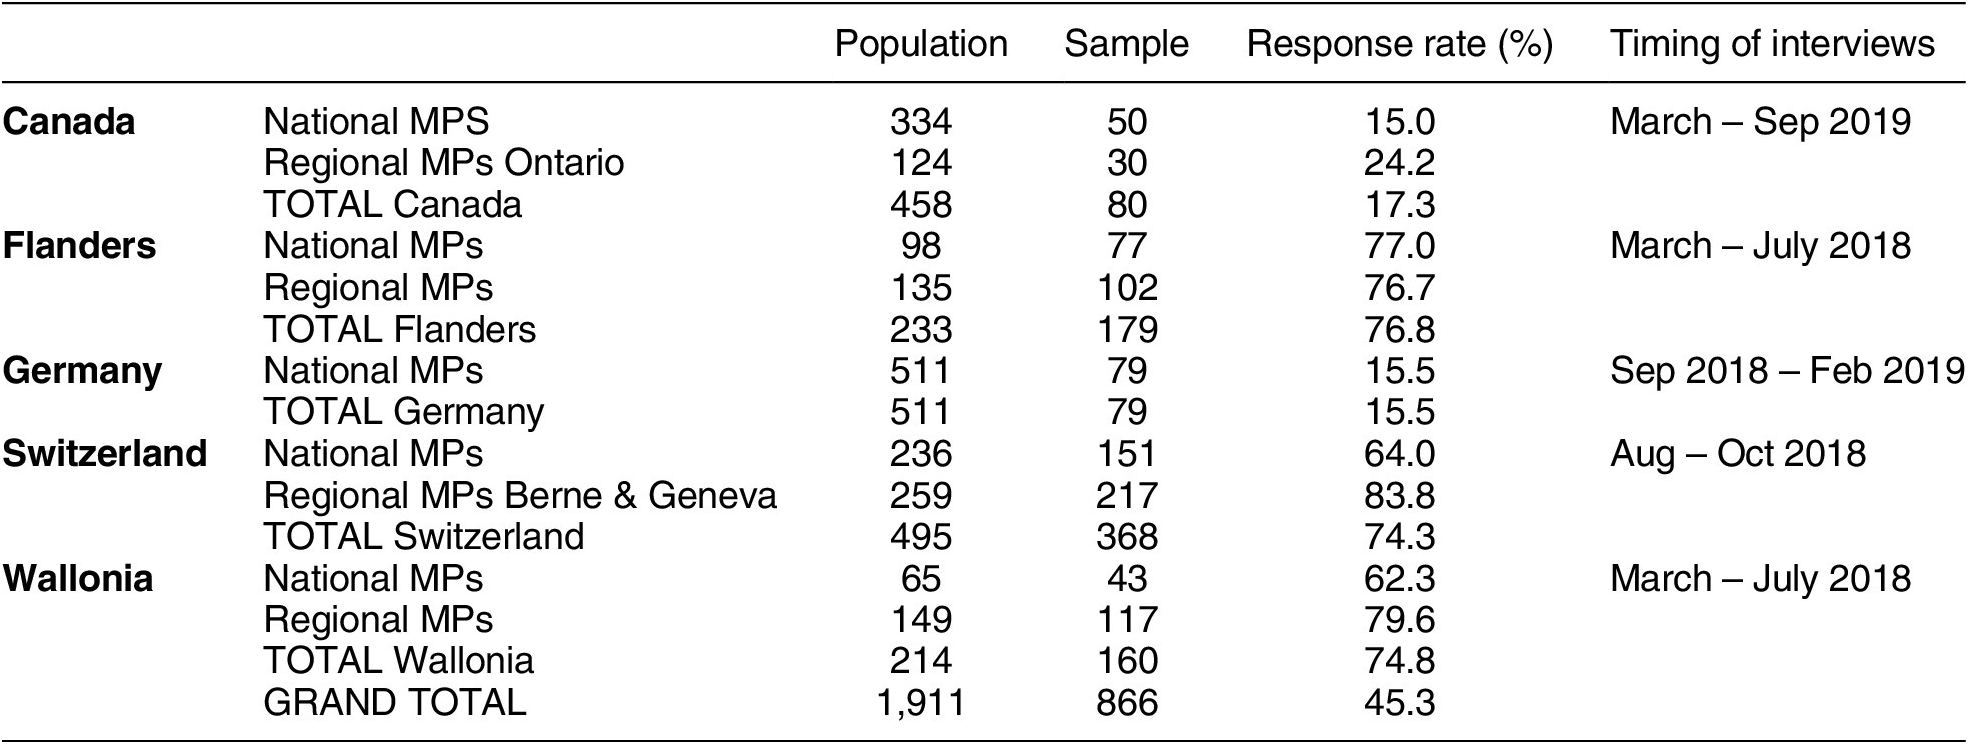
In total, within the POLPOP survey, we conducted 866 face-to-face interviews with members of national and regional parliaments in the four countries (see Table 1).
Population of Targeted Politicians, Sample, and Response Rate (Full POLPOP Survey)

Note: see Tables A1.1, A1.2 and A1.3 in Supplementary material for more on the representativeness of the sample.
Following Broockman and Skovron’s design (Reference Broockman and Skovron2018), each politician was presented with a set of concrete policy proposals relevant to their country, such as “(Country) should increase the number of immigrants it admits each year.” The statements selected were diversified in the policy domain covered and as whether agreement was in a liberal or a conservative direction (see Table A2.1 in the Supplementary Material). We categorized the statements into four categories relevant to the two main dimensions of political debate—economic and social/cultural (Kriesi et al. Reference Kriesi, Grande, Lachat, Dolezal, Bornschier and Frey2008; see the Supplementary Material, section 2). On the economic dimension, we selected statements related to redistribution and workers’ rights, and to pension/retirement policies. On the social/cultural dimension, we selected statements related to immigration and to social-cultural topics like euthanasia and child adoption by same-sex couples. For each policy statement, politicians in Belgium, Canada, and Germany were asked to assess support among the general public and among their own party electorate. Footnote 2 Politicians in Switzerland rated party electorate opinion, and additionally district opinion Footnote 3 (but not general public opinion). Our design differs slightly from Broockman and Skovron, as they only asked politicians to estimate public opinion in their electoral districts. Replicating this choice in our countries would have been problematic. In Germany, some politicians are elected through nationwide lists, and in Belgium parties slate lists of members in large, multi-member districts. Therefore, we opted for modes of representation relevant to all politicians surveyed. Earlier research (Dudzińska et al. Reference Dudzińska, Poyet, Costa, Weßels, Deschouwer and Depauw2014) shows that two important targets of representation for politicians in the countries we cover are the national electorate, and their own party electorate (with the exception of Switzerland, where cantonal/district party systems are more relevant than the national one). Eliciting estimations about public opinion at those two levels was therefore conceptually meaningful for the politicians interviewed. This difference in survey design should be kept in mind when analyzing our data.
In each country, we also conducted parallel general population surveys (see Supplementary Material, section 3), which we use to calculate the actual percentage of support for each policy statement among the general public (in Belgium, Canada, and Germany), the electoral district (in Switzerland), and the different party electorates (in all countries).Footnote 4 This design allows for evaluating the presence of a conservative bias in politicians’ assessment of three different sorts of public opinion (national, electoral district, and party), whereas existing work in the US has focused exclusively on the assessment of district opinion.Footnote 5
We use these estimates to test for the existence of an ideological bias in politicians’ perception in each country and on each of our four issue domains of interest. We use two different indicators capturing its magnitude and scope: (1) the average gap (in percentage points) between politicians’ estimation of the share of the public that agrees with the policy, and the actual share of the public that does so, and (2) the share of politicians in each country who overestimate the conservativeness of voters.
RESULTS
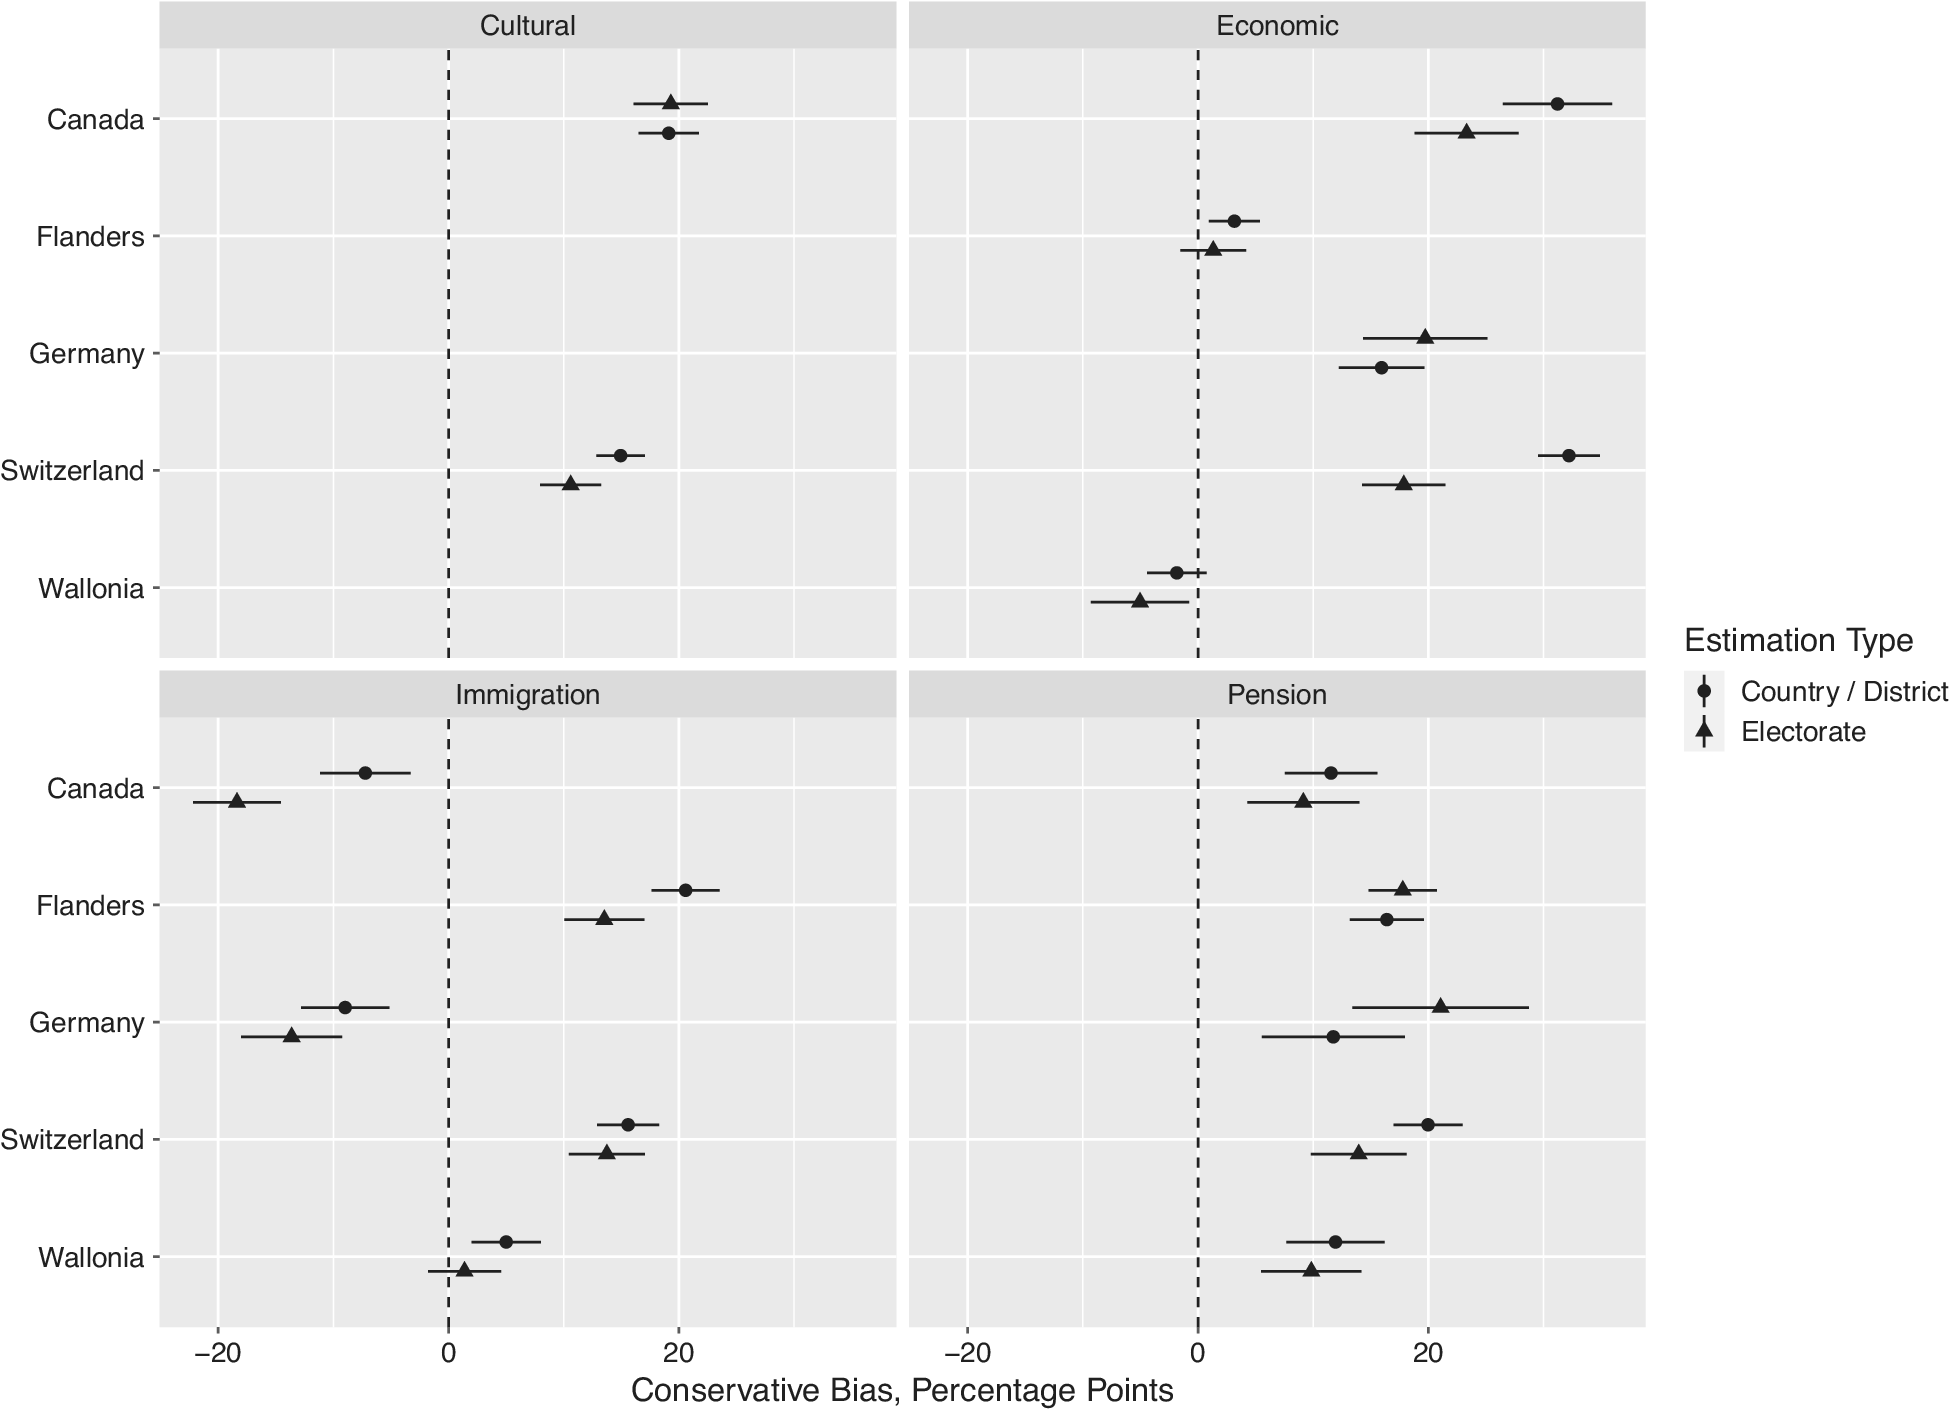
Figure 1 reports the average gap between politicians’ perception of general public opinion and citizens’ actual opinion (circles), and between their estimation of their party’s electorate opinion and the observed opinion within that electorate (triangles) for each issue domain and each country. Both measures reveal a substantial and largely consistent conservative bias in politicians’ perceptions—politicians perceive both the overall public and their party’s electorate to hold more right-leaning opinions on most policy issues.
Conservative Bias, by Policy Issue and Type of Opinion Estimated
Note: Figure 1 presents the mean gap in politicians’ perception of country/district public opinion (circles) and of party electorate opinion (triangles), by country (y-axis) and policy issue (panels). Bars represent 95% confidence intervals of the estimates. Estimates are mean values for all politicians and statements for a given issue/country. Detailed information for Figure 1 can be found in the table in Supplementary Material, section 4.

The most pronounced conservative bias is found on policies concerning pension/retirement. In all cases except Wallonia, we also observe a conservative bias on the second set of economic issues (related to redistribution, taxation, or workers’ rights), with the bias being especially large in Canada and Germany. On the social/cultural dimension, we observe that Canadian and Swiss politicians hold a conservative bias.
Immigration stands out as the only issue domain on which we do not observe a consistent conservative bias. It is found in Flanders, Switzerland, and Wallonia, while there is a large liberal bias in politicians’ perception of public opinion regarding immigration in Canada and Germany.
The findings on electorate opinion are by and large similar but where they differ, politicians appear to project conservativeness on their partisans to a slightly lesser degree than on the general population. However, these differences are mostly not statistically significant.
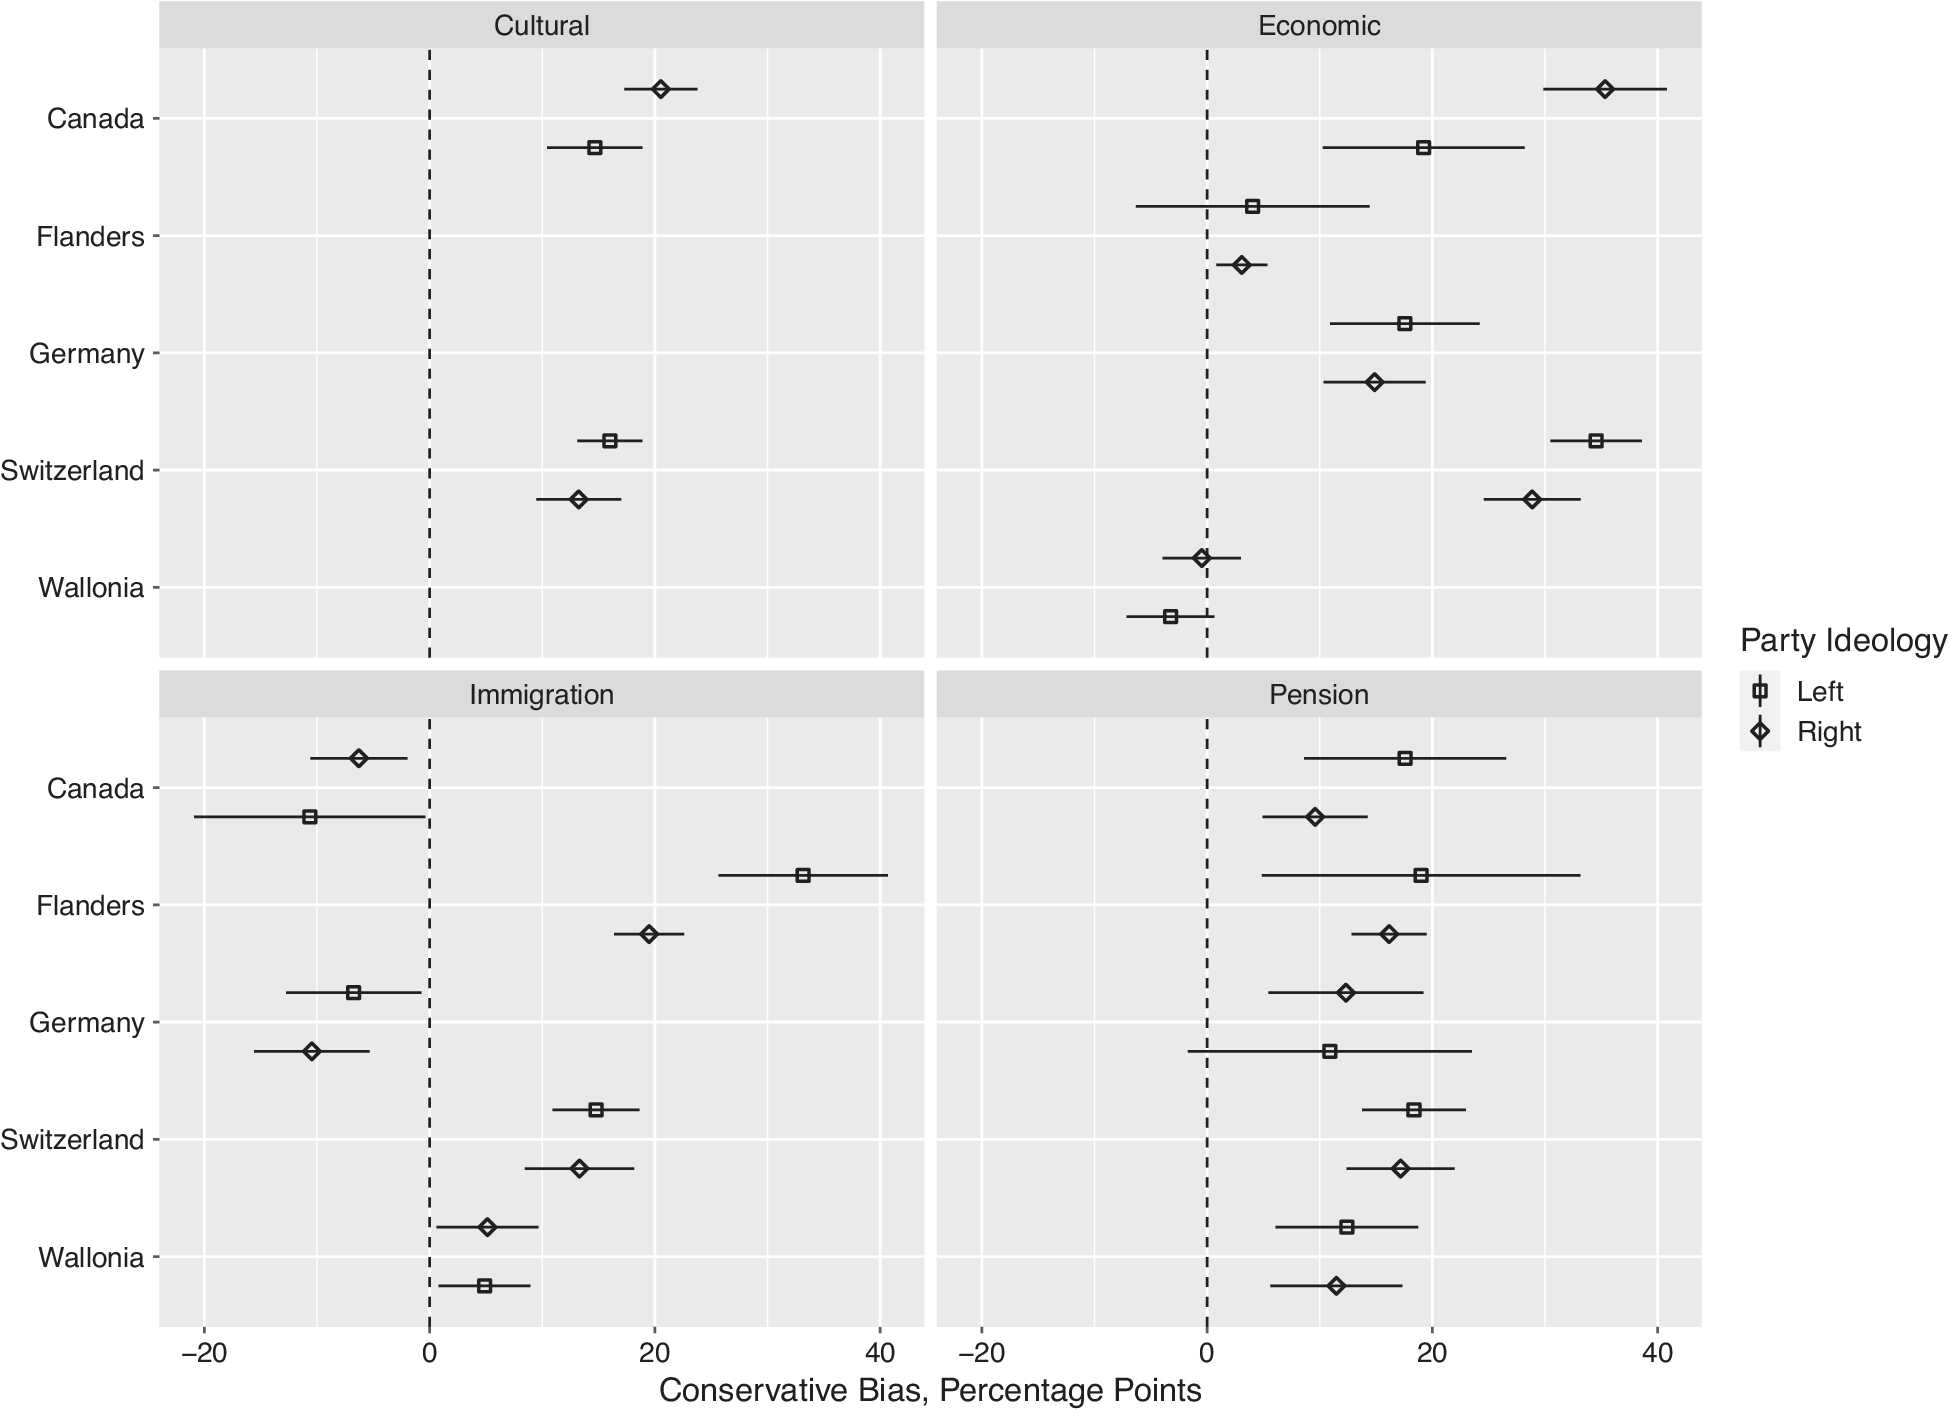
We test the consistency of the conservative bias by estimating the results separately for politicians belonging to left- and right-wing parties in each country (see Figure 2).Footnote 6 On most issues, the conservative bias is found in politicians across the political spectrum. Contrary to the US, we do not observe a consistently stronger conservative bias among right-wing politicians.Footnote 7
Conservative Bias, by Policy Issue and Respondents’ Party Ideology
Note: Figure 2 presents the mean country/district level conservative bias, by country (y-axis) and policy issue (panels) for left-wing (squares) and right-wing (diamonds) politicians. Bars represent 95% confidence intervals of the estimates. Estimates are mean values for all politicians and statements for a given issue/country. Detailed information for Figure 2 can be found in the table in Supplementary Material, section 4.

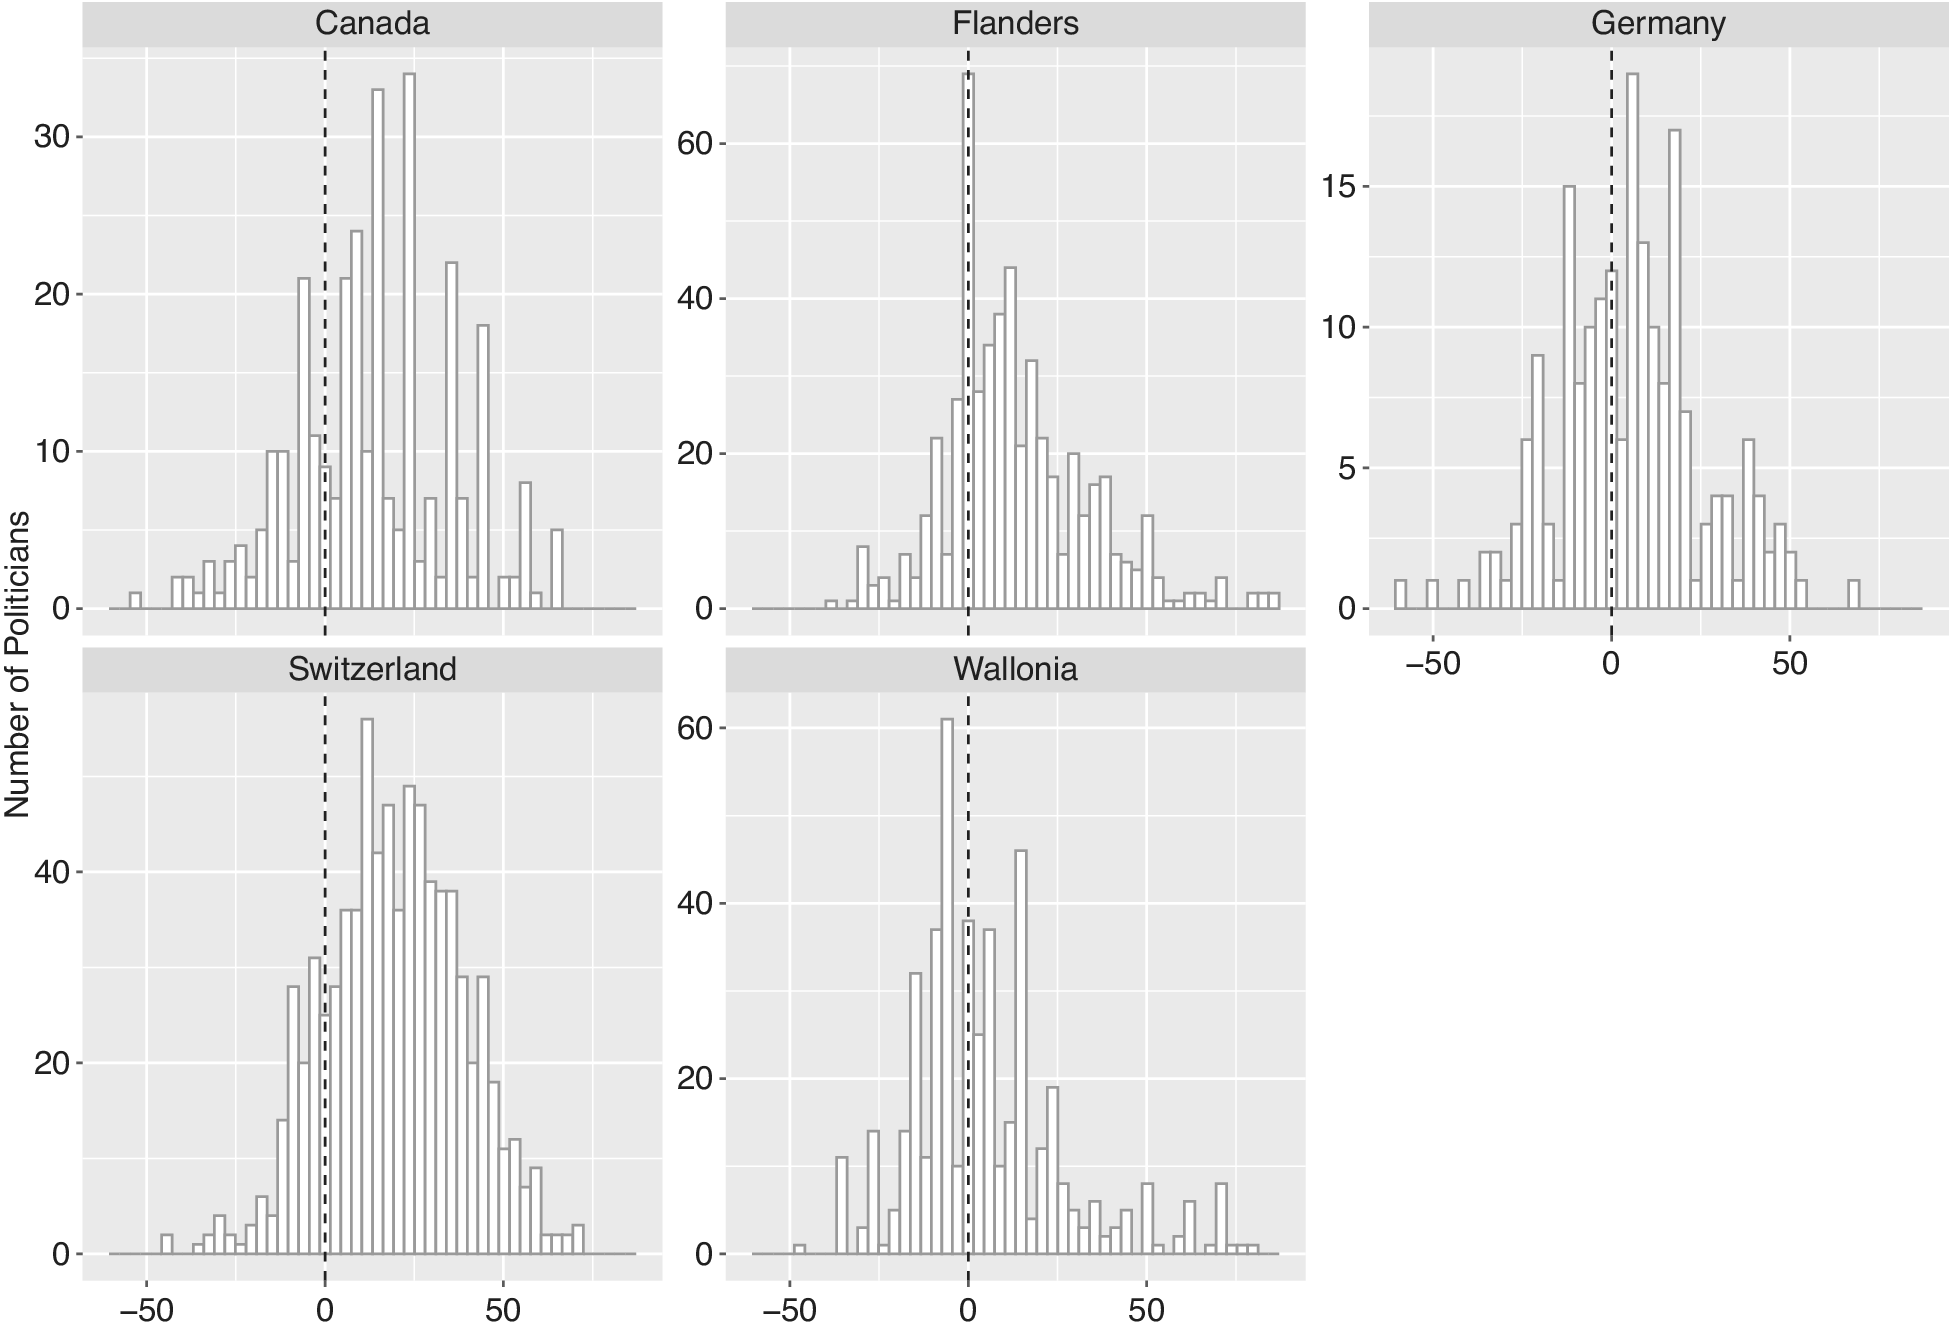
Figure 3 reports, for each country, the distribution of politicians in terms of inaccuracy of their estimation of public opinion, averaged across all of the statements. Politicians on the right of the dotted line hold (on average) a conservative bias; those on the left hold a liberal bias. A large majority of politicians show a consistent overestimation of the conservativeness of public opinion in their country (645 politicians, representing 81% of our sample). This proportion varies by country but is always over 60%, ranging from 64% (Wallonia) and 67% (Germany) to 86%, 91%, and 92% of all politicians in Switzerland, Flanders, and Canada.
Distribution of Politicians’ Conservative Bias, by Country
Note: X axis values represent mean public opinion estimation gap, in percentage points. Positive values indicate a conservative bias. Bar heights are the cumulative number of politicians per value.

In sum, our results show a persistent conservative bias among politicians, in each of the countries, across different issue domains, in estimations of both general public opinion and electorate opinion, and irrespective of the politicians’ party ideology. Yet, next to this general pattern, we also observe an inconsistent pattern regarding politicians’ perceptions of public preferences on immigration: in Belgium and Switzerland politicians exhibit a conservative misestimation, in Germany and Canada, misperception of public opinion has a liberal bias—underestimating the public’s conservatism.
POTENTIAL SOURCES OF THE CONSERVATIVE BIAS
Broockman and Skovron (Reference Broockman and Skovron2018) suggest that the conservative bias could be driven by conservative citizens being more politically active, especially in contacting their representatives, potentially skewing politicians’ information environment. They provide evidence on this by survey data showing that Republican voters report having contacted their representatives more often than Democratic voters.
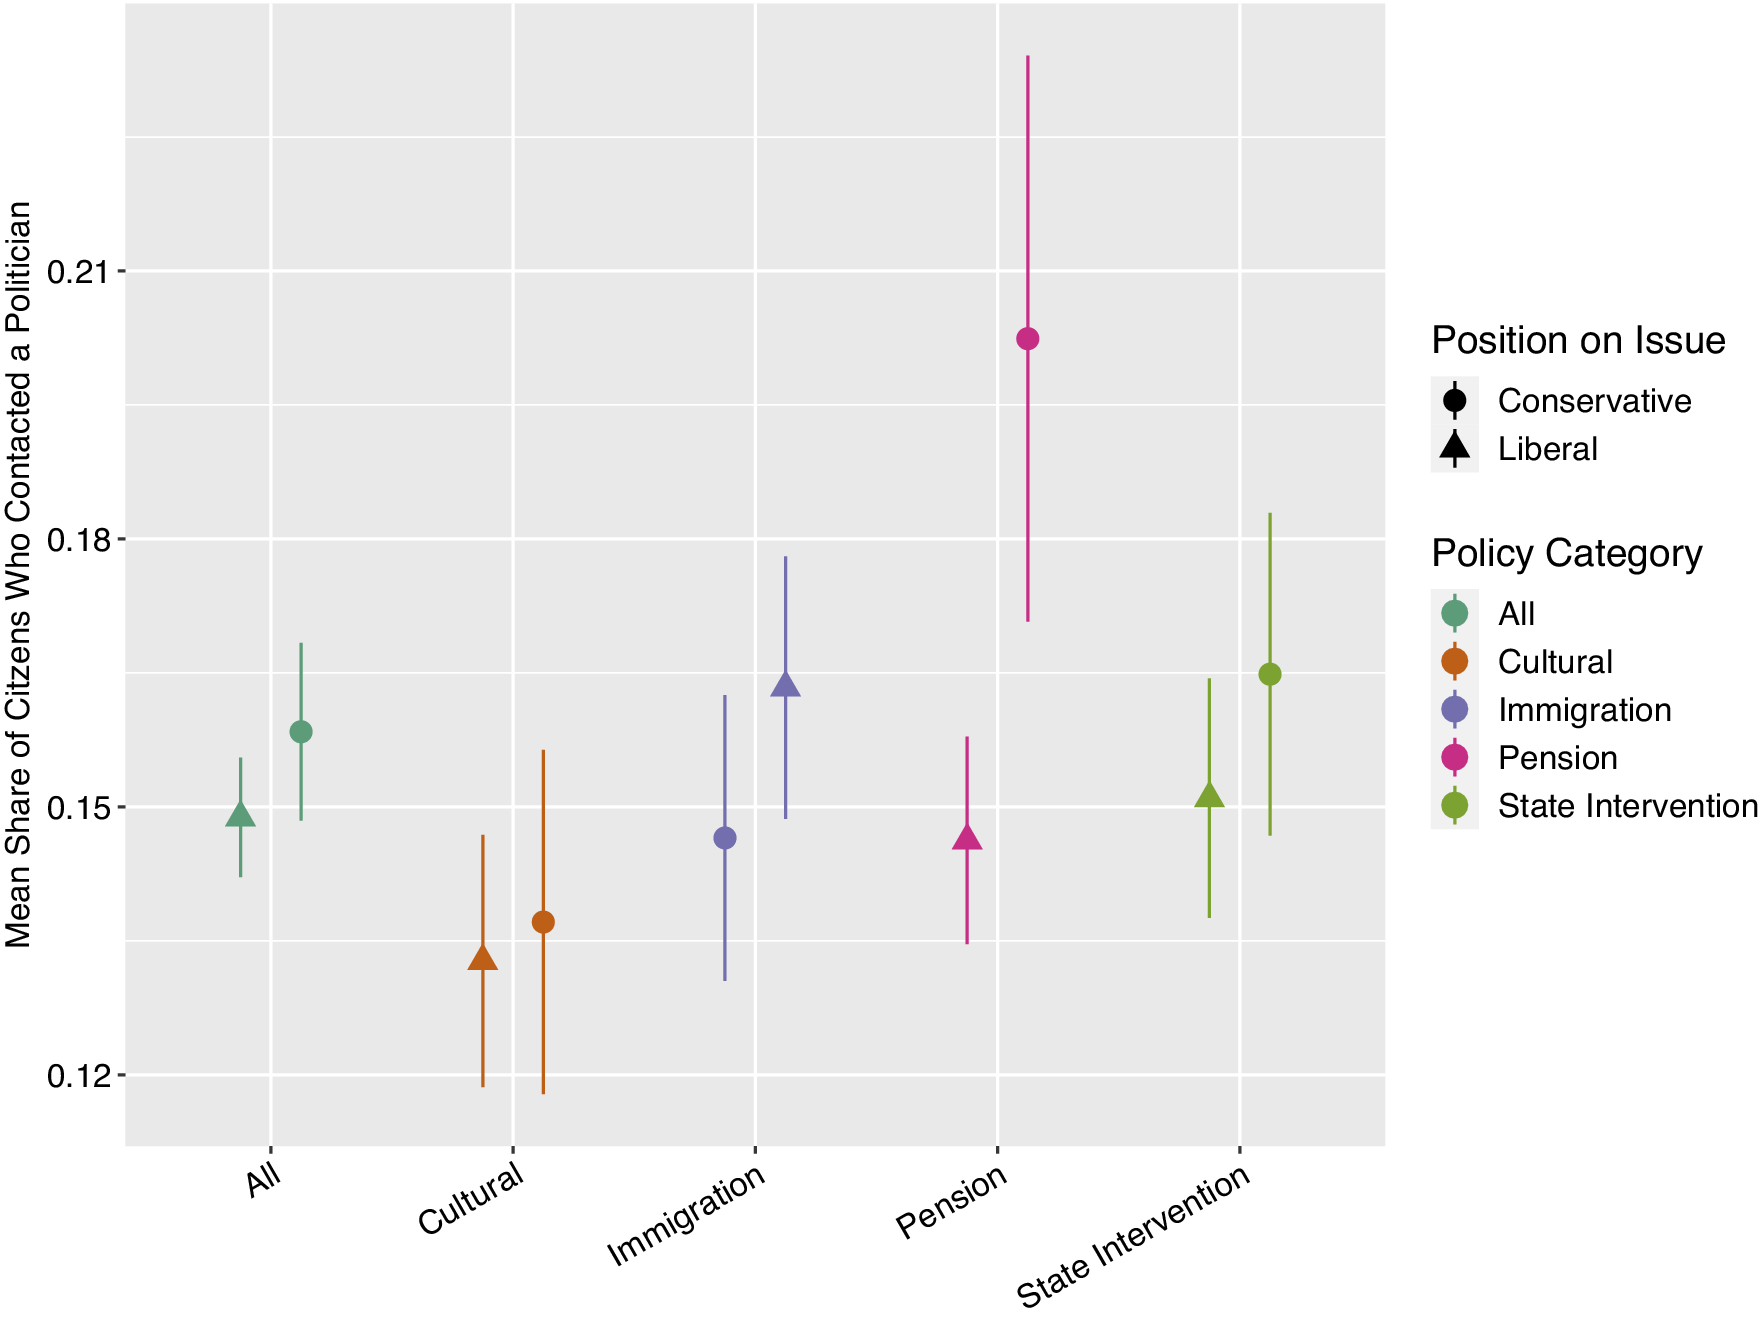
We conduct a similar, albeit more fine-grained test: in each country, we asked citizens about their position on each policy statement and about their participatory behavior. We can directly test whether citizens holding a conservative opinion on a specific policy statement are more politically active.Footnote 8 Figure 4 plots the mean share of citizens holding conservative and liberal views on our statements who have contacted a politician over the last 12 months.Footnote 9
Citizens Contact with Politicians
Note: Figure 4 presents the mean share of citizens who contacted a politician in the past 12 months (y-axis) for citizens holding a conservative (circles) and a liberal (triangles) position, by policy domain (colour). Detailed information for Figure 4 can be found in the table in Supplementary Material, section 7.

Figure 4 mostly does not show consistently significant differences in activism levels between those who hold conservative and liberal positions, except on pensions.Footnote 10 Overall, the difference in political activism between conservatives and liberals does not seem to consistently explain the conservative bias in public opinion perception of non-American politicians. It might have some explanatory purchase in some cases (e.g., on pensions) but this does not appear to be the case in other domains. This suggests that although we observe a similar conservative bias in the countries studied here, further analysis is required to confirm whether Broockman and Skovron’s participation conjecture holds outside of the US.
More broadly, our findings should motivate research on other potential sources of the conservative bias in politicians’ perception of public opinion. While we do not observe that conservative citizens are more politically active overall, other processes could still result in politicians operating in a skewed information environment. Conservative citizens might not be more active overall, but when they are, their actions might be more radical or their expression more extreme, and therefore more memorable for politicians (see Jasko et al. Reference Jasko, LaFree, Piazza and Becker2022; Webber et al. Reference Webber, Kruglanski, Molinario and Jasko2020). Conservative citizens might also be disproportionally active on specific (potentially more salient or emotionally charged) issues, which could lead politicians to erroneously deduce that the public is conservative on other issues as well. Politicians also pay increasing attention to social media, which, at least in the US, tends to be dominated by conservative views (Schradie Reference Schradie2019). Finally, politicians might also receive disproportionally right-skewed information from business interest groups (Hertel-Fernandez , Mildenberger, and Stokes Reference Hertel-Fernandez, Mildenberger and Stokes2019; Eichenberger, Varone, and Helfer Reference Eichenberger, Varone and Helfer2022).
Explanations for the conservative bias should also be examined beyond the information environment. Recent research has shown that politicians tend to pay more attention to the policy preferences of more affluent and educated citizens (Pereira Reference Pereira2021). As income is correlated with more conservative (economic) positions, this might partly explain the conservative bias in public opinion estimation. Furthermore, politicians themselves are likely not fully representative of the public in their policy preferences. If they tend to be by and large more conservative, they might be overestimating conservativeness by projecting their own opinion on the public. However, current research on policy congruence finds that politicians are slightly more right-wing than citizens on economic issues (Rosset and Stecker Reference Rosset and Stecker2019; Thomassen Reference Thomassen2012), but more liberal on issues such as immigration (Freeman, Hansen, and Leal Reference Freeman Gary, Hansen and Leal2013; Morales, Pilet, and Ruedin Reference Morales, Pilet and Ruedin2015) (see the Supplementary Material, section 8). The observed conservatism bias might also be associated with what social psychologists call “pluralistic ignorance” (i.e., misperceptions of others’ opinions; Katz, Allport, and Jenness Reference Katz, Allport and Jenness1931) and their underlying mechanisms, namely false uniqueness and false consensus. These mechanisms are directly linked to political orientation (Rabinowitz et al. Reference Rabinowitz, Latella, Stern and Jost2016; Stern, West, and Schmitt Reference Stern, West and Schmitt2014; Stern et al. Reference Stern, West, Jost and Rule2014): liberals tend to exaggerate the uniqueness of their own opinion (false uniqueness); conservatives perceive their opinions as more common than they are (false consensus). Hence, both could explain the conservative bias found among politicians. Finally, future comparative research might also examine how institutions, and especially electoral institutions, might affect how politicians perceive public opinion. Differences in electoral rules, electoral constituencies, and party-centeredness might incentivize different efforts by politicians when seeking information about voters’ preferences, and they might also change the clarity of electoral results as public opinion signals. All of these potential factors warrant further exploration in future research that falls beyond the scope of this letter.
CONCLUSION
This study demonstrates that the conservative bias in politicians’ perception of public opinion documented in the US (Broockman and Skovron Reference Broockman and Skovron2018) extends to elected representatives in other Western democracies with widely different political systems (Belgium, Canada, Germany, and Switzerland). We observe it on a wide variety of policy issues, among both left- and right-wing politicians, and equally for politicians’ assessment of their country’s national public opinion, district constituents (in Switzerland), and own party’s electorate. There are remarkably few cases where the conservative bias is absent—notably, in the policy domain of immigration for politicians in Canada and Germany.
Such biases in elite perception of what the people want may have important implications for policy responsiveness. If politicians’ ideas of what the public thinks are systematically biased toward one ideological side, then the political representation chain is weakened. Public satisfaction with democracy, which depends on the polities’ ability to produce desired policies, is likely to suffer as a result.
Our findings call for further research on the conservative bias in additional countries with differing institutional environments, especially in less established democracies, and on a wider set of policy issues. Perhaps most importantly, they stress the need to further study the root causes of the conservative bias in politicians’ public opinion perceptions.
Supplementary Material
To view supplementary material for this article, please visit http://doi.org/10.1017/S0003055423000527.
Data availability statement
Research documentation and data that support the findings of this study are openly available at the American Political Science Review Dataverse: https://doi.org/10.7910/DVN/YUFLFF.
Acknowledgements
The authors thank Arno Jansen, Karolin Soontjens, Julie Sevenans, Kirsten Van Camp, Pauline Ketelaars, Yves Dejaeghere, John McAndrews, Matthew Ayling, Blake Lee-Whiting, Jonah Goldberg, Nathalie Brack, Peter Loewen, Stefanie Bailer, Christian Breunig, David Talukder, Maria Jimena Sanhueza, Sacha Rangoni, and Roosmarijn De Geus for their contributions to this project. They also wish to thank the Editors and anonymous reviewers for their thorough and helpful feedback. For invaluable discussion and comments, they also wish to thank all participants to the Workshop “Elites and Public Opinion” of the ECPR Joint Sessions in 2022 in Edinburgh, and especially the two workshop convenors: Tinette Schnatterer and Chris Butler.
Funding statement
The data were collected in the framework of the POLPOP project. POLPOP is a transnational collaboration examining the perceptual accuracy of politicians in five countries, initiated by Stefaan Walgrave. The Principal Investigators (+ funders) per country responsible for data collection were, for Flanders-Belgium: Stefaan Walgrave (FWO, grant number G012517N); Wallonia and Brussels-Belgium: Jean-Benoit Pilet and Nathalie Brack (FNRS, grant number T.0182.18); Canada: Peter Loewen and Lior Sheffer (supported by a Social Sciences and Humanities Research Council of Canada Insight Grant and by the Dean of the Faculty of Arts & Science at the University of Toronto); Germany: Christian Breunig and Stefanie Bailer (funded by AFF 2018 at the University of Konstanz); Netherlands: Rens Vliegenthart and Toni van der Meer; and Switzerland: Frédéric Varone and Luzia Helfer (SNSF, grant number 100017_172559). Note that the Dutch data were excluded from the analysis because of the non-representativeness of the citizen data.
Conflict of interest
The authors declare no ethical issues or conflicts of interest in this research.
Ethical standards
The authors declare the human subjects research in this article was conducted in compliance with all relevant laws and regulations in place in the countries where the interviews of politicians were conducted. For European universities involved, compliance with regulations was verified by Data Protection Officers (in line with the European Union General Data Protection Regulation (GDPR). In addition, data collection, analysis, and storage procedures were verified by the relevant ethics board for each country under study. In Belgium, it obtained ethical approval from the Ethische Adviescommisse Sociale en Humane Wetenschappen of the University of Antwerp (Flanders, Belgium) on February 10, 2017. In Canada, it obtained ethical approval from the University of Toronto’s Social Sciences, Humanities & Education REB on November 27, 2018. In Switzerland, it obtained ethical approval from the Ethics Commission of the Geneva School of Social Sciences (University of Geneva) on April 16, 2018. In Germany, the Ethics Committee (IRB) of the University of Konstanz judged that approval by the IRB or any regulatory body was not required for this project (but note that the university more generally enforces the proper adherence to ethics guidelines).




Comments
No Comments have been published for this article.