I. INTRODUCTION
In hot forming, metallic materials often undergo severe plastic deformation, which induces the complicated microstructural evolutions, such as phase transformation, dynamic recrystallization (DRX), and dynamic recovery (DRV), etc. The hot deformation behaviors of metallic materials are greatly affected by hot forming conditions, including strain, strain rate, deformation temperature, etc. Reference Lin and Chen1,Reference Lin, Wen, Huang, Chen and Chen2 Meanwhile, microstructural evolution in metallic materials also exerts considerable impacts on hot deformation behaviors. Reference Liang, Guo, Ning, Peng, Qin, Shi and Nan3–Reference Liu, Ning, Yao and Fu6 Therefore, the interactions between the hot deformation mechanisms and microstructural evolution need to be thoroughly investigated. Reference Momeni, Ebrahimi and Faridi7–Reference Serajzadeh, Ranjbar Motlagh, Mirbagheri and Akhgar9
Up to now, some suitable models are used to characterize the hot deformation behaviors and microstructural evolution in metallic materials. Reference Lin and Chen1,Reference Sakai, Belyakov, Kaibyshev, Miura and Jonas10,Reference Gambirasio and Rizzi11 The phenomenological constitutive models, such as Arrhenius hyperbolic-sine equation and Johnson–Cook model, are often established based on empirical observations. Reference Abbasi-Bani, Zarei-Hanzaki, Pishbin and Haghdadi12–Reference Trimble and O'Donnell17 The material parameters can be easily calibrated based on experimental data. Meanwhile, the accuracy of phenomenological constitutive model is relatively high at the given tested conditions. However, due to their empirical characteristics and lack of physical mechanism, the phenomenological constitutive models cannot be extrapolated to wide ranges of practice forming conditions. Accounting for the physical background of material, the theory of dislocation density, thermodynamics, and crystal plasticity are successively introduced, and some physically based constitutive models were reported. Reference Collins and Stone18–Reference He, Xie, Yang, Wang and Zhang20 The detailed background of dislocation density-based model is introduced in Sec. II.
Owing to the excellent thermo-mechanical performance, Ni-based superalloys are comprehensively used in aviation industries. Reference Liu, Ning, Nan, Liang, Li and Zhao21,Reference Zhang, Zhang, Li, Shen and Gu22 The excellent thermo-mechanical performance of Ni-based superalloys depends on the precise hot forming parameters. Thus, numerous research studies were performed to analyze the impacts of processing parameters on microstructural evolution and hot deformation behavior. Reference Lin, Wu, Chen, Chen, Wen, Zhang and Li23,Reference Wen, Lin, Chen, Chen, Zhang, Liang and Li24 Considering isotropic/kinematic hardening and γ′ directional coarsening, Le Graverend et al. Reference Le Graverend, Cormier, Gallerneau, Villechaise, Kruch and Mendez25 developed a microstructure-sensitive constitutive model to characterize the hot deformation behavior for single crystal Ni-based superalloys. Shore et al. Reference Shore, Morakabati, Abbasi, Momeni and Mahdavi26 thought that DRX is conducive to improve the ductility of Incoloy 901 alloy at high temperatures. Zhang et al. Reference Zhang, Zhang, Jiang and Lu27 studied DRX behaviors in hot deformation of Ni-based superalloy and discussed the impacts of strain rate on microstructure evolution. Satheesh Kumar et al. Reference Satheesh Kumar, Raghu, Bhattacharjee, Appa Rao and Borah28 proposed a phenomenological constitutive model to predict plastic deformation behavior of Ni-based superalloy based on Zener–Hollomon parameter and Cingara–Queen equation. Frisk et al. Reference Fisk, Ion and Lindgren29 improved the dislocation density-based model for Inconel 718 alloy by introducing the interactions between precipitates and dislocations.
Although numerous research studies were carried out to explore hot deformation behaviors and microstructural evolution in Ni-based superalloys, the impacts of DRX behavior on the dislocation density evolution and hot deformation behavior are still unidentified. The previous models still cannot describe the physical mechanisms during hot deformation, as well as microstructural evolution. The object of this study is to improve the classical dislocation density-based models to characterize the hot deformation behaviors and grain size evolution in a typical Ni-based superalloy.
II. BACKGROUND OF DISLOCATION DENSITY-BASED MODEL
To comprehensively understand the physical mechanisms of material during hot deformation, the dislocation density theory was successfully proposed, and some physically based constitutive models were reported. Bergström Reference Bergström30,Reference Bergström31 clarified the effects of mobile and immobile dislocations on the stress-strain behavior of polycrystalline α-Fe and discussed the applicability of the dislocation density model for the plastic deformation of metals. One of the most commonly applied models to describe the dislocation evolution is the Kocks–Mecking (KM) model, Reference Kocks and Mecking32,Reference Mecking and Kocks33 in which the dislocation density evolution is treated as a competition process between dislocation multiplication and annihilation. Based on KM model, some investigations are conducted to study the strain hardening behavior, inelastic deformation behavior and strain gradient of single crystal or polycrystal materials, accounting for various metallurgical features or different deformation conditions. Reference Bambach, Heppner, Steinmetz and Roters34–Reference Galindo-Nava and Rivera-Díaz-del-Castillo36 Estrin et al., Reference Estrin, Molotnikov, Davies and Lapovok37 Hug et al., Reference Hug, Dubos, Keller, Duchêne and Habraken38 and Ning et al. Reference Ning, Luo, Liang, Guo, Zhang and Tan39 presented several dislocation density-based models to discuss strain gradient effect during the hot deformation of metals at micrometer scale. Wedberg and Lindgren Reference Wedberg and Lindgren40 proposed a rate-dependent dislocation cell formation equation to analyze the high-rate deformation behavior of 316L stainless steel based on dislocation density theory. Csanádi et al. Reference Csanádi, Chinh, Gubicza, Vörös and Langdon41 characterized the plastic deformation of pure Al using phenomenological and dislocation density-based models. Shanthraj and Zikry Reference Shanthraj and Zikry42 analyzed the evolution of dislocation density in crystalline materials. Based on Hirth–Lothe formulation, Leung et al. Reference Leung, Leung, Cheng and Ngan43 fully considered the elastic interactions between dislocations, and proposed a new approach to compute dislocation density dynamics. Considering the excess vacancy concentration, Babu and Lindgren Reference Babu and Lindgren44 proposed a novel dislocation density-based model to characterize grain coarsening and hot deformation of Ti–6Al–4V alloy. Cyr et al. Reference Cyr, Mohammadi, Mishra and Inal45 presented a new thermo elasto-viscoplastic constitutive relation to model the hot deformation behavior of Al alloy. Considering the impacts of solid solution hardening, Orowan looping, and dislocation density evolution, Borodachenkova et al. Reference Borodachenkova, Barlat, Wen, Bastos and Grácio46 developed a novel model for the high-pressure torsional deformation behaviors of Al–Zn alloy.
During hot deformation, dynamic softening caused by DRX is one of the main characteristics of metallic materials with low stacking-fault energy (SFE). Reference Marandi, Zarei-Hanzaki, Zarei-Hanzaki and Abedi47–Reference Zhang, Zhang, Zhou, Lu, Zhao and Yang49 Generally, the work hardening (WH) and DRV behaviors can be well described by dislocation density theory. Reference Estrin and Mecking50 For studying the dynamic softening behavior of low SFE alloys, the dislocation density theory is combined with other techniques, such as the cellular automaton (CA), phase field and crystal plasticity. Reference Engberg and Lissel51–Reference Takaki, Yoshimoto, Yamanaka and Tomita55 Engberg and Lissel Reference Engberg and Lissel51 presented a physically based microstructure model for predicting the microstructural evolution of a C–Mn steel during and after hot deformation. Li et al. Reference Li, Wu and Yang52 modified the theories of dislocation density evolution and DRX, and proposed a novel crystal plasticity method for hot deformation behaviors of wrought α/β-Ti alloys. Ding and Guo Reference Ding and Guo53 coupled CA method with DRX to simulate the hot deformation behavior and microstructural evolution in OFHC copper. Popova et al. Reference Popova, Staraselski, Brahme, Mishra and Inal54 simulated DRX behaviors of Mg alloys by coupling CA method with crystal plasticity model. Takaki et al. Reference Takaki, Yoshimoto, Yamanaka and Tomita55 stimulated the microstructural evolution of copper by combining elastic–plastic finite element model and phase field method. Lin et al. Reference Lin, Liu, Chen, Huang, Ma and Long56 developed a CA model with probabilistic state switches to simulate the microstructural evolution in a Ni-based superalloy during static recrystallization (SRX), and the relationship between the dislocation density evolution and SRX.
III. MATERIALS AND EXPERIMENTS
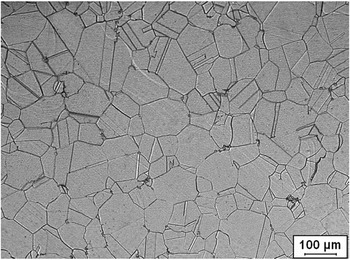
The studied material was a commercial Ni-based superalloy with chemical components (wt%) of 52.82Ni–18.96Cr–5.23Nb–3.01Mo–1.00Ti–0.59Al–0.01Co–0.03C–(bal.)Fe. This superalloy is similar to Inconel 718 alloy in United States. Cylindrical samples with a dimension of ϕ 8 mm × 12 mm were sectioned from a wrought biscuit. The samples were annealed at 1040 °C for 45 min and then quenched in water to homogenize the initial microstructure. Isothermal compression experiments were carried out by a Gleeble-3500 thermomechanical simulator with 100 kN maximum load (Dynamic Systems Inc., Poestenkill, New York). The deformation temperatures varied from 920 to 1040 °C with the interval of 30 °C. The strain rates were 0.001, 0.01, 0.1, and 1 s−1. Before isothermal compression, the samples were heated to the tested temperature at a rate of 10 °C/s, and soaked for 5 min. Then, the samples were compressed to 30% height, and quenched in water after hot deformation. The deformed samples were cut and polished for optical observation. The etching solution consisted of HCl (100 mL), CH3CH2OH (100 mL), and CuCl2 (5 g). The microstructure of the studied superalloy was detected by Leica optical microscope before hot deformation, as shown in Fig. 1. Obviously, there are numerous fine equiaxed grains and some straight annealing twins.
The initial optical microstructure of the studied superalloy.

IV. CLASSICAL DISLOCATION DENSITY THEORY
The hot deformation of metallic materials generally consists of two stages, i.e., elastic and plastic stages. During the elastic deformation, flow stress obeys Hooke's law, and there are no obvious microstructural changes in materials. However, the complex microstructural evolution (dislocation generation, accumulation, annihilation, etc.) often occurs in plastic stage. Furthermore, the flow stress is assumed as,
 $$\sigma = {\sigma _{\rm{y}}} + {\sigma _{\rm{i}}}\quad ,$$
where σy is the short-range stress for the ignition point of dislocation slip, σi is the stress induced by immobile dislocation.
The dislocation-dependent item (σi) can be expressed as, Reference Mecking and Kocks33,Reference Estrin, Krausz and Krausz57
 $${\sigma _{\rm{i}}} = M\alpha \mu b\sqrt {{\rho _{\rm{i}}}} \quad ,$$
where ρi is average dislocation density during plastic deformation. α is the dislocation interaction constant varing from 0.2 to 0.8 for most alloys. Reference Lindgren, Domkin and Hansson58 M is Taylor factor (3.06 for face-center-cubic metals). Reference Mecking, Kocks and Hartig59 b is the magnitude of Burgers vector. μ is the temperature-dependent shear modulus.
In the original KM model, Reference Mecking and Kocks33 the rate of dislocation density evolution is expressed as,
 $${\dot \rho _{\rm{i}}} = \dot \rho _{\rm{i}}^ + - \dot \rho _{{\rm{i}}\left( {{\rm{drv}}} \right)}^ - \quad ,$$
where
 $\dot \rho _{\rm{i}}^ +$
is WH item,
 $\dot \rho _{{\rm{i}}\left( {{\rm{drv}}} \right)}^ -$
is DRV item.
V. IMPROVED DISLOCATION DENSITY THEORY
The original KM model can well describe the hot deformation behavior in the WH and DRV periods. However, the DRV in low SFE alloys proceeds slowly, because dislocation cross-slip and climb are relatively difficult. Meanwhile, DRX usually occurs in the low SFE alloys during hot deformation. Figure 2 shows the typical flow stress curves with DRX and DRV processes. It can be found that the DRX mechanism significantly affects the hot deformation behavior. Furthermore, the previous works Reference Liu, Lin, Li, Wen, Chen and Chen60,Reference Wen, Lin, Chen, Deng, Chen, Zhang and He61 indicate that DRX is the major dynamic softening mechanism for the studied Ni-based superalloys. Therefore, it is necessary for introducing the DRX mechanism into dislocation density theory for the hot deformation behaviors of Ni-based superalloys is studied.
Typical true stress–true strain curves with DRX and DRV processes.

During hot deformation, the large DRX degree and fine dynamically recrystallized grain usually result in low-flow stresses. So, a new item (σg) is proposed to represent the impacts of grain size evolution on flow stress, and Eq. (1) can be updated as,
 $$\sigma = {\sigma _{\rm{y}}} + {\sigma _{\rm{i}}} + {\sigma _{\rm{g}}}\quad .$$
In the following sections, σy, σi, and σg of the studied superalloy will be evaluated in detail, respectively.
A. Evaluation of σy
The short-range stress (σy) is initial stress for dislocation passing the lattice or short-range obstacles, and highly relates with deformation temperature and strain rate. Reference Mecking and Kocks33 According to authors' previous report, Reference Lin, Chen, Wen and Chen62 the short-range stress is expressed as
 $${\sigma _{\rm{y}}} = k\ln Z + l\quad ,$$
where k and l are material constants. Z is Zener-Hollomon parameter,
 $Z = {\dot \varepsilon ^{\rm{p}}}\exp \left( {Q/RT} \right)$
. Here,
 ${\dot \varepsilon ^{\rm{p}}}$
is the strain rate (s−1), R is the universal gas constant (8.31 J mol−1 K−1), T the absolute temperature (K), Q the activation energy of hot deformation (kJ mol−1).
B. Evaluation of σi
During hot deformation, dislocation density evolution depends on two competing processes, i.e., dislocation accumulation (results in WH behavior) and dislocation annihilation (induced by DRX and DRV). Therefore, the dislocation density evolution is expressed as, Reference Galindo-Nava and Rivera-Díaz-del-Castillo63
 $${\dot \rho _{\rm{i}}} = \dot \rho _{\rm{i}}^ + - \dot \rho _{{\rm{i}}\left( {{\rm{drv}}} \right)}^ - - \dot \rho _{{\rm{i}}\left( {{\rm{drx}}} \right)}^ - \quad ,$$
where
 $\dot \rho _{\rm{i}}^ +$
,
 $\dot \rho _{{\rm{i}}\left( {{\rm{drv}}} \right)}^ -$
, and
 $\dot \rho _{{\rm{i}}\left( {{\rm{drx}}} \right)}^ -$
stand for the WH item, DRV item, and DRX item, respectively.
1. WH item
 $\dot \rho _{\rm{i}}^ +$

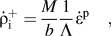
Before the mobile dislocations are immobilized or annihilated, the dislocation mean free path is a distance Λ. According to Orowan equation, the accumulation rate of dislocation density is inversely proportional to Λ and proportional to strain rate. Reference Estrin, Tóth, Molinari and Bréchet35 The accumulation rate of dislocation density is expressed as, Reference Mecking and Kocks33
 $$\dot \rho _{\rm{i}}^ + = {M \over b}{1 \over \Lambda }{\dot \varepsilon ^{\rm{p}}}\quad ,$$
where
 ${\dot \varepsilon ^{\rm{p}}}$
is strain rate, M is the Taylor factor.
In the KM model, the dislocation mean free path in a coarse-grained material is only determined by the substructure size, and is proportional to the average distance between dislocations
 $1/\sqrt \rho$
. However, during hot deformation, the DRX often occurs in metallic materials. Then, the coarse grain is significantly refined,
Reference Wen, Lin, Li, Chen, Deng and Li64
and the impacts of grain size evolution cannot be ignored. Therefore, the dislocation mean free path is expressed as,
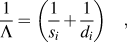 $${1 \over \Lambda } = \left( {{1 \over {{s_i}}} + {1 \over {{d_i}}}} \right)\quad ,$$
where d
i is the average grain size, s
i is the substructure diameter, which can be represented as
 ${k_{\rm{w}}}/\sqrt {{\rho _{\rm{\iota }}}}$
, and k
w is the WH coefficient-dependent of strain rate and deformation temperature.
When the strain is relatively small, the grain size can be assumed as a constant. With further straining, the DRX occurs, and the average grain size is significantly refined. A variation (X i), which indicates the DRX volume fraction, should be introduced to describe the grain size evolution in the DRX process. Therefore, the average grain size can be expressed as,
 $${d_{\rm{i}}} = {X_{\rm{i}}}{d_{{\rm{drx}}}} + \left( {1 - {X_{\rm{i}}}} \right){d_0}\quad ,$$
where d 0 and d drx stand for the initial and dynamically recrystallized grain size, respectively.
Based on Avrami equation, the DRX kinetics model can be described as, Reference Laasraoui and Jonas65
 $${X_{\rm{i}}} = 1 - \exp \left( { - 0.693{{\left( {{{{\varepsilon ^{\rm{p}}} - \varepsilon _{\rm{c}}^{\rm{p}}} \over {\varepsilon _{\rm{p}}^{\rm{p}}}}} \right)}^{{n_{\rm{d}}}}}} \right)\quad ,$$
where εp is the strain,
 $\varepsilon _{\rm{p}}^{\rm{p}}$
is the peak strain corresponding to peak stress,
 $\varepsilon _{\rm{c}}^{\rm{p}}$
is the critical strain for DRX, and n
d is a material parameter.
2. DRV item
$\dot \rho _{{\rm{i}}\left( {{\rm{drv}}} \right)}^ -$

Previous research studies show that there are two DRV mechanisms presented at different temperature ranges for FCC metals. Reference Galindo-Nava and Rivera-Díaz-del-Castillo63 The first one is dislocation cross-slip, which is the main DRV mechanism at low deformation temperatures (T < 0.3T m, where T m is the melting temperature). However, with deformation temperature increasing, the vacancy movement becomes active and accelerates dislocation climb. When the temperature increased to 0.6T m, the dislocation climb replaces the dislocation cross-slip as the main DRV mechanism. For high SFE alloys, DRV can balance the impacts of WH at high strain, and a steady flow stress appears. According to the KM model, the rate of DRV is proportional to dislocation density. Reference Galindo-Nava and Rivera-Díaz-del-Castillo66
 $$\dot \rho _{{\rm{i}}\left( {{\rm{drv}}} \right)}^ - = {f_{{\rm{drv}}}}{\rho _{\rm{i}}}{\dot \varepsilon ^{\rm{p}}}\quad ,$$
where f drv is the DRV coefficient-dependent on strain rate and deformation temperature.
3. DRX item
$\dot \rho _{{\rm{i}}\left( {\rm{drx}} \right)}^ -$

The dislocation cross-slip and climb in low SFE alloys can hardly pass the barriers, such as vacancy, dislocation, and grain boundary. DRV cannot balance WH with the further straining. When the dislocation density exceeds the critical value for initiating DRX, the nucleation and growth of DRX grain will take place. The high dislocation density subgrains transfer to the dislocation-free DRX grains, and the local dislocation density decreases greatly. So, a new item (
 $\dot \rho _{{\rm{i}}\left( {\rm {drx}} \right)}^ -$
) is introduced into the KM model to represent the impacts of DRX on the dislocation annihilation. However, the KM model only allows for the average dislocation density, and hardly describes the dislocation density evolution in local DRX regions. Therefore, the DRX volume fraction X
i should be introduced to represent the different DRX regions. With the further straining, the degree of DRX increases and the dislocation-free DRX grains gradually occupy the matrix. Furthermore, the dislocation density of the local DRX region is assumed to be the same as the initial material (ρi(drx) = ρi−i(cr)).
Reference Galindo-Nava and Rivera-Díaz-del-Castillo36
Therefore, the impacts of DRX on dislocation annihilation can be expressed as,
 $$\dot \rho _{{\rm{i}}\left( {{\rm{drx}}} \right)}^ - = {X_{\rm{i}}}\,{f_{{\rm{drx}}}}{\rho _{{\rm{i}} - {\rm{i}}\left( {{\rm{cr}}} \right)}}{\dot \varepsilon ^{\rm{p}}}\quad ,$$
where f
drx is DRX coefficient and depends on strain rate and deformation temperature. X
i is DRX volume fraction. It should be noted that this item is active only when
 ${\varepsilon ^{\rm{p}}} \,\ge\, \varepsilon _{\rm{c}}^{\rm{p}}$
. Here,
 $\varepsilon _{\rm{c}}^{\rm{p}}$
is the critical strain for initiating DRX.
According to the above analyses, the dislocation density evolution in WH, DRV, and DRX periods can be determined by Eqs. (6)–(12). Then, substituting the total dislocation density into Eq. (2), the flow stress caused by the dislocation density evolution can be evaluated.
C. Evaluation of σg
According to the previous research, Reference Hall67 Hall–Petch equation can describe the impacts of grain size on the WH behavior at room temperature. The strength is generally high for the metals with fine grains. However, during hot deformation, the metals with fine grains always represent the low flow stress. In the improved dislocation density theory, the impacts of fine DRX grains on flow stress are assumed to comply with Hall–Petch type relationship. Also, the dynamically recrystallized region should be considered.
 $${\sigma _{\rm{g}}} = - {X_{\rm{i}}}{k_{\rm{g}}}d_{\rm{i}}^{{{ - 1} \mathord{\left/ {\vphantom {{ - 1} 2}} \right. \kern-\nulldelimiterspace} 2}}\quad ,$$
where k g is grain size evolution coefficient and depends on strain rate and deformation temperature. X i is DRX volume fraction. d i is average grain size.
D. Critical dislocation density for DRX
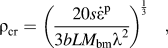
DRX usually appears when the dislocation density reaches a critical value. Subgrain forms near grain boundary or other crystal defects. As soon as the subgrain nucleus size reaches a certain threshold, the new dynamically recrystallized grain forms. Reference Sakai, Belyakov, Kaibyshev, Miura and Jonas10 Thus, the critical dislocation density (ρcr) should be determined firstly. According to previous research, Reference Popova, Staraselski, Brahme, Mishra and Inal54 the critical dislocation density is related to the energy changes in the recrystallized nucleation process.
 $${\rho _{{\rm{cr}}}} = {\left( {{{20s{{\dot \varepsilon }^{\rm{p}}}} \over {3bL{M_{{\rm{bm}}}}{\lambda ^2}}}} \right)^{{1 \over 3}}}\quad ,$$
where M bm is grain boundary mobility. s is grain boundary energy. λ is dislocation line energy, which is given by λ = cμb 2 (c is equal to 0.5). L is initial dislocation mean free path.
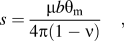
The grain boundary energy (s) highly depends on the misorientation of neighboring grains. The grain boundary energy for high angle boundaries is determined by, Reference Chen, Cui, Liu, Chen and Chen68
 $$s = {{\mu b{\theta _{\rm{m}}}} \over {4\pi \left( {1 - \nu } \right)}}\quad ,$$
where ν is the Poisson ratio. θm is the misorientation of high angle boundaries (taken as 15°).
The initial dislocation mean free path (L) is given by, Reference Derby69
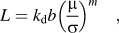 $$L = {k_{\rm{d}}}b{\left( {{\mu \over \sigma }} \right)^m}\quad ,$$
where m and k d are material constants.
The grain boundary mobility (M bm) can be expressed as, Reference Derby69
 $${M_{{\rm{bm}}}} = {{b\delta {D_{{\rm{ob}}}}} \over {{k_{\rm{b}}}T}}\exp \left( { - {{{Q_{{\rm{dif}}}}} \over {RT}}} \right)\quad ,$$
where D ob is grain boundary self-diffusion coefficient, Q dif is grain boundary diffusion activation energy, δ is the thickness of characteristic grain boundary. k b is Boltzmann constant, R is universal gas constant.
E. Main material parameters in the improved dislocation density theory
In the improved dislocation density theory, some material parameters, including σy, d 0, and d drx, can be directly evaluated from the experimental results. According to authors' previous report, Reference Wen, Lin, Li, Chen, Deng and Li64 the initial grain size (d 0) was about 75 μm. The short-range stress (σy) and the DRX grain size (d drx) are expressed as, Reference Lin, Chen, Wen and Chen62
 $${\sigma _{\rm{y}}} = 14.86\ln Z - 478.07$$
 $${d_{{\rm{drx}}}} = 3054.62{Z^{ - 0.13871}}$$
 $$Z = {\dot \varepsilon ^{\rm{p}}}\exp \left( {4.74 \times {{10}^5}/RT} \right)\quad .$$
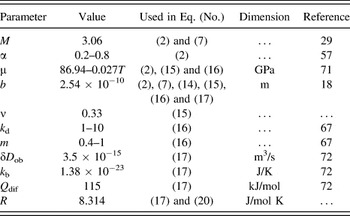
The values of theoretical material constants for the improved dislocation density theory are shown in Table I. Except for the above-given material parameters, the peak strain corresponding to peak stress (
 $\varepsilon _{\rm{p}}^{\rm{p}}$
) and critical strain for initiating DRX (
 $\varepsilon _{\rm{c}}^{\rm{p}}$
) can be determined by an implicit iterative procedure. The WH coefficient (k
w), DRV coefficient (f
drv), DRX coefficient (f
drx), grain size evolution coefficient (k
g), and DRX exponent (n
d) can be calibrated and optimized by genetic algorithm. In Sec. VI, the solution procedure of material parameter will be discussed in detail.
The values of theoretical material constants for the improved dislocation density theory.

VI. PROCEDURES TO OBTAIN THE MATERIAL PARAMETERS
To study the DRX kinetics and grain size evolution, an implicit iterative procedure is applied, and the internal variables are updated in every strain increment. The difference forms of Eqs. (9) and (10) are given by,
 $$\Delta {X_{\rm{i}}} = 0.693{{{n_{\rm{d}}}} \over {\varepsilon _{\rm{p}}^{\rm{p}}}}{\left( {{{{\varepsilon ^{\rm{p}}} - \varepsilon _{\rm{c}}^{\rm{p}}} \over {\varepsilon _{\rm{p}}^{\rm{p}}}}} \right)^{{n_{\rm{d}}} - 1}}\exp \left( { - 0.693{{\left( {{{{\varepsilon ^{\rm{p}}} - \varepsilon _{\rm{c}}^{\rm{p}}} \over {\varepsilon _{\rm{p}}^{\rm{p}}}}} \right)}^{{n_{\rm{d}}}}}} \right)\Delta {\varepsilon ^{\rm{p}}}$$
 $$\Delta {d_{\rm{i}}} = - \left( {{d_0} - {d_{{\rm{drx}}}}} \right)\Delta {X_{\rm{i}}}\quad .$$
Combining Eqs. (6), (7), (11) and (12), the evolution equation for dislocation density is expressed as,
 $${\dot \rho _{\rm{i}}} = {M \over b}\left( {{{\sqrt {{\rho _{\rm{i}}}} } \over {{k_{\rm{w}}}}} + {1 \over {{d_{\rm{i}}}}}} \right){\dot \varepsilon ^{\rm{p}}} - {f_{{\rm{drv}}}}{\rho _{\rm{i}}}{\dot \varepsilon ^{\rm{p}}} - {X_{\rm{i}}}{f_{{\rm{drx}}}}{\rho _{{\rm{i}} - {\rm{i}}\left( {{\rm{cr}}} \right)}}{\dot \varepsilon ^{\rm{p}}}\quad .$$
When the dislocation density is lower than a certain threshold, DRV is the main dynamic softening mechanisms. DRX and grain size evolution are ignored. The average grain size can be regarded as a constant and equal to initial grain size. Therefore, the dislocation density evolution equation supposing the absence of DRX (
 ${\dot \rho _{{\rm{i}}\left( {{\rm{rec}}} \right)}}$
) can be simplified as,
 $${\dot \rho _{{\rm{i}}\left( {{\rm{rec}}} \right)}} = {M \over b}\left( {{{\sqrt {{\rho _{{\rm{i}}\left( {{\rm{rec}}} \right)}}} } \over {{k_{\rm{w}}}}} + {1 \over {{d_0}}}} \right){\dot \varepsilon ^{\rm{p}}} - {f_{{\rm{drv}}}}{\rho _{{\rm{i}}\left( {{\rm{rec}}} \right)}}{\dot \varepsilon ^{\rm{p}}}\quad ,$$
where
 ${\dot \rho _{{\rm{i}}\left( {{\rm{rec}}} \right)}}$
is the dislocation density evolution supposing the absence of DRX.
From Eqs. (23) and (24), it can be found that the dislocation density needs to be updated in every strain increment. The implicit iterative procedure is adopted to calculate the dislocation density evolution in every strain increment. By assuming a constant increment (Δεp), the changes in state variables are determined by,
 $$\Delta {\rho _{\rm{i}}} = {M \over b}\left( {{{\sqrt {{\rho _{\rm{i}}}} } \over {{k_{\rm{w}}}}} + {1 \over {{d_{\rm{i}}}}}} \right)\Delta {\varepsilon ^{\rm{p}}} - {f_{{\rm{drv}}}}{\rho _{\rm{i}}}\Delta {\varepsilon ^{\rm{p}}} - {X_{\rm{i}}}{f_{{\rm{drx}}}}{\rho _{{\rm{i}} - {\rm{i}}\left( {{\rm{cr}}} \right)}}\Delta {\varepsilon ^{\rm{p}}}$$
 $$\Delta {\rho _{{\rm{i}}\left( {{\rm{rec}}} \right)}} = {M \over b}\left( {{{\sqrt {{\rho _{{\rm{i}}\left( {{\rm{rec}}} \right)}}} } \over {{k_{\rm{w}}}}} + {1 \over {{d_0}}}} \right)\Delta {\varepsilon ^{\rm{p}}} - {f_{{\rm{drv}}}}{\rho _{{\rm{i}}\left( {{\rm{rec}}} \right)}}\Delta {\varepsilon ^{\rm{p}}}\quad .$$
The stress induced by dislocation can be expressed as,
 $$\Delta {\sigma _{\rm{i}}} = {{{\rm{d}}{\sigma _{\rm{i}}}} \over {{\rm{d}}{\rho _{\rm{i}}}}}\Delta {\rho _{\rm{i}}} = \left( {{1 \over 2}\alpha M\mu b{\rho _{\rm{i}}}^{{{ - 1} \mathord{\left/ {\vphantom {{ - 1} 2}} \right. \kern-\nulldelimiterspace} 2}}} \right)\Delta {\rho _{\rm{i}}}\quad .$$
The stress induced by grain size evolution can be expressed as,
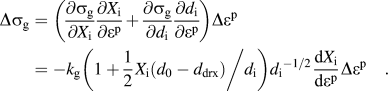 $$\Delta {\sigma _{\rm{g}}} = \left( {{{\partial {\sigma _{\rm{g}}}} \over {\partial {X_{\rm{i}}}}}{{\partial {X_{\rm{i}}}} \over {\partial {\varepsilon ^{\rm{p}}}}} + {{\partial {\sigma _{\rm{g}}}} \over {\partial {d_{\rm{i}}}}}{{\partial {d_{\rm{i}}}} \over {\partial {\varepsilon ^{\rm{p}}}}}} \right)\Delta {\varepsilon ^{\rm{p}}} = - {k_{\rm{g}}}\left( {1 + {{{1 \over 2}{X_{\rm{i}}}\left( {{d_0} - {d_{{\rm{drx}}}}} \right)} \mathord{\left/ {\vphantom {{{1 \over 2}{X_{\rm{i}}}\left( {{d_0} - {d_{{\rm{drx}}}}} \right)} {{d_{\rm{i}}}}}} \right. \kern-\nulldelimiterspace} {{d_{\rm{i}}}}}} \right){d_{\rm{i}}}^{{{ - 1} \mathord{\left/ {\vphantom {{ - 1} 2}} \right. \kern-\nulldelimiterspace} 2}}{{{\rm{d}}{X_{\rm{i}}}} \over {{\rm{d}}{\varepsilon ^{\rm{p}}}}}\Delta {\varepsilon ^{\rm{p}}}\quad .$$
Combining Eqs. (27) and (28), the flow stress increment can be represented as,
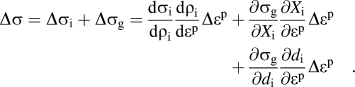 $$\Delta \sigma = \Delta {\sigma _{\rm{i}}} + \Delta {\sigma _{\rm{g}}} = {{{\rm{d}}{\sigma _{\rm{i}}}} \over {{\rm{d}}{\rho _{\rm{i}}}}}{{{\rm{d}}{\rho _{\rm{i}}}} \over {{\rm{d}}{\varepsilon ^{\rm{p}}}}}\Delta {\varepsilon ^{\rm{p}}} + {{\partial {\sigma _{\rm{g}}}} \over {\partial {X_{\rm{i}}}}}{{\partial {X_{\rm{i}}}} \over {\partial {\varepsilon ^{\rm{p}}}}}\Delta {\varepsilon ^{\rm{p}}} + {{\partial {\sigma _{\rm{g}}}} \over {\partial {d_{\rm{i}}}}}{{\partial {d_{\rm{i}}}} \over {\partial {\varepsilon ^{\rm{p}}}}}\Delta {\varepsilon ^{\rm{p}}}\quad .$$
The critical dislocation density can be evaluated by Eqs. (14)–(17). Meanwhile, combining Eqs. (24) and (26), the critical dislocation density also can be determined by,
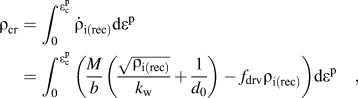 $${\rho _{{\rm{cr}}}} = \int_0^{{\rm{\varepsilon }}_{\rm{c}}^{\rm{p}}} {{{\dot \rho }_{{\rm{i}}\left( {{\rm{rec}}} \right)}}{\rm{d}}{\varepsilon ^{\rm{p}}}} = \int_0^{{\rm{\varepsilon }}_{\rm{c}}^{\rm{p}}} {\left( {{M \over b}\left( {{{\sqrt {{{\rm{\rho }}_{{\rm{i}}\left( {{\rm{rec}}} \right)}}} } \over {{k_{\rm{w}}}}} + {1 \over {{d_0}}}} \right) - {f_{{\rm{drv}}}}{\rho _{{\rm{i}}\left( {{\rm{rec}}} \right)}}} \right){\rm{d}}{\varepsilon ^{\rm{p}}}} \quad ,$$
Then, submitting the critical dislocation density [determined by Eqs. (14)–(17)] into Eq. (30), the critical strain for DRX can be solved.
The peak strain (
 $\varepsilon _{\rm{p}}^{\rm{p}}$
) is another key parameter in the improved dislocation density theory. Generally, typical ‘DRX’ curve exhibits peak stress at early straining, where the WH rate (θ = dσ/dεp) decreases to zero, as shown in Fig. 2. In other words, the flow stress increment is zero (Δσ = 0) as the peak stress is reached. Therefore, a differential equation needs to be solved.
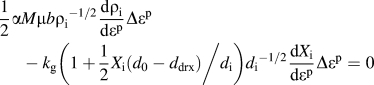 $${1 \over 2}\alpha M\mu b{\rho _{\rm{i}}}^{{{ - 1} \mathord{\left/ {\vphantom {{ - 1} 2}} \right. \kern-\nulldelimiterspace} 2}}{{{\rm{d}}{\rho _{\rm{i}}}} \over {{\rm{d}}{\varepsilon ^{\rm {p}}}}}\Delta {\varepsilon ^{\rm{p}}} - {k_{\rm{g}}}\left( {1 + {{{1 \over 2}{X_{\rm{i}}}\left( {{d_0} - {d_{{\rm{drx}}}}} \right)} \mathord{\left/ {\vphantom {{{1 \over 2}{X_{\rm{i}}}\left( {{d_0} - {d_{{\rm{drx}}}}} \right)} {{d_{\rm{i}}}}}} \right. \kern-\nulldelimiterspace} {{d_{\rm{i}}}}}} \right){d_{\rm{i}}}^{{{ - 1} \mathord{\left/ {\vphantom {{ - 1} 2}} \right. \kern-\nulldelimiterspace} 2}}{{{\rm{d}}{X_{\rm{i}}}} \over {{\rm{d}}{\varepsilon ^{\rm{p}}}}}\Delta {\varepsilon ^{\rm{p}}} = 0$$
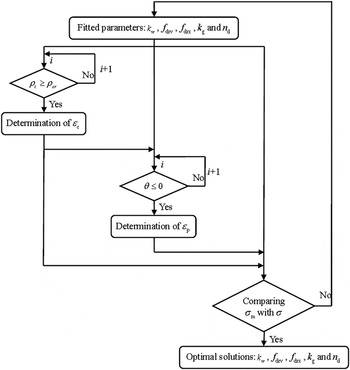
In this study, the above complicated equations and implicit iterative procedures are programmed in MATLAB software. Five material parameters (k
w, f
drv, f
drx, k
g, and n
d) are calibrated and optimized by the genetic algorithm. Figure 3 illustrates the algorithmic idea and flow chart. A group of initial values of material parameters (k
w, f
drv, f
drx, k
g, and n
d) need to be input into the program to trial. By comparing the predicted dislocation density with the critical dislocation density in theory, the critical strain for initiating DRX can be determined in the first iterative loop. By substituting the critical strain and initial values of material parameters into the second iterative loop, the peak strain can be obtained. The material parameters in the improved dislocation density theory are all determined, and the predicted stress is obtained. By comparing the predicted (σ) and measured (σm) flow stresses, the initial values of material parameters can be optimized by genetic algorithm again and again. Finally, a group of optimal material parameters (
 $\varepsilon _{\rm{c}}^{\rm{p}}$
,
 $\varepsilon _{\rm{p}}^{\rm{p}}$
, k
w, f
drv, f
drx, k
g, n
d) can be obtained. Then, the flow stress constitutive model, DRX kinetics model, and grain size evolution model are determined.
The algorithmic idea and flow chart.

VII. DISCUSSION
Figure 4 shows the comparisons between measured and predicted flow stresses at all tested conditions. It is easily detected that the measured (σm) flow stresses well agree with the predicted (σ) ones. So, the improved dislocation density theory can accurately predict the WH, DRV, and DRX behaviors of the studied superalloy at elevated temperatures.
Comparisons between the measured and predicted stresses under deformation temperatures of: (a) 920 °C; (b) 950 °C; (c) 980 °C; (d) 1010 °C; (e) 1040 °C.

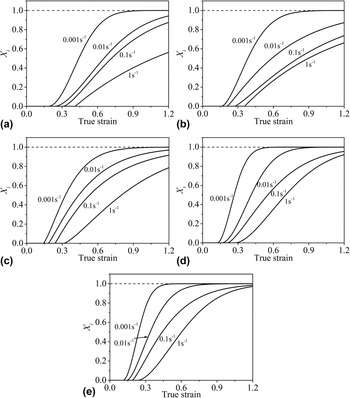
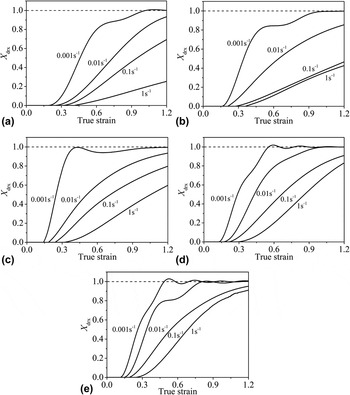
Figure 5 shows the variations of the predicted DRX volume fraction with true strain at the tested conditions. The DRX volume fraction is greatly affected by strain rate, deformation temperature, and true strain. At low strain rate or high deformation temperature, the critical strain for initiating DRX is relatively small. The complete DRX is easy to occur. From Eqs. (14)–(17), it is found that the critical dislocation density depends on strain rate and deformation temperature. The grain boundary mobility (M bm) and dislocation mean free path (L) increase with the increase of deformation temperature, which decreases critical dislocation density. Also, critical dislocation density can be determined by the exponential function of strain rate at a preset tested condition. The decrease in strain rate can reduce the critical dislocation density. Meanwhile, the low strain rate provides a long deformation course, which benefits to the progress of DRX. Therefore, the DRX degree at low strain rate or high deformation temperature is higher than that at high strain rate or low deformation temperature.
Curves of DRX kinetics [predicted by the improved Avrami model, Eq. (10)] under deformation temperatures of: (a) 920 °C; (b) 950 °C; (c) 980 °C; (d) 1010 °C; (e) 1040 °C.

Laasraoui and Jonas
Reference Laasraoui and Jonas65
also proposed a method to evaluate DRX volume fraction (X
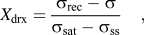
drx). As shown in Fig. 2, firstly, it is assumed that DRX is unavailable and DRV is the major dynamic softening mechanism. With the further straining, the flow stress (σrec) increases gradually due to the WH effect. Once the balance between WH and DRV is obtained, the saturation stress (σsat) appears. Then, the DRX takes place when the critical strain (
 $\varepsilon _{\rm{c}}^{\rm{p}}$
) is reached. With the increase of strain, the flow stress (σ) gradually decreases to a steady state (σss). Meanwhile, the balance between WH, DRV, and DRX is obtained. Then, the DRX volume fraction (X
drx) is expressed as,
 $${X_{{\rm{drx}}}} = {{{\sigma _{{\rm{rec}}}} - \sigma } \over {{\sigma _{{\rm{sat}}}} - {\sigma _{{\rm{ss}}}}}}\quad ,$$
where σrec is the DRV stress when DRV is main dynamic softening mechanism. It can be calculated by Eqs. (1), (2) and (24). σ is the predicted stress, σsat is the saturation stress owing to the balance between WH and DRV, σss is the steady stress when the balance between WH, DRV, and DRX is obtained.
The DRV stress (σrec) also is computed by the improved dislocation density theory, if the DRV is considered while the DRX is ignored. When the balance between WH and DRV is obtained,
 ${\dot \rho _{{\rm{i}}\left( {{\rm{rec}}} \right)}} = 0$
. Combining Eqs. (2), (3) and (24), the saturation stress (σsat) can be expressed as,
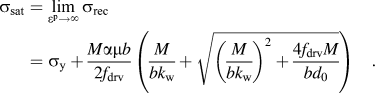 $${\sigma _{{\rm{sat}}}} = \mathop {\lim }\limits_{{\varepsilon ^{\rm{p}}} \to \infty } {\sigma _{{\rm{rec}}}} = {\sigma _{\rm{y}}} + {{M\alpha \mu b} \over {2{f_{{\rm{drv}}}}}}\left( {{M \over {b{k_{\rm{w}}}}} + \sqrt {{{\left( {{M \over {b{k_{\rm{w}}}}}} \right)}^2} + {{4{f_{{\rm{drv}}}}M} \over {b{d_0}}}} } \right)\quad .$$
By the similar algorithm, the steady state (σss) can be assumed to be the balance between the WH, DRV, and DRX.
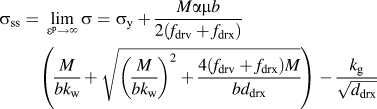 $${\sigma _{{\rm{ss}}}} = \;\mathop {\lim }\limits_{{{\rm{\varepsilon }}^{\rm{p}}} \to \infty } \sigma = {\sigma _{\rm{y}}} + {{M\alpha \mu b} \over {2\left( {{f_{{\rm{drv}}}} + {f_{{\rm{drx}}}}} \right)}}\left( {{M \over {b{k_{\rm{w}}}}} + \sqrt {{{\left( {{M \over {b{k_{\rm{w}}}}}} \right)}^2} + {{4\left( {{f_{{\rm{drv}}}} + {f_{{\rm{drx}}}}} \right)M} \over {b{d_{{\rm{drx}}}}}}} } \right) - {{{k_{\rm{g}}}} \over {\sqrt {{d_{{\rm{drx}}}}} }}$$
So, based on the improved dislocation density theory, the Laasraoui–Jonas model can be improved, and the DRX kinetics can also be obtained. Figure 6 shows the DRX kinetics curves at the tested conditions. It can be found that the variation tend of the DRX kinetics curves based on the improved Laasraoui–Jonas model are similar to that of the improved Avrami model. The stored energy caused by hot deformation is the major driving force for DRX. With the further straining, the stored energy for DRX gradually increases, which promotes the progress of DRX. The stored energy is mainly reserved in dislocations. In other words, dislocation density represents the level of stored energy. Reference Derby69 As the flow stress reaches to the stabilization, the dislocation density also almost achieves a constant value. Therefore, the DRX proceeds slowly with the further straining. As shown in Figs. 6(d) and 6(e), the curves of DRX kinetics fluctuate with strain when the DRX is nearly completed at 0.001 s−1 (deformation temperatures are 1010 and 1040 °C). The main reason is that the discontinuous DRX is a repeating process of strain-free grains nucleating, growing, deforming, and newly recrystallized nuclei forming. Reference Henshall, Kassner and McQueen70
Curves of DRX kinetics [predicted by the improved Laasraoui–Jonas model, Eq. (32)] under deformation temperatures of: (a) 920 °C; (b) 950 °C; (c) 980 °C; (d) 1010 °C; (e) 1040 °C.

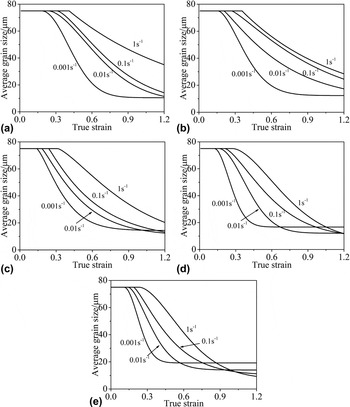
Figure 7 shows that average grain size varies with true strain at the tested conditions. In the improved dislocation density theory, the average grain size is assumed as a constant of 75 μm in the WH–DRV period. When DRX proceeds, the average grain size decreases gradually. At low strain rate and high deformation temperature, the DRX proceeds quickly (as shown in Figs. 5 and 6), and the average grain size easily reaches a steady state. However, due to the incompleted DRX at high strain rate and low deformation temperature, the average grain size decreases continuously. From Fig. 7, it also is detected that decreasing deformation temperature or increasing strain rate will lead to the decrease of average grain size under full DRX condition.
Grain size evolution under deformation temperatures of: (a) 920 °C; (b) 950 °C; (c) 980 °C; (d) 1010 °C; (e) 1040 °C.

To assess the improved Avrami and Laasraoui–Jonas models, and the grain size evolution model, the microstructure at the tested conditions is observed and quantitatively analyzed. Here, the evaluation is only made at the true strain of 1.2. Figure 8 shows the deformed microstructures at the tested conditions. At the low deformation temperature, numerous grains are elongated and have obvious orientation distribution along the compression direction. Only few small DRX grains appear in the grain boundary, and the necklace structure appears. With decreasing strain rate or increasing deformation temperature, DRX volume fraction and DRX grain size increase. At high deformation temperature, the complete DRX occurs, and the deformed structure mainly contains fine equiaxed grains. It is easily found that the variation trends of DRX volume fraction/average grain size with strain rate/deformation temperature well coincide with those predicted by the improved Avrami and Laasraoui–Jonas models.
Optical microstructure of the studied superalloy under: (a) 920 °C–0.001 s−1; (b) 920 °C–0.01 s−1; (c) 920 °C–0.1 s−1; (d) 920 °C–1 s−1; (e) 950 °C–0.001 s−1; (f) 950 °C–0.01 s−1; (g) 950 °C–0.1 s−1; (h) 950 °C–1 s−1; (i) 980 °C–0.001 s−1; (j) 980 °C–0.01 s−1; (k) 980 °C–0.1 s−1; (l) 980 °C–1 s−1; (m) 1010 °C–0.001 s−1; (n) 1010 °C–0.01 s−1; (o) 1010 °C–0.1 s−1; (p) 1010 °C–1 s−1; (q) 1040 °C–0.001 s−1; (r) 1040 °C–0.01 s−1; (s) 1040 °C–0.1 s−1; (t) 1040 °C–1 s−1.

The correlation coefficient (R) between the measured and predicted values is computed to assess the predictive ability of the two DRX kinetics models and the grain size evolution model.
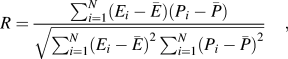 $$R = {{\sum\nolimits_{i = 1}^N \!{\left( {{E_i} - \bar E} \right)\left( {{P_i} - \bar P} \right)} } \over {\sqrt {\sum\nolimits_{i = 1}^N \!{{{\left( {{E_i} - \bar E} \right)}^2}\sum\nolimits_{i = 1}^N \!{{{\left( {{P_i} - \bar P} \right)}^2}} } } }}\quad ,$$
where N is the number of samples. E
i
is the measured values, and
 $\bar E$
is the mean value of E
i
. P
i
is the predicted values, and
 $\bar P$
is the mean value of P
i
.
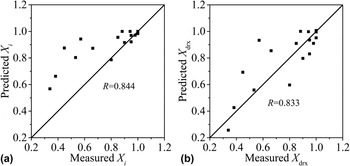
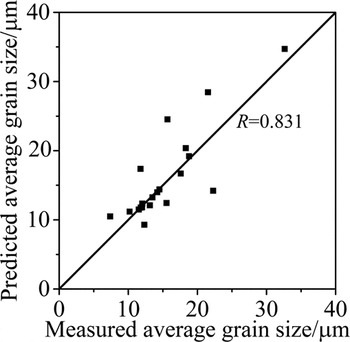
Figure 9 shows the measured and predicted DRX volume fractions by the two improved DRX kinetics models, i.e., Avrami and Laasraoui–Jonas models. The correlation coefficients for the improved Avrami and Laasraoui–Jonas models are 0.844 and 0.833, respectively. From Fig. 8, it is easily detected the low DRX volume fraction at high strain rates (1–0.01 s−1) and low deformation temperatures (920 and 950 °C). However, the predicted DRX volume fractions are relatively high for the improved Avrami model (Fig. 9). Therefore, the improved Avrami model is suitable for the low strain rate and high deformation temperature. Figure 10 shows the comparisons between the measured and predicted average grain sizes at true strain of 1.2. The correlation coefficient is 0.831. The relatively high correlation coefficient indicates an excellent capability of the improved dislocation density theory to describe the DRX and grain size evolution.
Comparisons between the measured and predicted DRX volume fractions by: (a) the improved Avrami model; (b) the improved Laasraoui–Jonas model (under the true strain of 1.2).

Comparisons between the measured and predicted average grain sizes (under the true strain of 1.2).

VIII. CONCLUSIONS
The hot deformation behavior is investigated for a typical Ni-based superalloy over different strain rates and deformation temperatures. Taking into account the impacts of WH, DRV, and DRX on hot deformation behaviors, the DRX mechanism is introduced into the dislocation density theory. The synthetical impacts of fine recrystallized grains on WH and dynamic softening are well considered. The proposed dislocation annihilation item accurately describes the dislocation density evolution caused by DRX. The improved Avrami and Laasraoui–Jonas DRX kinetics models and grain size evolution models are also developed based on the improved dislocation density theory. During solution procedure for material parameters, the impacts of the DRX volume fractions and grain size evolution on the dislocation density and flow stress are considered in every strain increment. The deformed microstructures are observed and quantitatively analyzed to validate the accuracy of the improved dislocation density theory. The comparisons between the experimental and predicted results manifest that the improved dislocation density-based models can precisely characterize the hot deformation behaviors for the studied superalloy.
ACKNOWLEDGMENTS
This work was supported by the National Natural Science Foundation Council of China (Grant Nos. 51375502, 51305466), the National Key Basic Research Program (Grant No. 2013CB035801), the Project of Innovation-driven Plan in Central South University (Grant No. 2016CX008), and the Natural Science Foundation for Distinguished Young Scholars of Hunan Province (Grant No. 2016JJ1017).