Implications
Livestock production has a major impact on the environment, which can be reduced by feeding co-products. Rapeseed meal (a co-product from biodiesel production) has been increasingly replacing soybean meal in pig feed. This may reduce the environmental impact of pig production. Results of this study show that replacing soybean meal with rapeseed meal reduces land use up to 12%. However, it only marginally decreases global warming potential (up to 1% to 3%, depending on whether or not emissions related to land use change are included) and energy use (up to 2%).
Introduction
Livestock production causes severe environmental pressure via emissions to air, water and soil (Steinfeld et al., Reference Steinfeld, Gerber, Wassenaar, Castel, Rosales and De Haan2006). The livestock sector is responsible for about 15% of the total anthropogenic emissions of greenhouse gases (Gerber et al., Reference Gerber, Steinfeld, Henderson, Mottet, Opio, Dijkman, Falcucci and Tempio2013), which are mostly related to the production and utilization of feed (De Vries and De Boer, Reference De Vries and De Boer2010). The livestock sector also increasingly competes for scarce resources such as land, water and fossil energy (Steinfeld et al., Reference Steinfeld, Gerber, Wassenaar, Castel, Rosales and De Haan2006; De Vries and De Boer, Reference De Vries and De Boer2010). The challenge is to reduce emissions and to increase efficient use of resources. Feeding co-products from arable production or the human food processing industry to livestock may lower the environmental impact (Elferink et al., Reference Elferink, Nonhebel and Moll2008). Co-products from biodiesel production, such as rapeseed meal (RSM), became increasingly available during the last decade in Europe (Makkar et al., Reference Makkar, Cooper, Weber, Lywood and Pinkney2012). Consequently, the RSM content of livestock diets increased (Vellinga et al., Reference Vellinga, Van Laar, Thomassen, De Boer, Berkhout and Aiking2009). In 1994, the RSM content of livestock diets in the Netherlands was 2% for dairy cows and 5% for poultry and pigs, whereas in 2007 it increased to 3% for dairy cows, 7% for poultry and 12% for pigs (Vellinga et al., Reference Vellinga, Van Laar, Thomassen, De Boer, Berkhout and Aiking2009). RSM is a protein-rich feed ingredient and can replace other protein-rich ingredients such as soybean meal (SBM) (Thamsiriroj and Murphy, Reference Thamsiriroj and Murphy2010, Reinhard and Zah, Reference Reinhard and Zah2011). Cultivation of SBM has a high environmental impact, partly due to large transport distances, its high economic value when based on economic allocation (Cederberg and Flysjo, Reference Cederberg and Flysjo2004; Van der Werf et al., Reference Van der Werf, Petit and Sanders2005; Vellinga et al., Reference Vellinga, Van Laar, Thomassen, De Boer, Berkhout and Aiking2009) and due to emissions related to land use change (LUC) such as deforestation in South America (Foley et al., Reference Foley, Asner, Costa, Coe, DeFries, Gibbs, Howard, Olson, Patz, Ramankutty and Snyder2007; Prudêncio da Silva et al., Reference Prudêncio da Silva, Van der Werf, Spies and Soares2010). Due to its high environmental impact, it is expected that replacing SBM with RSM will lead to a decrease in the environmental impact.
This study, therefore, aims to assess the environmental impact of replacing SBM with RSM in finishing pig diets in Europe. We focused especially on finishing pigs as they use about 60% of the total feed in the pig production chain. As RSM has lower nutritional values than SBM – that is, lower CP and essential amino acid contents – and a lower net energy value, replacing SBM with RSM changes the nutritional value of the diet and/or affects feed intake and growth performance of finishing pigs. Scenarios with different diet compositions and nutritional levels were used to assess the environmental impact of replacing SBM with RSM. This study focused on pigs, as for this species no studies about the substitution of SBM with RSM are available so far, although the largest increase in the use of RSM has occurred for this species. A life-cycle assessment (LCA) was performed for all the four scenarios, regarding greenhouse gas (GHG) emissions, land use (LU) and energy use (EU).
Material and methods
Scenario definition
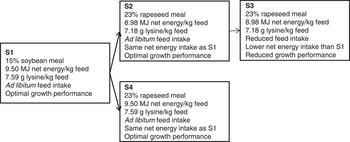
Four scenarios were developed, a reference scenario (S1) with SBM and three alternative scenarios (S2, S3, S4) in which SBM was replaced with RSM (Figure 1). S1 was based on Dutch average standards of diets for finishing pigs, and contained 15% SBM, 9.50 MJ net energy (NE) and 7.59 g standard ileal digestible lysine (SID LYS) per kg of feed while pigs were fed ad libitum (Vellinga et al., Reference Vellinga, Van Laar, Thomassen, De Boer, Berkhout and Aiking2009; Agency for feed value tables, 2010 (CVB); Van der Peet Schwering et al., Reference Van der Peet-Schwering, Straathof, Binnendijk and Van Diepen2012). Definition of S2, S3 and S4 contained three steps. First, we determined how much RSM is needed to replace SBM (identical for S2, S3 and S4). Second, we described routes chosen in S2, S3 and S4 to handle differences in nutritional levels of diets resulting from the difference in nutritional value between SBM and RSM. Third, the final diet was formulated using an optimisation method, taking into account constrains formulated during the first and second step.
The four scenarios of replacing soybean meal (SBM) by rapeseed meal (RSM) in diets of finishing pigs. Scenario 1 (S1) contains SBM, which is replaced by RSM in scenarios S2, S3 and S4. In S2, the same daily net energy intake as in S1 is realized by an increased feed intake. In S3, the same daily feed intake as in S1 and lower net energy intake is realized. In S4, the diet is optimized to contain the same net energy and lysine content as in S1.

Step one
In this step, 15% SBM and 8% barley were replaced with 23% RSM based on their CP content. The replacement rate was obtained as follows: S1 contains 15% SBM, which equals 70 g CP, using a CP content of SBM of 464 g/kg (CVB, 2010). To replace 70 g of CP from SBM, we need 208 g RSM with a CP content of 335 g/kg (CVB, 2010). In short, 150 g of SBM was replaced with 208 g of RSM per kg feed, implying a reduction of 58 g of other feed ingredients and their associated CP content. We assumed this to be 58 g of barley, with a CP content of 104 g/kg. This again resulted in a loss of CP from barley, and, therefore, fine-tuning this exchange could continue eternally. Finally, therefore, the reference diet should contain a minimum of 15% SBM and 8% barley (70 g CP from SBM and 8 g CP from barley), which was assumed to be replaced with a minimum of 23% (77 g CP) of RSM in the diets of the three scenarios.
Step two
This step involved handling changes in the nutritional levels of diets (Figure 1). Due to the differences in nutritional value between SBM and RSM, replacing SBM with RSM based on CP affected the NE content and amino acid content of the diet. Losses in NE can be compensated by adding fat, whereas losses in amino acids can be compensated by adding industrial amino acids as is usually done in practice. Mosnier et al. (Reference Mosnier, Van der Werf, Boissy and Dourmad2011) and Meul et al. (Reference Meul, Ginneberge, Van Middelaar, De Boer, Fremaut and Haesaert2012), however, found a high carbon footprint of synthetic amino acids (SAA) due to the energy-intensive production process. On the other hand, Garcia-Launay et al. (Reference Garcia-Launay, Van der Werf, Nguyen, Le Tutour and Dourmad2014) concluded that using SAA reduced the carbon footprint of pig production. Therefore, we have chosen different routes to handle the differences in the nutritional level of the diet. In S2, we did not compensate for the loss in nutrient density of the diet. Therefore, the nutritional value per kg feed was reduced to 8.98 MJ NE and 7.18 g SID LYS, and thus an increased feed intake was required to realize the same growth performance. However, if a diet contains less than ~9 MJ NE per kg feed, pigs might not be able to increase their feed intake, resulting in a decreased NE intake per day (Quiniou and Noblet, Reference Quiniou and Noblet2012). In S3 (identical to S2), we, therefore, assumed that pigs were not able to increase their feed intake, leading to reduced growth performance. In scenario 4 (S4), the energy and amino acid contents were increased to the same level as S1. In each scenario, the amount of SID LYS was related to NE, using a minimum of 0.8 g SID LYS per MJ of NE (CVB, 2010).
Step three
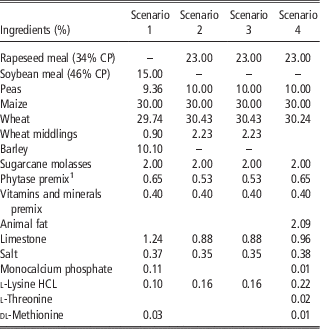
In this step, the final diet composition was determined. Diets in S1, S2, S3 and S4 were formulated using a commercial linear programming tool (i.e. Bestmix®, Adifo, Maldegem, Belgium), which optimizes a diet by minimizing the cost price of the diet (Table 1). In the supporting information, the precise nutritional value of each diet is described (Supplementary Table S1). The price of the ingredients was based on the average of a pricelist published quarterly in 2012 (Nuscience, 2012). Diets had to meet requirements for SID methionine and cystine 62%, threonine 65% and tryptophan 20% relative to SID lysine (CVB, 2010). Furthermore, dietary restrictions were applied based on regular Dutch practice in finishing pig production: a diet could contain maximum 30% maize, 40% wheat, 40% barley, 10% peas, 2% molasses, 500 FTU phytase per kg and should contain 0.4% premix to provide minerals and vitamins.
Diet composition of the scenarios in which soybean meal is replaced with rapeseed meal at equal dietary protein content

1500 FTU phytase per kg.
Growth performance
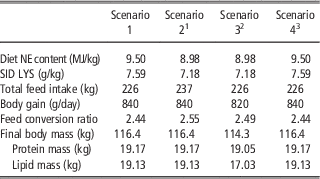
To analyze the impact of each scenario on growth performance of pigs, the model ‘INRAporc’ (Van Milgen et al., Reference Van Milgen, Valancogne, Dubois, Dourmad, Sève and Noblet2008) was used. This model simulates how nutrients are used for protein deposition (PD) and lipid deposition (LD), as well as for supporting other functions (i.e. maintenance, physical activities and PD costs). Potential PD, energy supply (NE intake) and amino acid supply are driving forces that determine the rate of PD and LD. Potential PD is defined as the PD when the animal is capable of expressing its full growth potential under ad libitum feeding. To define the parameters used in INRAporc, we characterized growing–finishing pigs based on data from Van der Peet-Schwering et al. (Reference Van der Peet-Schwering, Straathof, Binnendijk and Van Diepen2012). Pig characterization in INRAporc was best represented by means of late maturing gilts. The following input parameters were used: age at start 70 days, weight at start 23.6 kg, final age 180 days, precocity of 0.0135 per day and a mean PD of 122 g per day. Feed intake was calculated as Y=a*X^b, where factor a equals 2.428 and factor b equals 0.497. Factor a and b were based on a feed intake of 17 MJ NE at 50 kg and 24 MJ NE at 100 kg (Van der Peet-Schwering et al., Reference Van der Peet-Schwering, Straathof, Binnendijk and Van Diepen2012). Until gilts reached a weight of 50 kg BW, starter feed was used, including 9.68 MJ NE and 9.48 g SID LYS. Above 50 kg BW, the four scenarios were implemented. Feed intake and growth performance per scenario are presented in Table 2.
Impact of replacement of soybean meal (scenario 1) with rapeseed meal (scenario 2, 3 and 4) on growth performance of gilts from 24 kg BW simulated with INRAporc

NE=net energy; SID LYS=standard ileal digestible lysine.
1 The same daily net energy intake as in S1 is realized by an increased feed intake, resulting in a similar growth performance.
2 The same daily feed intake as in S1 and lower net energy intake is realized, resulting in a decreased growth performance.
3 The diet is formulated to contain the same net energy and lysine content as in S1, resulting in a similar feed intake and growth performance.
Assessing the environmental impact of dietary scenarios
To assess the environmental impact for each scenario, an LCA was used. LCA is an internationally standardized holistic method to evaluate the environmental impact during the entire production chain (Guinée et al., Reference Guinée, Gorrée, Heijungs, Huppes, Kleijn, De Koning, Van Oers, Wegener Sleeswijk, Suh, Udo De Haes, De Bruijn, Van Duin, Huijbregts, Lindeijer, Roorda, Van der Ven and Weidema2002; Bauman and Tillman, Reference Bauman and Tillman2004). During the life cycle of an animal, two types of environmental impacts are considered: use of resources such as land or fossil fuels and emissions of pollutants (Guinée et al., Reference Guinée, Gorrée, Heijungs, Huppes, Kleijn, De Koning, Van Oers, Wegener Sleeswijk, Suh, Udo De Haes, De Bruijn, Van Duin, Huijbregts, Lindeijer, Roorda, Van der Ven and Weidema2002). We assessed GHG emissions, EU and LU. Emission of GHGs, EU and LU were chosen as examples, as the livestock sector contributes significantly to both climate change and LU worldwide (Steinfeld et al., Reference Steinfeld, Gerber, Wassenaar, Castel, Rosales and De Haan2006). Furthermore, EU was used as it influences GWP considerably. The following GHGs were included: carbon dioxide (CO2), methane (CH4) and nitrous oxide (N2O). These GHGs were summed up based on their equivalence weighting factors in terms of CO2 (100 years’ time horizon) – that is, 1 for CO2, 25 for CH4 and 298 for N2O (Forster et al., Reference Forster, Ramaswamy, Artaxo, Berntsen, Betts, Fahey, Haywood, Lean, Lowe, Myhre, Nganga, Prinn, Raga, Schulz and Van Dorland2007). LU was expressed in m2.year/kg BW, and EU was expressed in MJ per kg of BW. Besides expressing the environmental impact per kg of BW, we assessed the impact per kg of protein, as livestock products contribute especially to the protein demand of humans (De Vries and De Boer, Reference De Vries and De Boer2010). In case of a multifunctional process (e.g. production of soybean oil and meal), economic allocation was used, which is the partitioning of environmental impacts between co-products based on the relative economic value of the outputs (Guinée et al., Reference Guinée, Gorrée, Heijungs, Huppes, Kleijn, De Koning, Van Oers, Wegener Sleeswijk, Suh, Udo De Haes, De Bruijn, Van Duin, Huijbregts, Lindeijer, Roorda, Van der Ven and Weidema2002). Economic allocation is used most commonly in LCA studies of livestock products (De Vries and De Boer, Reference De Vries and De Boer2010).
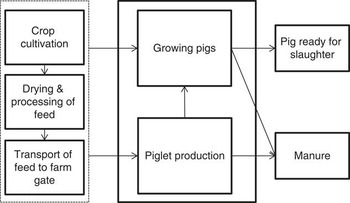
Environmental impacts of the following processes in the pig chain were considered and are explained below: piglet production (rearing), feed production, manure management, pig housing and enteric fermentation in pigs (Figure 2).
Production chain of finishing pigs.

Environmental impact related to piglet production. Piglet production is defined as the sum of rearing gilts and sows and their piglets that are needed for the production of finishing pigs (70 days of age, 23.6 kg). In the Netherlands, a sow produces on average 29 weaned piglets per year (Agrovision, 2012). The mortality rate of weaned piglets is 2.2%, whereas the replacement rate of sows is 45%. To replace one culled sow annually, we need 0.49 gilts (including death rate).
Environmental impact related to feed production. GWP, EU and LU related to feed production were based on the study by Vellinga et al. (Reference Vellinga, Blonk, Marinussen, Van Zeist and De Boer2013). Production of feed ingredients included impacts from cultivation (e.g. fertilizers, pesticides, machinery, energy, direct and indirect N2O emissions and CO2 emissions from liming and urea fertilization), impacts from drying/processing and impacts from transport to the farm. Emissions from LUC were excluded. In the supporting information, the environmental impact per kg feed ingredient/diet are described and the diet composition for piglets, gilts and sows is listed (Supplementary Table S2, S3, S4 and S5).
Environmental impact related to manure management. Handling and storage of manure cause emissions of CH4 and N2O. For CH4, a 2-tier approach was used based on country-specific data of Coenen et al. (Reference Coenen, Van der Maas, Zijlema, Arets, Baas, Van den Berghe, Te Biesebeek, Brandt, Geilenkirchen, Van der Hoek, Te Molder, Dröge, Montfoort, Peek and Vonk2013) and Intergovernmental Panel on Climate Change (IPCC, 2006) default values. Direct N2O emissions and indirect N2O emissions were computed using a 2-tier approach based on country-specific data of Coenen et al. (Reference Coenen, Van der Maas, Zijlema, Arets, Baas, Van den Berghe, Te Biesebeek, Brandt, Geilenkirchen, Van der Hoek, Te Molder, Dröge, Montfoort, Peek and Vonk2013) and IPCC default values (IPCC, 2006). For detailed calculations on manure emission, please see Supplementary Table S6.
Environmental impact related to pig housing. The environmental impact related to housing was 62 kg CO2− eq, 689 MJ and 12.6 m2 per finishing pig place per year (EcoinventCentre, 2007). For piglets, gilts and sows, we compensated for the difference in m2 used per animal place in comparison with the m2 used per finishing pig place, based on Dutch regulations (Staatsblad, 2014).
Environmental impact related to enteric fermentation. Enteric methane emission from pigs was calculated using an emission factor of 1.5 kg CH4 per pig per year (IPCC, 2006).
Sensitivity analysis
Methodological choices in LCA studies can have a significant impact on the results. We, therefore, performed a sensitivity analysis to evaluate the robustness of our results. According to the literature, production of feed and manure management explain the majority of GWP, EU and LU along the life-cycle of finishing pigs (Basset-Mens and Van der Werf, Reference Basset-Mens and Van der Werf2005; Dalgaard et al., Reference Dalgaard, Halberg and Hermansen2007); therefore, we focused on those processes. The GHGs from feed production are merely determined by emissions from LUC (Meul et al., Reference Meul, Ginneberge, Van Middelaar, De Boer, Fremaut and Haesaert2012; Van Middelaar et al., Reference Van Middelaar, Cederberg, Vellinga, Van der Werf and De Boer2013) and the feed conversion ratio (kg feed intake/kg growth of pigs), which is partly determined by pig characterization in INRAporc. For the sensitivity analysis, we, therefore, explored the impact of including LUC emissions, changed the parameters to characterize pig growth and used a different method to calculate emissions from manure management.
Emissions from LUC
LUC relates to the conversion of land (forest or shrubland) into cropland used for feed production. Calculation methods for LUC emissions show high uncertainty and variability (Meul et al., Reference Meul, Ginneberge, Van Middelaar, De Boer, Fremaut and Haesaert2012; Van Middelaar et al., Reference Van Middelaar, Cederberg, Vellinga, Van der Werf and De Boer2013). We, therefore, used two methods: one related to direct LUC and one related to indirect LUC. The first method focused on direct LUC, and attributes the conversion of land in a specific country or region directly to one or more feed ingredients (Jungbluth et al., Reference Jungbluth, Chudacoff, Dauriat, Dinkerl, Doka, Faist Emmenegger, Gnansounou, Kljun, Schleiss, Spielmann, Stettler and Sutter2007; Prudêncio da Silva et al., Reference Prudêncio da Silva, Van der Werf, Spies and Soares2010). Soybeans and palm kernel were the only ingredients related to direct LUC. SBM was included in the diets of finishing pig, sows, gilts and piglets; heat-treated soybeans were included in piglet diets; soybean hulls were included in sow diets; and palm kernel expeller was included in sow diets. We assumed that all soy came from Brazil. Soy from South Brazil does not contribute to LUC, and 70% was cultivated in central West Brazil (Prudêncio da Silva et al., Reference Prudêncio da Silva, Van der Werf, Spies and Soares2010). From Central West Brazil, 1% of the soy was assumed to contribute to deforestation of tropical forest and 3.4% to conversion of shrubland (Prudêncio da Silva et al., Reference Prudêncio da Silva, Van der Werf, Spies and Soares2010). For palm kernel expeller from Malaysia, 100% was assumed to contribute to deforestation of tropical forest (Jungbluth et al., Reference Jungbluth, Chudacoff, Dauriat, Dinkerl, Doka, Faist Emmenegger, Gnansounou, Kljun, Schleiss, Spielmann, Stettler and Sutter2007). Emissions for soy were 825 t CO2− eq per ha of tropical forest and 297 t CO2− eq per ha of shrubland and for palm kernel expeller 497 t CO2− eq per ha (Van Middelaar et al. Reference Van Middelaar, Cederberg, Vellinga, Van der Werf and De Boer2013). An amortization period of 20 years was used. Per kg of SBM, LUC emissions were 0.205 g CO2− eq in addition to 0.652 g CO2− eq per kg of SBM; per kg of heat-treated soybeans, LUC emissions were 0.260 g CO2− eq in addition to 0.663 g CO2− eq per kg of heat-treated soybeans; per kg of soybean hulls, LUC emissions were 0.109 g CO2− eq in addition to 0.373 g CO2− eq per kg of soybean hulls; and per kg of palm kernel expeller, LUC emissions were 0.370 g CO2− eq in addition to 0.547 g CO2− eq per kg of palm kernel expeller. The second method focused on indirect land use. Audsley et al. (Reference Audsley, Brander, Chatterton, Murphy-Bokern, Webster and Williams2009) state that every ha of land used for commercial production is responsible for total worldwide LUC, because food and feed markets are globally interconnected. Thus, total GHG emissions from deforestation at world level in 2004 were divided by the total amount of agricultural land, resulting in one emission factor of 1.43 t CO2− eq per ha of land.
Characterization of finishing pigs
The parameters used in INRAporc to characterize pigs, such as the mean PD, influence the feed conversion ratio. Thus, the feed conversion ratio affects the environmental impact. In the sensitivity analysis, we varied these characterization parameters in order to test whether the results between scenarios changed. We based the parameter characterization for the sensitivity analysis on two examples described by Van Milgen et al. (Reference Van Milgen, Valancogne, Dubois, Dourmad, Sève and Noblet2008). The two examples were chosen as pigs largely differed in their characterization parameters, and therefore difference in growth and feed intake were expected. The following input parameters were used: precocity for example one was 0.01 and 0.025 for example two, and mean PD was 113 g per day for example one and 179 for example two. Factor a was 1.720 for example one and 2.695 for example two, and factor b was 0.606 for example one and 0.577 for example two.
Emissions from manure management
Emissions from manure management were calculated using IPCC default values and average country data. The amount of N excreted by pigs or emission of CH4 from manure might, however, differ between scenarios, because of differences in diet composition. To analyze a possible impact of diet composition on manure emissions, we calculated N excretion and CH4 excretion more precisely per scenario.
N excretion in manure originates from indigestible CP in feed ingredients excreted via feces and the digested CP excreted via urine (urea and uric acid). N excretion depends on the N intake in feed (feed intake multiplied by the CP of the feed) minus the N retention in the animal. The N retention of the animal is determined by the PD from the INRAporc model.
To calculate CH4 production, a mathematical model (MESPRO) was used (Aarnink et al., Reference Aarnink, Van Ouwerkerk and Verstegen1992). This model quantifies the influence of different diet compositions, feed and water intake on the manure composition of finishing pigs. CH4 (biogas) production results from anaerobic digestion of manure. Pig diet composition, feed and water intake can lead to changes in organic matter of the manure, thus influencing biogas production.
Results
Global warming potential
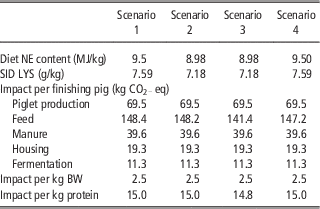
Results expressed per kg BW showed that replacing SBM with RSM marginally reduced GWP, less than 1% (Table 3). When expressed as per kg of body protein, a reduction of 2% was found in S3 compared with S1. This reduction in S3 was due to an increase in protein-to-lipid ratio of the pig (relatively high protein content v. lipid content). For S1, S2 and S4, the ratio between protein and lipid content were similar, and therefore did not lead to different results compared with the results expressed per kg BW. Feed production for the finishing pigs had the largest contribution in all scenarios (50% to 52%), followed by feed production for piglet production (17% to 18%), manure of finishing pigs (14%), housing of finishing pigs (7%), housing related to piglet production (4%), enteric fermentation from finishing pigs (4%), manure from piglet production (2%) and enteric fermentation related to piglet production (1%).
Impact on GWP (kg CO2− eq) of replacing SBM (S1) with RSM and based on different diet compositions and nutritional levels (S2, S3, S4)

GWP=global warming potential; SBM=soybean meal; RSM=rapeseed meal; NE=net energy; SID LYS=standard ileal digestible lysine.
The impact per finishing pig is shown for each production process (e.g. feed). Moreover, the total impact is expressed per kg BW and body protein.
Energy use
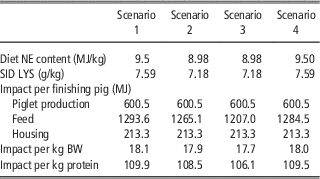
Results expressed per kg BW showed that replacing SBM with RSM decreased EU by 1.4% for S2, 2.3% for S3 and 0.4% for S4 (Table 4). When expressed as per kg of body protein, again only S3 showed a reduction of 3% EU compared with S1 (due to the different protein-to-lipid ratio of S3). For all the scenarios, feed production for finishing pigs had the largest impact on EU (60% to 61%), followed by feed production related to piglet production (23%), the housing of finishing pigs (10%) and housing related to piglet production (6%).
Impact on energy use (MJ) of replacing SBM (S1) with RSM and based on different diet compositions and nutritional levels (S2, S3, S4)

SBM=soybean meal; RSM=rapeseed meal; NE=net energy; SID LYS=standard ileal digestible lysine.
The impact per finishing pig is shown for each production process (e.g. feed). Moreover, the total impact is expressed per kg BW and protein.
Land use
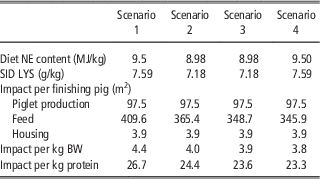
Results expressed per kg BW showed that replacing SBM with RSM decreased LU by 8.6% for S2, 10.3% for S3 and 12.5% for S4 (Table 5). When expressed as per kg of protein, again only S3 showed a reduction of 11% LU compared with S1 (due to the different protein-to-lipid ratio of S3). For all the scenarios, feed production for finishing pigs had the largest impact on LU (77% to 80%), followed by production of feed related to piglet production (19% to 21%), the housing of finishing pigs (1%) and housing related to piglet production (<1%).
Impact on land use (LU, in m2) of replacing SBM (S1) with RSM and based on different diet compositions and nutritional levels (S2, S3 and S4)

SBM=soybean meal; RSM=rapeseed meal; NE=net energy; SID LYS=standard ileal digestible lysine.
Sensitivity analysis
Impact of emissions from LUC
Replacing SBM with RSM, while accounting for direct LUC, decreased GWP per kg of BW with 2.8% for S2, 3.4% for S3 and 3.2% for S4, compared with S1. The absolute impact of GWP increased with 4% for S1, 1% for S2, 1% for S3 and 1% for S4. Replacing SBM with RSM, while accounting for indirect LUC, decreased GWP with 1.8% for S2, 2.6% for S3 and 2.9% for S4, compared with S1 per kg BW. Although differences between scenarios remained marginal, the absolute impact of the GWP increased with 25% for S1, 23% for S2, 23% for S3 and 22% for S4 per kg BW. Thus, including emissions related to LUC did not result in differences between scenarios, but the absolute value of each scenario changed. Therefore, including LUC emissions did not have an impact on the final conclusion.
Impact of pig characteristics
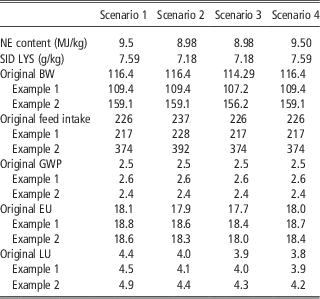
The effect of changing the pig characterization parameters marginally affected the results of GWP, EU and LU (Table 6). The largest change occurred in example two for LU. LU decreased with 0.7% for S2, 1.0% for S3 and 1.1% for S4 compared with S1 per kg BW. The absolute level of LU within each scenario, however, increased with 11.5% for S1, 10.4% for S2, 10.1% for S3 and 10.2% for S4 per kg BW due to changing pig characterization parameters. Thus, the impact of changing pig characterization parameters did not result in differences between scenarios, but the absolute value of each scenario increased. Therefore, changing pig characterization parameters did not have an impact on the final conclusion.
Impact of sensitivity analysis of characterization parameters in INRAporc on the scenarios of replacing SBM (S1) with RSM based on different diet compositions and nutritional levels (S2, S3 and S4)

SBM=soybean meal; RSM=rapeseed meal; NE=net energy; SID LYS=standard ileal digestible lysine; GWP=global warming potential.
Two sets of characterization parameters were based on Van Milgen et al. (Reference Van Milgen, Valancogne, Dubois, Dourmad, Sève and Noblet2008). For each example, the BW, feed intake and the environmental impact is given (in GWP expressed in CO2− eq, energy use (EU, in MJ) and land use (LU in m2 per year) per kg BW).
Impact of emissions from manure management
Concerning manure emissions, compared with S1, GWP increased with 0.3% for S2, whereas S3 decreased with 0.5% and S4 with 0.3% per kg of BW. The absolute impact of the GWP within scenarios decreased with 0.9% for S1, 0.6% for S2, 0.8% for S3 and 0.8% for S4 per kg BW. Thus, the impact on the original results of using a more precise method to calculate N excretion by the pig and CH4 production was relatively small between scenarios, even as the absolute impact within scenarios.
Discussion
A previous review showed a variation between 3.9 and 10 kg CO2− eq, between 18 and 45 MJ EU and between 8.9 and 12.1 m2 LU per kg edible product (De Vries and De Boer, Reference De Vries and De Boer2010). Our results are within the range of results reviewed by De Vries and De Boer (Reference De Vries and De Boer2010) (GWP between 4.64 and 4.67 kg CO2− eq, an EU between 33 and 34 MJ and a LU between 7.25 and 8.28 m2), although LU was a bit lower. Furthermore, our study supports the earlier finding that feed production causes the majority of GWP, EU and LU (Eriksson et al., Reference Eriksson, Elmquist, Stern and Nybrant2005; Dalgaard et al., Reference Dalgaard, Halberg and Hermansen2007). To gain insight into the full environmental impact of replacing SBM by RSM, and to prevent burden shifting the environmental impacts, eutrophication and acidification should be assessed as well.
To our knowledge, no other studies aimed to assess the environmental impact of replacing SBM with RSM in finishing pig diets, although some assessed the impact of replacing SBM with locally produced protein sources such as peas, lupines and rapeseed products (Eriksson et al., Reference Eriksson, Elmquist, Stern and Nybrant2005; Meul et al., Reference Meul, Ginneberge, Van Middelaar, De Boer, Fremaut and Haesaert2012; Sasu-Boakye et al., Reference Sasu-Boakye, Cederberg and Wirsenius2014). Eriksson et al. (Reference Eriksson, Elmquist, Stern and Nybrant2005) found a reduction in GWP up to 13% and in EU up to 22%. They concluded that feeding strategies have the potential to reduce environmental impacts. Sasu-Boakye et al. (Reference Sasu-Boakye, Cederberg and Wirsenius2014) found a reduction in GWP up to 4.5% and 11% for LU. Meul et al. (Reference Meul, Ginneberge, Van Middelaar, De Boer, Fremaut and Haesaert2012) found a reduction in GWP up to 3%. When accounting for emissions related to direct LUC, Meul et al. (Reference Meul, Ginneberge, Van Middelaar, De Boer, Fremaut and Haesaert2012) found a reduction in GWP up to 15%, whereas accounting for indirect LUC resulted in a reduction of only 1%.
On the other hand, our study indicates that the impact of replacing SBM with RSM is marginal and remains marginal when emissions related to direct (up to 3.4%) and indirect LUC (up to 2.9%) are included. In the first instance, our results seem to contradict the results of Eriksson et al. (Reference Eriksson, Elmquist, Stern and Nybrant2005) and Meul et al. (Reference Meul, Ginneberge, Van Middelaar, De Boer, Fremaut and Haesaert2012). Differences result from differences in impact values and system boundaries. Meul et al. (Reference Meul, Ginneberge, Van Middelaar, De Boer, Fremaut and Haesaert2012) used impact values of 0.555 kg CO2− eq and 3.06 m2 per kg SBM and 0.437 kg CO2− eq and 1.14 m2 per kg RSM. Eriksson et al. (Reference Eriksson, Elmquist, Stern and Nybrant2005) used impact values of 0.73 kg CO2− eq and 5.02 MJ per kg SBM and 0.37 kg CO2− eq and 2.39 MJ per kg RSM, whereas we used 0.652 kg CO2− eq, 3.1 m2 and 6.1 MJ per kg SBM and 0.454 kg CO2− eq, 1.2 m2 and 3.1 MJ per kg RSM. The relative high reduction found by Eriksson et al. (Reference Eriksson, Elmquist, Stern and Nybrant2005) (reduction in GWP up to 13%), for example, can be explained by the relatively high difference in CO2− eq per kg between SBM and RSM. The system boundaries used by Eriksson et al. (Reference Eriksson, Elmquist, Stern and Nybrant2005) and Meul et al. (Reference Meul, Ginneberge, Van Middelaar, De Boer, Fremaut and Haesaert2012) also differ from our study. Meul et al. (Reference Meul, Ginneberge, Van Middelaar, De Boer, Fremaut and Haesaert2012), for example, evaluated the environmental impacts of feed production only, and excluded other processes such as manure management, piglet production and pig housing. Eriksson et al. (Reference Eriksson, Elmquist, Stern and Nybrant2005) excluded the environmental impact related to piglet production and enteric fermentation. When we evaluated environmental impact of replacing SBM with RSM for the process of feed production only, GWP (excluding LUC) decreased from 0.1% to 2.9%, EU decreased from 0.7% to 5.0% and LU decreased from 10.8% to 15.6%, compared with S1. When we accounted for emissions related to direct LUC, the GWP decreased from 5% to 10%, whereas accounting for emissions of indirect LUC decreased GWP from 3% to 8%. The relative importance of replacing SBM with RSM obviously depends on the level of analysis and decreases with including chain processes other than feed production, such as piglet production, manure management and pig housing. For our study, it was essential to evaluate the environmental consequences of replacing SBM with RSM along an extended chain because scenarios evaluated affected the final BW of pigs.
We should, however, note that there are large differences in the impact of LUC between studies, due to different assumptions related to the percentage of soy expansion in central Brazil in forests and shrubland. We assumed that 1% of the soy produced in Central West Brazil comes from tropical forests and 3.4% comes from shrubland, whereas soy from South Brazil does not contribute to LUC. We based this on the study by Prudêncio da Silva et al. (Reference Prudêncio da Silva, Van der Werf, Spies and Soares2010). In the literature, however, the following assumptions were found: Van Middelaar et al. (Reference Van Middelaar, Cederberg, Vellinga, Van der Werf and De Boer2013) used the same values; Gerber et al. (Reference Gerber, Opio, Vellinga, Falcucci, Tempio, Gianni, Henderson, MacLeod, Makkar, Mottet, Robinson and Weiler2013) assumed that 100% of the soy expansion in Brazil directly occurs on forest land; Nemecek et al. (Reference Nemecek, Schnetzer and Reinhardin press) assumed that 12% of the soy produced in Central West Brazil comes from tropical forests and 38% comes from shrubland; Meul et al., (Reference Meul, Ginneberge, Van Middelaar, De Boer, Fremaut and Haesaert2012) assumed that 3% of the soy produced in Central West Brazil comes from tropical forests and 5% comes from shrubland; and Persson et al. (Reference Persson, Henders and Cederberg2014) assumed that 2% of the soy produced in Central West Brazil comes from tropical forests and 12% comes from shrubland. Moreover, based on satellite data, it has been shown that, since 2006, deforestation rates in Brazil have decreased, and that since the late 2000s the contribution of soy production to deforestation has been minimal (i.e. due to anti-deforestation measures; (Macedo et al., Reference Macedo, DeFries, Morton, Stickler, Galford and Shimabukuro2012)). Another discussion point is the amortization period (20 years) we used. Emission of soy per ha of LUC includes emissions related to the moment the land is cleared and used for another purpose and emissions related to C-sequestration. It is debatable to amortize the emission related to the clearing of the land; however, as this is mostly applied in LCA studies – for example, Van Middelaar et al. (Reference Van Middelaar, Cederberg, Vellinga, Van der Werf and De Boer2013), Meul et al. (Reference Meul, Ginneberge, Van Middelaar, De Boer, Fremaut and Haesaert2012) and Nemecek et al. (Reference Nemecek, Schnetzer and Reinhardin press) – we used an amortization period of 20 years for both emissions related to the moment the land is cleared and emissions related to C-sequestration.
Similar to the sensitivity results of LUC, changing the methodology to calculate manure emissions hardly affected the relative differences between scenarios. Sensitivity results of changing pig characterization parameters also hardly affected the relative differences between scenarios. A change in characterization parameters, however, in some cases, increased or decreased the absolute impact of all the scenarios considerably (up to 11.5% for LU). The impact of changing characterization parameters on the environmental impact can be explained by the fact that it influences the relative rate of PD and LD. PD follows a curvilinear plateau function in response to energy supply (Van Milgen et al., Reference Van Milgen, Valancogne, Dubois, Dourmad, Sève and Noblet2008). When PD attains the plateau, all the additional feed energy is used for LD, which increases linearly with energy intake. Compared with PD, however, it requires more feed to gain one kg of LD. Changing pig characterization parameters, therefore, affects the balance between PD and LD, resulting in differences in feed conversion ratio. This balance between PD and LD also explains why scenario S3 had the maximum potential to reduce the environmental impact. Besides the fact that S3 had a low environmental impact per kg of feed, the reduced feed intake changed the relative rate between PD and LD. Therefore, pigs in S3 had a higher protein-to-lipid ratio, resulting in a better feed conversion ratio compared with S1, S2 and S4. Optimizing this relative rate of protein and LD by changing genetic characterization parameters and managing feed intake, therefore, might result in an improved absolute environmental impact of pig production.
Conclusions
Results show that, expressed as per kg of BW, replacing SBM with RSM in diets of finishing pigs did not result in a different GWP or EU, whereas LU decreased up to 12%. Between scenarios, S3 had the maximum potential to reduce the environmental impact, especially when the impact was expressed as per kg of protein mass. Besides the fact that S3 had a low environmental impact per kg of feed, the reduced feed intake changed the relative rate between PD and LD. Therefore, pigs in S3 had a higher protein-to-lipid ratio, resulting in a better feed conversion ratio compared with S1, S2 and S4. Optimizing this relative rate of PD and LD by diet composition, feed allowance and genetic characterization parameters, therefore, might result in an improved absolute environmental impact of pig production. Furthermore, it was found that the impact of replacing SBM with RSM in diets of finishing pigs per kg of BW changed marginally when emissions related to direct (up to 3.4%) and indirect LUC (up to 2.9%) were included. When we evaluated the environmental impacts of feed production only, which implies excluding other processes along the chain as is generally found in the literature, GWP decreased up to 10% including LUC, EU up to 5% and LU up to 16%.
Acknowledgments
The authors thank Wageningen UR Livestock Research for funding this study. Furthermore, André Aarnink is acknowledged for his help with calculations of the manure emissions.
Supplementary Material
To view the supplementary material for this article, please visit http://dx.doi.org/10.1017/S1751731115001469