Introduction
The assessment of cognitive dysfunction associated to neurological and psychiatric disorders is a clinical challenge, particularly in populations with heterogeneous educational background. The neuropsychological assessment is a critical step in the diagnostic investigation of neurodegenerative diseases and psychiatric disorders, providing valuable markers for both diagnosis and follow-up of these patients. Recently, it has been recognized that social cognition tasks, such as identification of emotions, can critically contribute to the diagnosis of neuropsychiatric disorders (Buhl et al., Reference Buhl, Stokholm and Gade2013, Kumfor and Piguet Reference Kumfor and Piguet2013). The American Psychiatric Association (2013) has consecutively included social cognition as one of the six main cognitive domains to evaluate in the new version of the Diagnostic and Statistical Manual of Mental Disorders (2013). Different cognitive batteries were proposed to assess social cognition in clinical practice (Torralva et al., Reference Torralva, Roca, Gleichgerrcht, Bekinschtein and Manes2009; Bertoux et al., Reference Bertoux2012; Buhl et al., Reference Buhl, Stokholm and Gade2013). Among them, the short version of the Social and Emotional Assessment (Mini-SEA) has been used to evaluate social cognition in neurological and psychiatric patients (Bertoux et al., Reference Bertoux2012). It consists of a theory of mind task (a modified version of the faux-pas test) and a Facial Emotion Recognition Test (FERT) composed by a selection of 35 faces from Ekman's pictures. It has been demonstrated that this battery provides accurate diagnostic differentiation between Alzheimer's disease and behavioral-variant frontotemporal dementia (bvFTD), and between bvFTD and major depressive disorder (Bertoux et al., Reference Bertoux2012).
One of the critical points concerning the wide use of Mini-SEA or other social cognition batteries in clinical practice is the absence of large normative dataset concerning the FERT. Indeed, most studies were limited by a restricted number of participants and by experimental design (Torralva et al., Reference Torralva, Roca, Gleichgerrcht, Bekinschtein and Manes2009; Bertoux et al., Reference Bertoux2012; Buhl et al., Reference Buhl, Stokholm and Gade2013). In the particular case of Mini-SEA, another critical issue is a better understanding of how demographic factors such as age, education, and gender, as well as cultural background, may influence the performance on the FERT. As a concrete example, it has been shown that there is an age-related decline in the recognition of facial emotions, independently from basic perception abilities (Ruffman et al., Reference Ruffman, Henry, Livingstone and Phillips2008; Mill et al., Reference Mill, Allik, Realo and Valk2009; Grainger et al., Reference Grainger, Henry, Phillips, Vanman and Allen2015). The effect of age on the performance on the Mini-SEA's FERT has not been specifically investigated in a large sample of subjects.
In addition, despite some innate aspects of emotion recognition ability, the cultural background and educational level may also modulate the emotion perception (Engelmann and Pogosyan, Reference Engelmann and Pogosyan2013). Similarly, the effect of schooling and cultural environment on the FERT has not been addressed. This is a crucial aspect for designing neuropsychological tests that could be used in multi-centric studies, which often include patients with different cultural backgrounds and heterogeneous educational level.
The aim of this study was to analyze the influence of gender, age, education, and cultural background in the FERT from the mini-SEA (Bertoux et al., Reference Bertoux2012). We, therefore, analyzed the effect of these demographics and cultural variables on the FERT's performance, in a large sample of Brazilian healthy subjects with heterogeneous educational level. The effect of cultural background on the same test was investigated by comparing the performance of Brazilian and French subjects matched for gender, age and educational level. Finally, we also provide normative data for the Brazilian population.
Methods
This study was conducted by the Cognitive and Behavioral Neurology Group of the School of Medicine from the Federal University of Minas Gerais (Belo Horizonte, Brazil). The study was approved by the Local Ethics Committee and subjects provided written informed consent before participating.
Participants
The Brazilian sample consisted of healthy controls recruited from the community on a voluntary basis. All participants underwent a standardized interview focused on neurological and psychiatric antecedents. Subjects were not included in the study if they presented any of the following criteria: (1) history of neurological disorder, such as stroke, epilepsy, multiple sclerosis, or neurodegenerative diseases; (2) history of neurosurgical procedures; (3) memory or cognitive complaints; (4) history of bipolar disorder or schizophrenia; (5) score above 8 out 21 either in anxiety or depression subscales from the Hospital Anxiety and Depression Scale (Botega et al., Reference Botega, Bio, Zomignani, Garcia and Pereira1995), and (6) subjects in use of medications that may interfere in cognitive performance (e.g. benzodiazepines). All participants were also evaluated by the Mini-Mental State Examination (MMSE) (Nitrini and Caramelli, Reference Nitrini, Caramelli, Nitrini and Bacheschi2003), and we only included individuals who scored above norms adjusted for educational level. The following cut-offs were considered for the Brazilian participants: higher than or equal to 20 for illiterates, higher than or equal to 21 (for individuals with one to three years of education), higher than or equal to 24 (for subjects with four to seven years of education), and higher than or equal to 26 (for subjects with eight or more years of education) (Nitrini and Caramelli, Reference Nitrini, Caramelli, Nitrini and Bacheschi2003).
We stratified the Brazilian population into seven groups according to age as follows: Group 1 (15–20 years); Group 2 (21–30 years); Group 3 (31–40 years); Group 4 (41–50 years); Group 5 (51–60 years); Group 6 (61–70 years) and Group 7 (≥70 years).
The Brazilian sample was also stratified into four groups according to years of education as follows: Group A consisting of illiterate participants; Group B consisting of participants with 1–3 years of formal schooling; Group C formed by the participants with 4–7 years of formal schooling; Group D formed by the participants with 8–11 years of formal schooling; and Group E formed by the participants who had 12 or more years of formal schooling. Illiteracy was here defined as the inability to read the phrase “Close your eyes” from the MMSE.
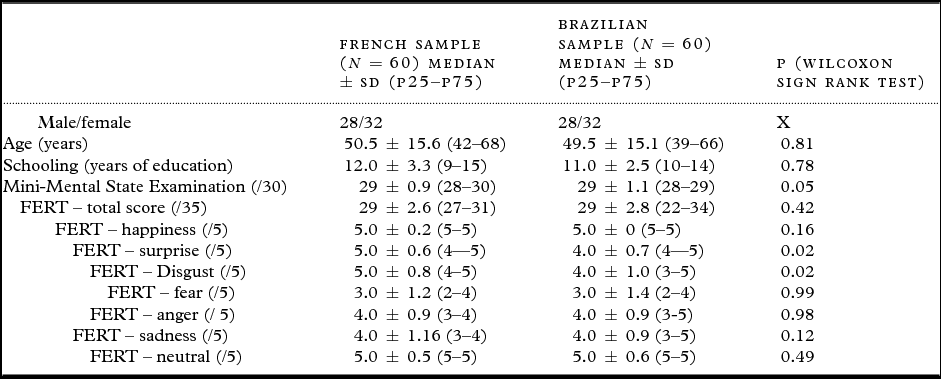
In order to investigate the possible effect of cultural background on the performance on the FERT, we compared a subgroup of Brazilian participants (n = 60) with 60 healthy French subjects (Table 4), from a previous study (Bertoux et al., Reference Bertoux, de Souza, Sarazin, Funkiewiez, Dubois and Hornberger2015). We selected 60 Brazilian subjects from the full sample (n = 203), individually matching them with French participants, for gender, age (±2 years), and educational level (±2 years). This procedure was adopted to avoid a selection bias caused by these variables. French participants were selected under similar inclusion criteria used in the Brazilian sample: no cognitive complaint, absence of neurological, neurosurgical or psychiatric history, and normal score on the MMSE.
Identification of emotions
We used the FERT included in the mini-SEA (Bertoux et al., Reference Bertoux, de Souza, Sarazin, Funkiewiez, Dubois and Hornberger2015). This task is composed by a selection of 35 pictures from Ekman's portfolio (Ekman and Friesen, Reference Ekman and Friesen1975), which are presented in a screen for 12 s. Seven different emotions (happiness, sadness, fear, disgust, surprise, anger, and neutral) are presented five times each, in a pseudo-randomized order. Male and female faces are presented in a similar ratio. Labels of emotions are presented at the same time on the screen during the entire task, so that the performance is independent of memory processing. Participants orally indicated which emotion was expressed and their answers were then registered.
Statistical analyses
All statistical analyses were performed using the Statistical Package for Social Sciences (SPPSS version 22) and R Software (2016). Descriptive statistics were performed to characterize the sample and each group of participants. Normality assumption was verified by the Kolmogorov–Smirnov test and also by histograms visual inspection. Non-parametric tests were used in the data analysis, since there was evidence of non-normality.
χ2 test was used for comparing categorical (gender) variable among groups. Jonckheere–Terpstra test was employed for comparing non-parametric continuous variables among Brazilian subgroups according to age and educational level, and, when pertinent, Mann–Whitney U test (with Bonferroni correction) was applied to perform two-by-two group comparisons. Mann–Whitney U test was also employed to compare gender groups (male vs. female). We used Wilcoxon sign rank test to compare Brazilian and French groups on the FERT.
Local smooth technique, Lowess (Cleveland, Reference Cleveland1993), was used to describe the behavior of total score (TS) and age and schooling. Lowess is a data-driven technique. Non-linear regression was fitted for the data based on a linear spline with one knot for age and another one for schooling. This model was necessary to obtain the equivalent score that is described elsewhere (Dodich et al., Reference Dodich2014). Equivalent score make possible direct comparison among participants. We also carried out analysis with Spearman's test to investigate correlations between FERT (TS) and age. A similar approach was adopted to explore correlations between FERT and educational level.
Results
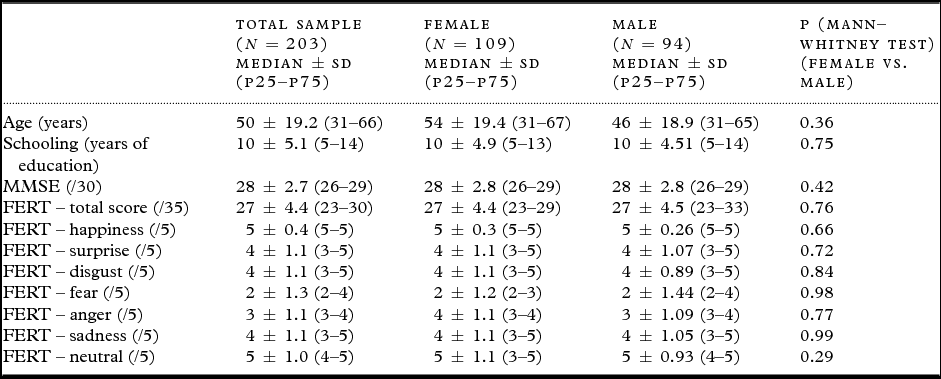
The final sample of study consisted of 203 Brazilian participants (109 females and 94 males) with mean age 48.8 ± 19 years (range 15–86 years) and mean educational level of 9.3 years ± 5.1 years (range 0–22 years). Table 1 presents socio-demographic and clinical data for Brazilian sample.
Demographic and neuropsychological data for the Brazilian sample

FERT = Facial Emotion Recognition Test; P25 = 25th percentile; P75 = 75th percentile; MMSE = Mini-Mental State Examination; SD = Standard deviation. The significance of p was set at 0.0045 (Bonferroni correction).
Effect of gender
Age and schooling were similar between men and women. There was no gender difference regarding the performance on the TS and in each emotion from the FERT in the Brazilian sample (Table 1). Women performed better than men on the TS in the French group, without any specific difference in each emotion.
Effect of age
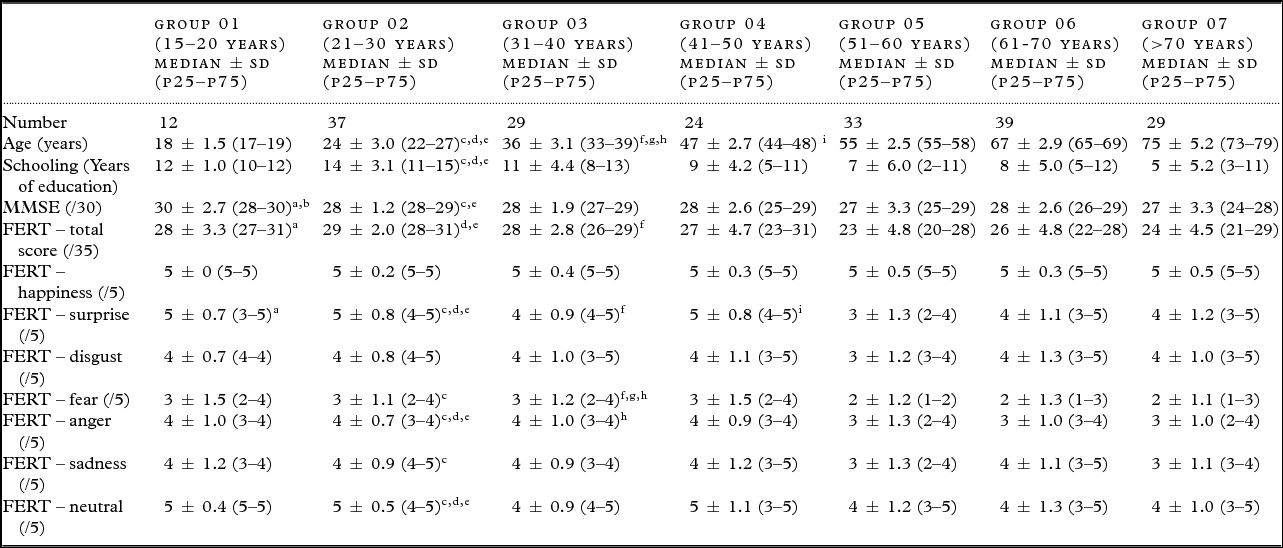
Jonckheere–Terpstra test showed differences across groups stratified according to age, in the TS (p < 0.001) and in each category (Surprise: p < 0.001/ Fear: p < 0.001/ Anger: p < 0.001/ Neutral: p < 0.01), except for happiness, disgust, and sadness (p > 0.05 for all). Then, two-by-two group comparisons were conducted with Mann–Whitney test, with Bonferroni correction (Table 2).
Demographic and neuropsychological data across age groups in the Brazilian sample

FERT = Facial Emotion Recognition Test; P25 = 25th percentile; P75 = 75th percentile; MMSE = Mini-Mental State Examination; SD = Standard deviation
There was not any difference between Groups 1 and 2, Groups 1 and 3, Groups 1 and 4, Groups 1 and 6, Groups 1 and 7, for all FERT scores.
There was not any difference between Groups 2 and 3, Groups 2 and 4, for all FERT scores.
There was not any difference between Groups 3 and 4, Groups 2 and 4, Groups 2 and 5, for all FERT scores.
There was not any difference between Groups 4 and 6, Groups 4 and 7, for all FERT scores.
There was not any difference between Groups 5 and 6, Groups 5 and 7, for all FERT scores.
There was not any difference between Groups 6 and 7, for all FERT scores.
a p < 0.0045 (Mann–Whitney test, Bonferroni correction): Group 1 versus Group 5.
b p < 0.0045 (Mann–Whitney test, Bonferroni correction): Group 1 versus Group 7.
c p < 0.0045 (Mann–Whitney test, Bonferroni correction): Group 2 versus Group 5.
d p < 0.0045 (Mann–Whitney test, Bonferroni correction): Group 2 versus Group 6.
e p < 0.0045 (Mann–Whitney test, Bonferroni correction): Group 2 versus Group 7.
f p < 0.0045 (Mann–Whitney test, Bonferroni correction): Group 3 versus Group 5.
g p < 0.0045 (Mann–Whitney test, Bonferroni correction): Group 3 versus Group 6.
h p < 0.0045 (Mann–Whitney test, Bonferroni correction): Group 3 versus Group 7.
i p < 0.0045 (Mann–Whitney test, Bonferroni correction): Group 4 versus Group 5.
Briefly, younger subjects performed better than older ones. Group 1 (15–20 years) did not differ from Group 2 (21–30 years), 3 (31–40 years), and 4 (41–50 years). There was difference between Groups 1 and 5 (51–60 years) in TS and Surprise. There was a trend of Group 1 to perform better than Groups 6 (61–70 years) and 7 (older than 70 years) in TS, Surprise, and Neutral subscores, but these differences did not survive after Bonferroni correction. Comparisons between other groups are presented in Table 2. The performance on the FERT decreases progressively until by 50 years, and then stabilizes (Figure S1, available as supplementary material attached to the electronic version of this paper at www.journals.cambridge.org/jid_IPG). There was a significant negative correlation (Spearman's correlation test) between TS (FERT) and age (p < 0.001, r = −0.38).
Effect of education
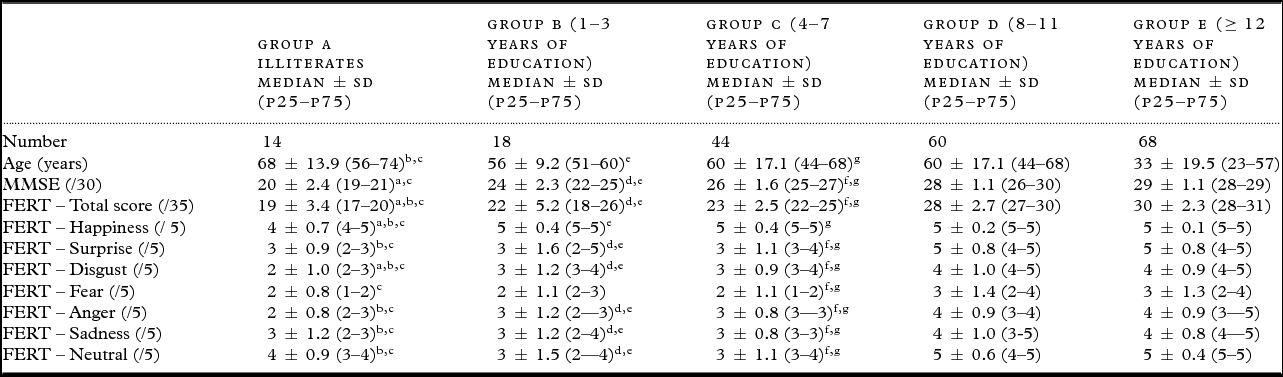
The third objective of this study was to analyze the influence of educational level on the FERT. Jonckheere–Terpstra test showed differences related to schooling subgroups in the TS and in each emotion category in the test. Illiterates (Group A) performed worse than all other groups, except Group B (1–3 years of education). Two-by-two group comparisons found no significant differences between groups B (1–3 years) and C (4–7 years) in TS and all Ekman Faces Test categories (Table 3). Although we found a significant value for Fear score, it was not significant after Bonferroni correction. Comparing Group B (1–3 years) with D (8–11 years), we noticed significant differences in the TS and in all Ekman Faces Test categories, except for Fear and Happiness score. The comparison between groups B (1–3 years) and E (12 or more years) showed differences in the TS and in all FERT subscores, except for Fear. Comparing Group C (4-7 years) with D (8–11 years), we noticed significant differences in all FERT scores, except for Happiness. The comparison between Group C (4–7 years) and E (12 or more years) revealed differences in all FERT scores. Comparing groups D (8–11 years) and E (12 or more years), we observed no significant differences. In sum, groups with higher educational level performed better than participants with lower education. The performance on the FERT increases progressively until by 11 years of education, and then stabilizes (Figure S1B). There was a significant positive correlation (Spearman's correlation test) between TS (FERT) and educational level (p < 0.001, r = 0.70).
Demographic and Neuropsychological data across schooling groups in the Brazilian sample

FERT = Facial Emotion Recognition Test; P25 = 25th percentile; P75 = 75th percentile; MMSE = Mini-Mental State Examination; SD = Standard deviation
There was not any difference between Groups A and B, for all FERT scores.
There was not any difference between Groups B and C, for all FERT scores.
There was not any difference between Groups D and E, for all FERT scores.
a p < 0.0045 (Mann–Whitney test, Bonferroni correction): Group A versus Group C.
b p < 0.0045 (Mann–Whitney test, Bonferroni correction): Group A versus Group D.
c p < 0.0045 (Mann–Whitney test, Bonferroni correction): Group A versus Group E.
d p < 0.0045 (Mann–Whitney test, Bonferroni correction): Group B versus Group D.
e p < 0.0045 (Mann–Whitney test, Bonferroni correction): Group B versus Group E.
f p < 0.0045 (Mann–Whitney test, Bonferroni correction): Group C versus Group D.
g p < 0.0045 (Mann–Whitney test, Bonferroni correction): Group C versus Group E.
Effect of cultural background
The forth objective of the present study was to assess the effect of different cultural backgrounds on the performance on the identification of emotions. We adopted a transcultural approach, by comparing two groups of participants (Brazilians vs. French), matched for gender, age, and educational level (Table 4). When comparing Brazilians and French (Wilcoxon sign rank test), we found no significant differences in TS and in each emotion. There was a trend for Brazilian scoring lower than French in surprise and disgust, but these differences did not remain significant after Bonferroni correction.
Demographic and Neuropsychological data for groups according to cultural backgrounds (France and Brazil)

FERT = Facial Emotion Recognition test; P25 = 25th percentile; P75 = 75th percentile; MMSE = Mini-Mental State Examination; SD = Standard deviation. The significance of p was set at 0.0045 (Bonferroni correction).
Normative data for the Brazilian population
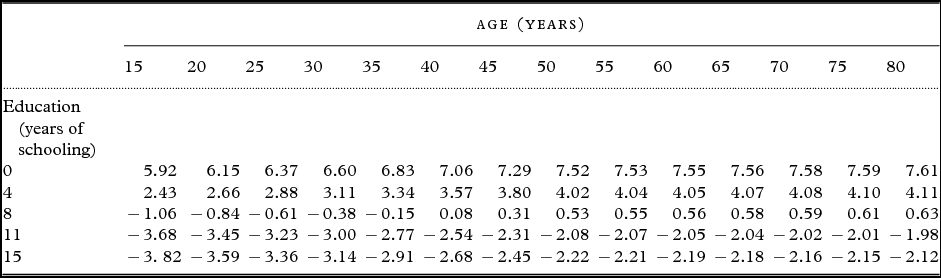
Table 5 provides normative data for the Brazilian population, considering age and education as predictors of performance. Briefly, TS is positively correlated with schooling and inversely with age. Equivalent score is obtained after removing age and schooling effect by using the fitted non-linear regression.
Normative data for Brazilian population, with age and education corrections for the Facial Emotion Recognition Test (FERT)

Corrections for FERT score:
1. If age <50 years and education <11 years of schooling: Corrected score = Raw Score + 0.046 × (age–48.80)–0.873 (education–9.27)–0.624.
2. If age <50 years and education > 11 years of schooling: Corrected score = Raw Score + 0.046 × (age–48.80) –0.035 (education–9.27) –2.060.
3. If age > 50 years and education < 11 years of schooling: Corrected score = Raw Score + 0.003 × (age–48.80) –0.873 (education–9.27) –0.573.
4. If age > 50 years and education > 11 years of schooling: Corrected score = Raw Score + 0.003 × (age–48.80) –0.035 (education–9.27) –2.008.
5. The corrected scores can be classified into categories (Equivalent scores): 0 (0–20.97), 1 (20.98–22.76), 2 (22.77–24.55), and 3 (> 24.55). Equivalent score 3 refers to the values equal to or higher than median; 1 and 2 are intermediate intervals; and 0 refers to values below tolerance limit.
Discussion
This study analyzed the effect of gender, age, education, and cultural background on the performance on the FERT from the mini-SEA. We found a significant effect of aging and schooling on the performance on the FERT, with younger and more educated subjects having higher scores, in agreement with previous studies (Ruffman et al., Reference Ruffman, Henry, Livingstone and Phillips2008; Engelmann and Pogosyan Reference Engelmann and Pogosyan2013; Dodich et al., Reference Dodich2014).
We did not find any gender difference on any scores of the FERT in the Brazilian group; however, in the French sample, women performed better than men on the TS. Previous studies have shown mixed findings on gender difference in emotion recognition tasks, with some works reporting no gender differences (Derntl et al., Reference Derntl2010; Khawar et al., Reference Khawar, Malik, Maqsood, Yasmin and Habib2013) and others reporting that female participants tend to perform better than male (Demenescu et al., Reference Demenescu, Mathiak and Mathiak2014; Dodich et al., Reference Dodich2014; Lawrence et al., Reference Lawrence, Campbell and Skuse2015). An interesting point is that this difference was found in the French sample only, and not in the total Brazilian sample. Unfortunately, this study does not have the data to go beyond this result and this aspect should be studied in a more specific way in further studies, as we believe cultural gender specific factors could play an important role in social cognitive assessment, such as emotion recognition. By investigating the possible links between gender variation of emotion perception and measures of gender equality and perceived stereotypes through a transcultural approach, we believe that these further works could have a critical interest to interpret this reported difference and enhance our understanding of this gender effect.
We found a negative correlation between age and performance on the FERT (Figure S1A). Previous studies demonstrated age-related decline in different cognitive domains, especially in executive functions such as speed processing. This has been interpreted as a decrease of fluid intelligence, a factorial component of general cognitive abilities that is highly dependent on frontal regions (Roca et al., Reference Roca2013). Whether social cognition and emotion recognition in particular relies on fluid intelligence remains an open question. However, it has been recently shown that social cognition abilities are decreased in elderly in comparison with young participants (Ruffman et al., Reference Ruffman, Henry, Livingstone and Phillips2008; Halberstadt et al., Reference Halberstadt, Ruffman, Murray, Taumoepeau and Ryan2011; Grainger et al., Reference Grainger, Henry, Phillips, Vanman and Allen2015). This age-related decline seems independent from perceptual factors and would be related to cognitive processing involved in social abilities that are more dependent of fronto-temporal circuits or the so-called “social brain” (Ruffman et al., Reference Ruffman, Henry, Livingstone and Phillips2008). Using neuro-imaging approaches, previous works did indeed show that normal, age-related, structural, and metabolic alterations take place in the brain, with the frontal cortex being the region where the greatest deterioration was observed (Kalpouzos et al., Reference Kalpouzos2009). These age differences in cognitive performance and frontal integrity should be accounted in the assessment of social cognition abilities in clinical settings and highlight the need of specific age category normative data in order to support clinical decisions based on this test.
Schooling also seems to modulate the accuracy of facial recognition. We found that more educated subjects performed better than less educated participants, in agreement with previous observations in Italian population (Dodich et al., Reference Dodich2014). We also found significant positive correlations between years of schooling and FERT scores. Education plays a major role in modulating the performance of different cognitive abilities, such as executive functions, language, and episodic memory (Nitrini et al., Reference Nitrini2004; Opdebeeck et al., Reference Opdebeeck, Martyr and Clare2016). While the role of education could appear as being less obvious in emotion recognition than in other cognitive functions such as language, it is important to specify that the FERT relies on verbal labeling of emotions, as most of emotion recognition tasks. Recently, Lindquist et al. (Reference Lindquist, Gendron, Barrett and Dickerson2014) have shown evidences that identifying the emotion's appropriate category (e.g. disgust, sadness, and surprise) depends heavily on the preliminary knowledge of the emotional concepts, independently from affective or implicit valence processing that first determine if an emotion is positive or negative (Lindquist et al., Reference Lindquist, Gendron, Barrett and Dickerson2014). It is possible that this specific semantic aspect of emotion recognition, which could be described as a taxonomy of emotion concepts, could be modulated by the level of education, as opposed to a more culture-free affective processing of the valence.
Brazilian and French participants did not differ in the FERT and its subscores for each emotion. Cross-cultural comparisons of population in emotion recognition abilities have been extensively investigated in the last decades (Ekman et al., Reference Ekman, Sorenson and Friesen1969, Reference Ekman1987; Russell, Reference Russell1994; Engelmann and Pogosyan, Reference Engelmann and Pogosyan2013). These studies provided data that demonstrated the universality of facial expression of emotions, thus replacing the preceding thesis that facial emotions are not universal, but a cultural contingency. Indeed, there is a large scope of experimental and observational data showing a high accuracy among different cultures in the identification of basic emotions. For instance, studies comparing western versus non-western populations and also illiterate versus literate support the thesis of the universality of facial expressions (Russell, Reference Russell1994). Of note, data from the seminal observations of Ekman and collaborators in pre-literate isolated societies in New Guinea and Borneo supported the thesis of a similar pattern of facial muscular activation for expression of basic emotions across cultures (Ekman et al., Reference Ekman, Sorenson and Friesen1969). In sum, these data argue for a common neurobiological basis for emotional processing, which would have a similar evolutionary origin (Ekman et al., Reference Ekman1987; Engelmann and Pogosyan, Reference Engelmann and Pogosyan2013). Despite these common bases, there are cultural factors that modulate the facial expression, such as the “display rules.” These are social codes that regulate masking, inhibiting, or amplifying the expression of facial emotions in a given social context that critically depend on culture differences (Russell, Reference Russell1994; Engelmann and Pogosyan Reference Engelmann and Pogosyan2013). There are also cultural determinants of factors that elicit emotions (Russell, Reference Russell1994). These factors and methodological issues (e.g. tasks with posed or spontaneous expressions of facial emotions) may account for some differences observed in cross-cultural studies. For instance, differences in overall recognition scores were described between Canadians and Ethiopians, Americans and Zambians, and Americans and Japanese (Russell, Reference Russell1994; Engelmann and Pogosyan Reference Engelmann and Pogosyan2013). In the current study, we did not find differences between French and Brazilians in emotion recognition, differently from a previous study (Russell, Reference Russell1994), which found that, compared to French subjects, Brazilians scored lower in the recognition of surprise, anger, and fear; and better in happiness, sadness, and disgust identification. The reasons for this difference remain unclear.
Here, we provide normative data for employing the FERT in the Brazilian population. This is of utmost importance due to the lack of clinical tools to assess social cognition in clinical practice.
In sum, this study highlights the effects of age and education in the accurate recognition of basic emotions, in agreement with previous studies. However, it was not possible to isolate the specific effect of age or schooling on the FERT, independently from each other. The educational level across age groups was not homogeneous, as the oldest group has lower educational level than the youngest. Considering Brazilian social context, this is due to the fact that the oldest group was of school age when schooling was not accessible to most of population. On the other hand, most of young people have been to school on the last three decades. More studies are necessary to understand the relationship of age and education on the FERT.
These data raise the question whether it is appropriate or valid to use tests of emotion recognition in populations with heterogeneous educational level and distinct cultural backgrounds. In the light of multicenter studies designed for including patients from different countries, there is an urge for developing neuropsychological tools that may be employed in different cultural settings, including populations with low educational level. This is very relevant as there is an increase in the number of demented patients in developing countries, with a majority of low educated patients among them (Nitrini et al., Reference Nitrini2009). Data provided by the present study may contribute for the interpretation of the results of FERT in different cultural contexts and highlight the common bias that should be corrected in future tasks to be developed. In that perspective, these data may help in the design of new tools for evaluating emotion recognition and other social abilities.
Conflict of interest
None.
Description of authors' roles
LCS designed the study, collected data, performed statistical analyses, and drafted the first version of the manuscript. MB designed the study, collected data, and critically reviewed the manuscript for intellectual content. ARVF and LTSC collected data and critically reviewed the manuscript for intellectual content. ACAP, IGB, and EC performed statistical analyses and critically reviewed the manuscript for intellectual content. PC critically reviewed the manuscript for intellectual content. ALT designed the study and critically reviewed the manuscript for intellectual content.
Acknowledgment
This study was partially funded by CNPq (402853/2012-1)
Supplementary material
To view supplementary material for this article, please visit https://doi.org/10.1017/S1041610218000443