INTRODUCTION
Numerous researchers have examined fluvial deposits and their relationship with geomorphological features, depositional environments, and paleoclimatic records (e.g., Cant and Walker, Reference Cant and Walker1978; Bridge, Reference Bridge1985; Bristow, Reference Bristow, Carling and Dawson1996). Conventional wisdom holds that past hydrological conditions (climate) can be deduced from the coupled effects of morphological and sedimentological parameters on fluvial sequences. Understanding fluvial responses to climate variability is crucial to paleoclimate reconstructions (Schumm, Reference Schumm1993; Knox, Reference Knox, Gregory, Starkel and Baker1995). West-central India has seen extensive research into the geomorphological, sedimentological, structural, depositional, and chronological aspects of Quaternary fluvial deposits, particularly in the Mahi-Narmada-Sabarmati river basins (Maurya et al., Reference Maurya, Chamyal and Merh1995, Reference Maurya, Malik, Raj and Chamyal1997, Reference Maurya, Raj and Chamyal2000; Merh and Chamyal Reference Merh and Chamyal1997; Raj et al., Reference Raj, Maurya and Chamyal1998; Jain and Tandon, Reference Jain and Tandon2003; Jain et al., Reference Jain, Tandon and Bhatt2004; Bhandari et al., Reference Bhandari, Maurya and Chamyal2005; Juyal et al., Reference Juyal, Chamyal, Bhandari, Bhushan and Singhvi2006; Prasad et al., Reference Prasad, Phartiyal and Sharma2007; Singh et al., Reference Singh, Prasad and Chakraborty2007; Laskar et al., Reference Laskar, Sharma, Ramesh, Jani and Yadava2010). According to these studies, the fluvial sediments of the Mahi-Narmada-Sabarmati river basins are stratigraphically correlatable, and were deposited under comparable climatic and tectonic conditions.
Three surfaces—alluvial plain (-S1), ravinal (-S2) and valley-fill (-S3)—have been recognized and used to separate the fluvial deposits of Mahi-Narmada-Sabarmati river basins (Juyal et al., Reference Juyal, Raj, Maurya, Chamyal and Singhvi2000; Reference Juyal, Kar, Rajaguru and Singhvi2003; Reference Juyal, Chamyal, Bhandari, Bhushan and Singhvi2006; Maurya et al., Reference Maurya, Raj and Chamyal2000). The fluvial deposits may be a sign of past environmental changes associated with changing monsoon circulation patterns. According to Jain and Tandon (Reference Jain and Tandon2003), the fluvial systems in western India responded to global climate changes such that fluctuations in monsoon intensity modulated relative changes in discharge and sediment supply. Furthermore, Tandon et al. (Reference Tandon, Sareen, Someshwar Rao and Singhvi1997) and Juyal et al. (Reference Juyal, Raj, Maurya, Chamyal and Singhvi2000, Reference Juyal, Chamyal, Bhandari, Maurya and Singhvi2004, Reference Juyal, Chamyal, Bhandari, Bhushan and Singhvi2006) linked variation in the dynamics of the Indian summer monsoon (ISM) to changes in fluvial deposits. According to Juyal et al. (Reference Juyal, Chamyal, Bhandari, Bhushan and Singhvi2006), conditions in the mainland Gujarat region were wetter during the early phase of Marine Isotope Stage 2 (MIS-2) than they are at present. However, river discharges into the Bay of Bengal and the Arabian Sea decreased during the Last Glacial Maximum (LGM; ca. 20 ka) because of a weak monsoon. Due to rising aridity, drainage in the Thar Desert was severely affected, and fluvial processes were essentially inactive. The monsoon intensified ca. 15–13 ka, affecting the drainage systems of the Indian subcontinent. This period was marked by an abrupt and large increase in the monsoon intensity followed by the early Holocene humid phase ca. 9–6 ka (Bhattacharya et al., Reference Bhattacharya, Shukla, Patel, Rastogi and Juyal2017). Additionally, the S-1 and S-3 surfaces of the Mahi River show an age difference of ca. 5 ka, from 10 ka to 5 ka (i.e., between Early and the mid-Holocene). Together, enhanced monsoonal precipitation and tectonic uplift in the early Holocene caused a 5-ka chronological gap in the geological records (Maurya et al., Reference Maurya, Malik, Raj and Chamyal1997, 2000). Additionally, there are few studies using laboratory-based data focusing on the texture, mineralogy, and geochemistry of the sediments, making it difficult to accurately estimate the intensity of the climate regime responsible for sediment transport, as well as determining depositional environments, degree of weathering, and provenance of sediments, all of which have important climatic implications.
Therefore, we examined sediment deposits in the Dhadhar River basin, located between the Narmada and Mahi river catchments of Gujarat in western India. We discovered a natural embankment/levee sedimentary deposit located between the Mahi and Narmada river basins along the Khakariya Nala, a tributary of the Dhadhar River that drains into Pratappura Lake, that we termed the ‘Pratappura profile.’ The Pratappura profile is a ~7.5 m sedimentary sequence that allows us to fill in missing information due to the chronological gap in the geological record as currently known in the area.
We utilized a multiproxy approach to analyzing the Pratappura profile using grain size, geochemistry, χlf, δ13C, and phytoliths to analyze textural and geochemical characteristics of this deposit. Our goals were to: 1) characterize textural and mineralogical characteristics of the sediments, 2) determine the extent of weathering of the sediments, 3) determine the provenance of the sediment, and 4) integrate the data to better understand the climate history of this area for the past ca. 29 ka (MIS-2 to present).
Study area
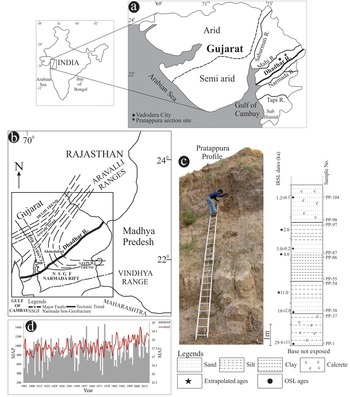
The Pratappura section is located ~25 km (22°29.002 N; 73°23.522 E) northeast of Vadodara City (Fig. 1a). A natural embankment that we called the Pratappura section is located next to Pavagarh Hill (Fig. 1a, c). The Dhadhar River is eventually formed by the joining of first and second order streams which also drain into Pratappura Lake. The subhumid Narmada basin in the south and the semiarid Mahi basin in the north are linked by the Dhadhar River.
Geographic setting, tectonic trends, climate, lithology, photo, and graphic measured stratigraphic section of the study area. Map of India at top left indicates where (a) regional and local study areas are located in Gujarat. (b) Regional tectonic setting showing prominent structural trends, faults, and rifts. (c) Field photograph and associated graphic stratigraphic section showing lithology of the profile, where samples were taken for optically stimulated luminescence (OSL) analysis, and infrared stimulated luminescence (IRSL) and extrapolated ages. (d) Climatology graph of the study area indicating mean annual temperature (MAT) in °C and mean annual precipitation (MAP) in mm per year.

The geology of the research region consists of Precambrian basement overlain by Jurassic, Cretaceous, Tertiary, and Quaternary rocks in different areas (Biswas, Reference Biswas1987). Rock formations that are found along the two major lineaments, the Narmada and the Cambay rift systems (Fig. 1b), show uplift and subsidence along the Mesozoic and Cenozoic tectonic features that left traces on the majority of mainland Gujarat (Biswas, Reference Biswas1987). Cretaceous fault-controlled sedimentary basins show evidence of tectonic activity associated with these two significant (Narmada and Cambay rift) fracture trends. In contrast, modern distribution and outcrop patterns demonstrate an E–W-trending fault control. Tertiary rocks were deposited in tectonic basins bounded by N–S and E–W-trending faults. Quaternary deposits are separated from older rocks in the area by the N–S-trending eastern Cambay Basin fault that continues across the mainland. The terrain, which often exhibits progressive stepping down from south to north along E–W faults and from east to west along N–S faults, reflects underlying structure (Fig. 1b).
The region experiences variable rainfall (2000 mm in the south and 300 mm in the north; Fig. 1a) and our research area falls within arid and semiarid climate zones. Although temperatures peak up to 47–48°C during the summer, the daily mean maximum and minimum temperatures are ~40°C and 25°C, respectively. A climatology graph of the study area includes mean annual precipitation (MAP) and mean annual temperature (MAT) (Fig. 1d).
The lithology of the Pratappura section is composed of sand, silt, and clay. Silty sand and tough, massive calcrete make up the bottom 1.8 m of the profile (Fig. 1c). The calcrete is overlain by a massive, >1 m-thick sandy horizon with no visible sedimentary structures. A 1.2-m-thick layer of silty clay lies above the sandy horizon which is then overlain by >1 m beds of alternating sand and clay units. The top of the section is composed of ~ 2.5-m-thick friable and homogenous sand with a few calcrete nodules. A total of 104 sediment samples were collected at 5-cm intervals from the base of the section to 4.5 m, and at 20-cm intervals from 4.5 m to 7.5 m due to less lithological variation. Four samples were taken from sandy layers for optically stimulated luminescence (OSL) analysis to determine the section's precise chronology.
METHODS
Optically stimulated luminescence (OSL) dating
For optically stimulated luminescence (OSL) chronology, four sandy-to-silty samples (Fig. 2, Table 1) were dated by the Wadia Institute of Himalayan Geology, Dehradun (WIHG). The fundamental presumption behind OSL dating is that sand loses its stored luminescence when exposed to sunlight during erosion and transit, a process known as ‘zeroing.’ Due to radioactive exposure from ambient U, Th, K, and gamma radiation, the same sediment resumes accumulating luminescence after sedimentation and burial. The laboratory equivalent of the luminescence thus accumulated is called equivalent dose (ED). By dividing the ED by the dose rate, the age of the sediment can be determined. Due to turbulence, zeroing can be difficult in fluvially produced sediments, and fresh feldspar contamination can frequently obscure the OSL signal. These issues are resolved by 1) utilizing a minimum age model (MAM) to treat data with overdispersion (OD) of less than 20% and the mean ages for the data with a larger OD (Galbraith et al., Reference Galbraith, Roberts, Laslett, Yoshida and Olley1999), and 2) observing the infrared stimulated luminescence (IRSL) signal for feldspar, which should have fewer than 150 counts.
Age-depth model showing optically stimulated luminescence (OSL) dates and sedimentation rates (r) derived from the Pratappura section. Mod: modern; see Figure 1c for sample locations.

Optically stimulated luminescence (OSL) chronology of Pratappura profile. Least represents the minimum age. The wide spread in the paleodose data suggests inhomogeneous bleaching of geological luminescence signal, which prompted us to use the least 20% of the paleodoses of final age calculation.

The samples were chemically treated using H2O2 and HCl in the laboratory to remove organic matter and carbonate coatings. Subsequently, the dried sediment was sieved to 125–150 μm. A density separation technique using sodium polytungstate (density = 2.59 gm/cc) was applied for quartz and feldspar separation. First, HF was used to remove the alpha-affected skin from the separated quartz grains, and then HCl was used to dissolve the fluoride crystals. The quartz grains were then mounted on 9.8 mm stainless steel discs after being washed, dried, and cleaned. For measuring the ED, a Riso TL/OSL-20 system equipped with arrays of blue LEDs and infrared LEDs as a source for stimulation at 125°C for 40 s was employed. For each sample, 35 aliquots were used. Photons were counted for paleodose estimation using a combination of Schott BG-39 and Hoya U-340 optical filters in front of an EMI 9235 QA photomultiplier tube. A 5-point single aliquot regeneration (SAR) technique was employed for the measurement, with a preheat of 220°C/10 s and a cut heat of 160°C (Murray and Wintle, Reference Murray and Wintle2000). IRSL measurements on natural samples were used to track feldspar contamination. Using photon counts from the shine-down curves of the initial 5 channels (1 channel = 0.16 s), the paleodose for 30–35 discs was determined. U, Th, and K concentrations were measured using X-ray fluorescence (XRF) and inductively coupled plasma mass spectrometry (ICP-MS) for dose rate calculations. These samples were considered to have a moisture content of 10 ± 5% and a cosmic dose rate of 150 ± 30 μGyr−1 (Prescott and Stephan, Reference Prescott and Stephan1982).
Digital elevation model (DEM)
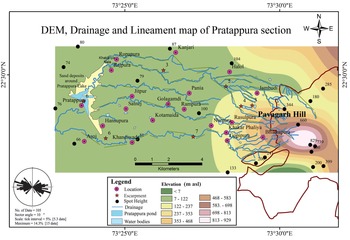
With a resolution of 90 m, a digital elevation model (DEM) was produced using data from the Shuttle Radar Topographic Mission (SRTM; https://srtm.csi.cgiar.org) as inputs for Spatial Analyst in ArcGIS 10.3 (Fig. 3). Based on symmetry, channels and stream lineaments were recovered from the DEM to create a drainage map. The ROSE diagram was prepared in RockWare 16 (Wells, 1999), a useful tool for visually representing two-dimensional orientation and other data (Potter and Pettijohn, Reference Potter and Pettijohn1963; Wells 1999; Sanderson and Peacock, Reference Sanderson and Peacock2020), and the azimuths were calculated for all the escarpments in the study area using ArcGIS 10.3. The azimuths of the channel and stream lineaments were also then calculated using ArcGIS 10.3 (ESRI, 2011). Using the Rose module in RockWare, the azimuths were then plotted as a rose diagram to organize the lineament association according to their direction of propagation. The resulting rose diagram shows how lineaments repeat at regular intervals (Moore et al., Reference Moore, Grayson and Ladson1991; Reddy, Reference Reddy1991).
Digital elevation model (DEM), subsurface lineament, escarpment, and rose diagram for the Pratappura profile area, showing the structurally controlled drainage pattern.

Textural (grain-size) and loss-on-ignition (LOI) analyses
For grain-size analysis, 35 sediment samples were chosen from the measured profile (Supplementary Table S1). Following the methods of Jackson (Reference Jackson1956) and Kunze (Reference Kunze and Black1965), 10 g of bulk, air-dried samples were treated with CH3COONa, H2O2, NaHCO3, and Na2S2O4 to remove carbonate, organic carbon, salts, and iron-manganese oxide coatings on the sediment grains. A 53-μm sieve was used to separate the sand fraction from silt and clay. After that, distilled water was added to the silt and clay fraction and transferred into a 1-L cylinder to separate the silt and clay fraction by the pipette method (Tanner and Jackson, Reference Tanner and Jackson1948; Day, Reference Day and Black1965). A ternary diagram was then created that plotted the percentages of sand, silt, and clay in the samples.
A total of 104 sediment samples were evaluated for moisture, organic carbon (Corg), and inorganic carbon (CO3−2) percentages. Five g of 75-μm powder samples were cooked in quartz crucibles at 110°C, 550°C, and 950°C, and weight loss was measured to quantify moisture, Corg, and CO3−2 (weight loss at 950°C is multiplied by a factor of 1.36 to covert weight loss from CO2 to CO3), in the samples, respectively (Dean, Reference Dean1974; Bengtsson and Enell, Reference Bengtsson, Enell and Berglund1986).
Magnetic susceptibility (χlf) analysis
Magnetic susceptibility (χlf) is a concentration-dependent parameter of ferrimagnetic and paramagnetic content in the sediment. The χlf is used as a proxy to infer climatic variations (Maher and Thompson, Reference Maher and Thompson1992; Evans and Heller, Reference Evans and Heller1994; Sangode and Mazari, Reference Sangode and Mazari2007; Phartiyal et al., Reference Phartiyal, Srivastava and Sharma2009). Higher values of χlf imply a close relationship between erosional processes and increasing concentration of detrital input from the catchment (Williamson et al., Reference Williamson, Jackson, Banerjee, Marvin, Merdaci, Thouveny, Decobert, Gibert-Massault, Massault, Mazaudier and Taieb1999). Samples were analyzed using low field mass-specific susceptibility (χlf). For these analyses, ~10-g samples were (Supplementary Table S2) was taken in non-magnetic sample holders and analyzed using a MS-2 Bartington susceptibility meter at WIHG, Dehradun.
Stable carbon isotope analysis
Stable carbon isotope analysis was performed on 48 sediment samples (Supplementary Table S3). Samples were air-dried, powdered, and then 1.5 g per sample was repeatedly treated with 5% HCl and heated on a water bath for 2 hours to dissolve the carbonates. Acid-treated samples were then rinsed in Milli-Q water and centrifuged at 3000 round per minute (rpm) to remove the acid and soluble salts. After complete neutralization, the samples were dried in a hot air oven at 50°C. The treated dry samples were then powdered, weighed, and properly packed into tin capsules. The samples were analyzed in a mass spectrometer (FLASH-EA 1112 Series Thermo made) at the Indian Institute of Tropical Meteorology (IITM), Pune. Isotopic results are given using delta (δ) notation using the international standard Vienna PeeDee Belemnite (VPDB; Coplen, Reference Coplen1994). Measurement error was ± 0.1‰ based on repeated analysis of a laboratory standard.
Bulk and clay mineral X-ray diffraction (XRD) analyses
For bulk mineralogical studies, six samples were selected from the profile. The air-dried samples were crushed to 75 μm and analyzed using an XPERT-PRO diffractometer system with continuous scanning at 25°C (2θ of 4.0–79.9). For clay mineralogy, eight samples were selected from the profile. The clay fraction (<2 μm) was separated, and oriented slides were prepared using a standard smear technique (Tanner and Jackson, Reference Tanner and Jackson1948; Day, Reference Day and Black1965). The clay slides were analyzed (2θ of 4.0–40.0) using a XPERT-PRO diffractometer at WIHG. The identification of clay minerals was done by glycolation, then heating samples at 250°C and 300°C. Mineral identification was done using X'pert high score software (https://www.malvernpanalytical.com) and the ICDD pdf 4 mineral database (Gates-Rector and Blanton, Reference Gates-Rector and Blanton2019).
Geochemical analysis
For bulk geochemical analysis, 16 sediment samples were chosen from the entire profile (Table 2). The bulk samples were initially homogenized using the coning and quartering method, and ~25 g sample was crushed to 75 μm using a Retsch (PM 100 CM) disc mill. For major oxide analysis, 6 g of powdered sample and 4 g of boric acid were mixed, and pressed pellets were prepared for XRF analysis (Stork et al., Reference Stork, Smith and Gill1987; Saini et al., Reference Saini, Mukherjee, Rathi and Khanna2000; Khanna et al., Reference Khanna, Saini, Mukherjee and Purohit2009). The pellets were analyzed for major and minor oxides using a standard wavelength-dispersive X-ray fluorescence spectrometer (WD-XRF) technique on a sequential XRF spectrometer (Siemens SRS-30 0 0) at WIHG, Dehradun. Several international sediment sample standards (GXR-2, SO-1, GSS-1, SCO-1, SGR-1, MAG-1, and GSD-9) were used to check the precision and accuracy of the sample preparation and instrumental performance. The accuracy and the precision of measurement were better than 2–5% and <2%, respectively. For a few trace elements including rare earth element (REE) analysis, samples were digested in a mixture of super-pure acids (HF + HNO3 + HClO4) using the ‘B-solution’ method (Shapiro and Brannock, Reference Shapiro and Brannock1962) in Teflon™ crucibles. All samples were analyzed by ICP-MS (PerkinElmer, Elan-DRCe) at WIHG, Dehradun. Several USGS international (MAG-1, SGR-1, SCo-1) and in-house (WIHG, Dehradun) standards were used for instrument calibration. The precision for ICP-MS analyses obtained was ≤5%.
Major, trace, and rare earth element (REE) compositions of samples from the Pratappura profile with calculated chemical index of alteration (CIA) and index of chemical variability (ICV) values; ppm: parts per million.

Chemical index of alteration (CIA) calculations were carried out by using the molar proportion of Al2O3, CaO*, Na2O and K2O. CaO* was taken in silicate form only (Nesbitt and Young, Reference Nesbitt and Young1989), and calculated by the method proposed by McLennan (Reference McLennan1993) because we had no direct method available to distinguish and quantify the amount of CaO belonging to the silicate and non-silicate fractions. The CIA was calculated as:

and in a generalized A (Al2O3)–CN (CaO* + Na2O)–K (K2O) triangular plot, the average upper continental crust (UCC) composition is ~50 (CIA = ~50).
The index of chemical variability (ICV) was also calculated to understand the index of recycling and compositional maturity in sediments (Cox et al. Reference Cox, Lowe and Cullers1995; Armstrong-Altrin, Reference Armstrong-Altrin2015), where

and an ICV < 1 indicates sediment recycling and that the sediment is highly mature, whereas ICV > 1 shows a first cycle of sediment deposition, and that the sediment is immature in nature.
Phytolith studies
Phytoliths are microscopic opaline silica bodies present in almost all plants, and their major function is to provide mechanical support to the plant. In the grasses, phytoliths are very distinct and their morphology is easily distinguishable between summer and winter grasses. After the decay of plants, phytoliths remain in the soil and sediment as a relic of an earlier ecosystem (paleovegetation; Fredlund and Tieszen, Reference Fredlund and Tieszen1994).
For phytolith analysis, 5 g of sediment sample (Supplementary Table S4) was kept in 10% sodium hexametaphosphate (Calgon™ solution) overnight, and suspended clay was siphoned out. The samples were subsequently treated with 10% HCl and heated in a sand bath for 10–20 minutes for carbonate removal. The organic content was removed by heating 30% H2O2 in a sand bath for 20–30 minutes. The remaining residue was washed twice with distilled water. Phytolith extraction was done by adding the residue to a heavy liquid solution of cadmium iodide (CdI2) and potassium iodide (KI) with a specific gravity of 2.3 that was centrifuged at 1000 rpm for 5 minutes. The lighter fraction containing phytoliths were then washed, dried, and weighed. Dried phytoliths were mounted on slides using Canada balsam. A few slides were also mounted in immersion oil to view 3-D images of phytoliths. The phytoliths were identified at 100× magnification using a Leitz LABORLUX-D light microscope and a minimum of 300 counts were taken and classified according to Twiss et al. (Reference Twiss, Suess and Smith1969) and Mulholland and Rapp (Reference Mulholland, Rapp, Mulholland and Rapp1992).
RESULTS
Chronology
Four sediment samples for OSL dating were taken at various heights from the profile (see Figure 1c for sample locations). The samples produced a typical shine-down curve for quartz. The shine-down curve, growth curve, and cumulative frequency curve of the sample LD-795 are shown in Supplementary Figure S1. Supplementary Figure S2 displays the radial plots and OD values for all four samples. Table 1 provides information on ED, dosimetry and ages. The sedimentation rates from an age-depth model created using Microsoft Excel were used to derive the extrapolated ages (Fig. 2).
Grain size and LOI
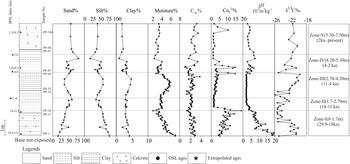
In the sediment textural study (Fig. 4; Supplementary Table S1), the percentage distribution of sand, silt, and clay in the sedimentary succession is shown. All samples plotted in the silty-sand and sandy-silt region of the ternary plot, as shown in Supplementary Figure S3. In the profile, the percentage of sand ranges from 17–81% (average = 47%), that of silt from 18–79% (average = 49%), and that of clay from 0.9–4.7% (average = 2.94%). In zone-I (0–1.7 m), the percentages of the sand fraction varies from 17–50%, the silt fraction varies from 48–78% and the clay fraction varies from 2–4%. In zone-II (1.7–2.7 m), the percentages of sand range from 46–60%, silt from 36–50%, and clay from 2.8–3.3%. In zone III (2.7–4.20 m), silt and clay fractions rise slightly, and the clay fraction declines somewhat. Overall, sand > silt > clay in zones I and II, while in zone-III silt is more dominant. In zone IV (4.20–5.3 m), the sand and silt fractions are the main components rather than the clay fractions. The sand fraction rises even higher and the clay fraction falls in zone V (5.3–7.5 m).
Pratappura profile variations with depth in sediment texture (sand, silt, and clay percentage), loss-on-ignition measurements (moisture, organic and carbonate carbon percentages), mass-specific magnetic susceptibility (χlf), and stable carbon isotopes (δ13C).

The % moisture, Corg, and CO3−2 concentrations of the sediment samples were estimated using LOI analysis (Fig. 4, Supplementary Table S2). Zone-I has a moisture content of 2% to 7%; a Corg content from 1.3% to 3.0%; and a CO3−2 concentration of 4% to 19%. Zone-II sediments have moisture contents that range from 3.6% to 4.4%, a Corg content from 1.3% to 2.4%, and a CO3−2 concentration of 1.4% to 4%, whereas zone-III sediments have slightly higher moisture contents of 2.8% to 6%, Corg of 1.3% to 3.8%, and a CO3−2 concentration of 1.9% to 15%. Zone-IV shows no discernible change in the moisture and Corg values as compared to zone-III, whereas the CO3-2 shows an increased value. In zone-V, % moisture and Corg values are roughly equal, and the CO3−2 fraction varies between 1% and 15%.
Bulk and clay mineralogy
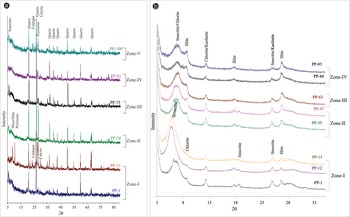
Six samples covering all lithologic units in Pratappura section were examined using XRD for bulk mineralogical studies (Fig. 5a). The most prevalent minerals in the sampled profile are quartz, plagioclase, and calcite. Zone-I has calcite peaks, indicating significant Ca accumulation from prolonged exposure. Zone-II contains less calcite and more quartz, mica, and pyroxene. In zone-III, there are calcite peaks that are smaller in the upper part of the zone, but the mica peak is still discernible.
(a) Bulk powder X-ray diffraction (XRD) spectra and (b) clay mineral assemblage in selected Pratappura profile (PP) samples from each zone.

Clay mineralogy was determined from eight sediment samples from the Pratappura profile (Figure 5b). Smectite, kaolinite, illite, and chlorite are present in the entire profile. Chlorite dominates over smectite in the bottom part of the profile (zone-I), whereas illite dominates in the middle part of the profile (zone II). Kaolinite/smectite predominates over other clay mineral associations in the profile from zone III to the top, however, a little amount of illite is also present in the upper part of the profile.
Magnetic susceptibility
The χlf values determined from the Pratappura profile vary from 2.08 × 10⁻⁸ m3kg−1 to 21.33 × 10⁻⁸ m3kg−1 (Fig. 4). At the base, ca. 29.9 ka, the highest χlf values (21–22 × 10−8 m3kg−1) were observed (zone-I). In the middle zones (zone II and III), the χlf does not vary much, and ranges from 2 × 10⁻⁸ m3kg−1 to 3 × 10⁻⁸ m3kg−1; in the upper section (zone IV and V), the χlf ranges from 2 × 10⁻⁸ m3kg−1 to 7 × 10⁻⁸ m3kg−1.
Geochemistry
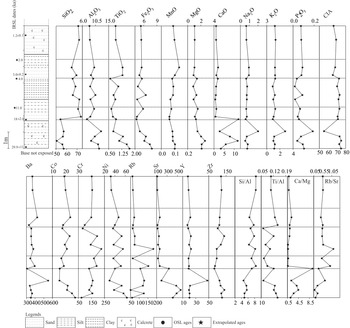
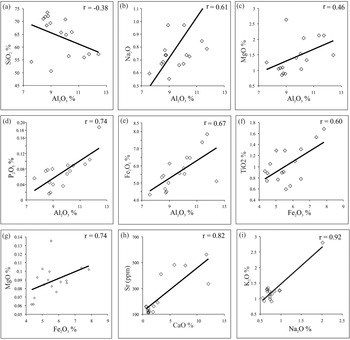
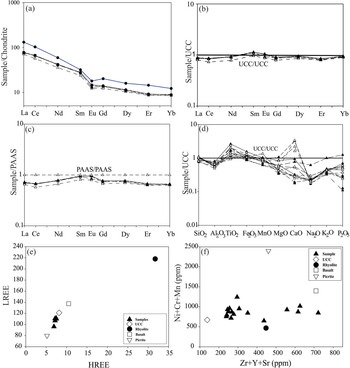
Figure 6 and Table 2 depict the geochemical data as it is distributed within the sedimentary profile from Pratappura. The major oxides found in the section are SiO2 (50–74%), Al2O3 (7–12%), TiO2 (0–2%), Fe2O3 (4–8%), MnO (0.05–0.2%), MgO (0.5–2.7%), CaO (0.5–12%), Na2O (0.5–2%), K2O (1–2%) and P2O5 (0.015–0.2%). Variation in the sand fraction indicates changes in SiO2 in the profile and major oxide chemistry correlates with grain size. It is evident that SiO2 and CaO exhibit significant variation, with ranges of 50% to 75% and 0.5% to 12%, respectively. The other elements also vary, although only to a limited extent. Significant differences exist in the distribution of major oxides in the zones we defined in the profile (Fig. 6). Figure 7 shows correlation trends for the geochemical data. SiO2 and Al2O3 exhibit essentially opposite fluctuation trends and are negatively correlated (r = −0.38). Na2O (r = 0.61), MgO (r = 0.46), P2O5 (r = 0.74) and Fe2O3 (r = 0.67) virtually mirror the Al2O3 trend. The trends for CaO and Sr are also comparable (r = 0.82). The trends for Fe2O3, MgO, and MnO also follow one other, and TiO2, Co, and Ni exhibit similar behavior (Table 3). The similarity between Fe2O3 and TiO2 variation is interesting to note (r = 0.60). Zone-II (18 ka) has the greatest CaO/MgO value, which has a positive correlation (r = 0.65) with MgO (Table 3). Alkali feldspar control is indicated by a positive correlation between the immobile Ba and the mobile K2O (r = 0.86). Biotite control is indicated by the Rb/Sr <1 ratio. The chondrite normalized REE patterns of a few selected samples (Table 2) are identical to the UCC. The fractionation of light REE is substantially larger (La/Sm = 2.76–2.98 versus Gd/Yb = 1.44–1.59, and variable Eu/Eu* = 0.67–0.74) than that of heavy REE (Table 2). Even while the REE pattern is the same across samples, this does not always mean that the sediments came from the same source or were homogenized in the same way.
Variations with depth in the Pratappura profile in percentage of major oxides, trace elements in parts per million (ppm), and elemental ratios (Table 2) in selected Pratappura profile samples from each zone.

Binary plots showing relations among different major oxides and trace elements for Pratappura samples (Table 2).

Correlation coefficient matrix for major and trace elements of Pratappura section; n = 16; statistical significance of numbers in bold and underlined = 99%; numbers in bold statistical significance = 95%.

Stable carbon isotopes (δ13C)
Selected samples from the complete Pratappura profile (Supplementary Table S3) were examined to determine values of δ13Corg, and to determine the trend of δ13C. Values of δ13C vary from −25.90‰ to −19.64‰, and an average have a value of −22.68‰. The δ13C value ranges from −22.09‰ to −20.04‰ in the lower part of zone-I (0–0.8 m), whereas it ranges from −25.90‰ to −22.17‰ in the upper part of zone-I (0.8–1.7 m) and zone-II. The lower and upper portions of zone-III exhibit greater negative δ13C values i.e., −25.21‰ and −25.07‰ respectively, while the central portion has slightly higher (less negative) values. the δ13C values in zone-IV range from −21.88‰ to −20.28‰, except 5.07 m from the base, where they are more negative. The δ13C values in the uppermost zone (zone-V) range from −22.47‰ to −21.10‰. The profile's overall δ13Corg trend together with other proxy records can be seen in Figure 4.
Phytolith results
Phytolith remnants in the Pratappura profile are plentiful in zone-I, but most are fragmented and difficult to classify into anyone one morphotype. The predominant phytolith morphotypes in zones -II and -III (1.7 m to 4.2 m in the profile) are bulliform, which range from absent to 42% (average = 27%), rondels, which range from absent to 37% (average = 16%), trapezoid, which range from 0 to 33% (average = 15%), and rods, which range from absent to 19% (average = 8.5%). Prevalence of other phytolith morphotypes is low (Fig. 8). These phytolith morphotypes are unique to the grass families Pooideae and Fenestucoideae. While saddle, cross, and dumbbell forms are present in a few samples from the upper part of the section, globular and rough globular cells found in the upper part of the section (zones -IV and -V) range from absent to 13% (average = 4.8%) and absent to 12% (average = 2.8%), respectively. These phytolith morphotypes fall within the Panicoideae and Chloredoideae subfamilies. Very few charcoal occurrences in zone-IV and the lower portion of zone-V point to a drop in surface runoff.
Depth variations in phytolith morphotypes (in %), and comparison with stable carbon isotopes (δ13C) in different zones from the Pratappura profile. IRSL: infrared stimulated luminescence; black dots indicate samples taken for optically stimulated luminescence (OSL) analysis.

DISCUSSION
Numerous prior research studies used catchment geomorphology, lithology, provenance, weathering, erosion, and digenetic changes in sediments to examine environmental and climatic variations during the past 125 ka (e.g., Khadkikar et al., Reference Khadkikar, Chamyal and Ramesh2000; Laskar et al., Reference Laskar, Sharma, Ramesh, Jani and Yadava2010; Sharma et al., Reference Sharma, Sensarma, Kumar, Khanna and Saini2013 and references therein) from Gujarat, Western India. Additionally, Andrews et al. (Reference Andrews, Singhvi, Kailath, Kuhn, Dennis, Tandon and Dhir1998) and Juyal et al. (Reference Juyal, Chamyal, Bhandari, Bhushan and Singhvi2006) reconstructed the paleoclimate of the Thar Desert, and western India, respectively. To determine the catchment weathering intensity, provenance, and paleoclimate for the past 30 ka, our investigation on the Pratappura profile in mainland Gujarat, western India, employed a multiproxy approach including inorganic geochemistry, phytoliths, and stable carbon isotope (δ13C) and textural analyses.
Samples from several zones revealed noticeable variation in mineralogy and geochemistry (Fig. 6). The variation in mineral composition, especially in zones -II and -III, indicated the presence of specific mineral phases, such as pyroxene and sodic plagioclase feldspar that were mechanically derived and underwent minimal chemical change before deposition, and are otherwise either absent or present in very small amounts in the rest of the section. Flood basalts and rhyolite of Deccan origin are dominant at Pavagarh hill. The Godhra granite lies close to and nearby to the adjoining part of Pavagarh hill, which are underlain by the Precambrian basement made up of granites, gneisses, and quartzites (Sheth and Melluso, Reference Sheth and Melluso2008). Pavagarh Hill has a wide variety of rock types, including picrite, sub-alkali basalt, and dacite to rhyolite, as well as a sizable amount of plagioclase and pyroxene phenocrysts (Sheth and Melluso, Reference Sheth and Melluso2008). Both plagioclase and pyroxene are said to be weathering-prone (Goldich, Reference Goldich1938), yet their presence in the sediments suggests that weathering had not yet altered them prior to deposition. This has a significant effect on the geochemistry of the sediments, which show a positive correlation between mobile (Na2O, MgO) and immobile elements (Al2O3 and Fe2O3) (Fig. 7, Table 3). This finding is further supported by the log (Na2O/K2O) versus log (SiO2/Al2O3) plot (Fig. 9a; Pettijohn et al., Reference Pettijohn, Potter and Siever1972), where a substantial number of samples fall in the sub-litharenite group or are close to this field, indicating the existence of lithic components in the bulk sediment.
Plots of sediment chemical compositions of samples (see Table 2) from the Pratappura section. (a) Plot of log Na2O/K2O versus log SiO2/Al2O3 (after Pettijohn et al., Reference Pettijohn, Potter and Siever1972); note the clustering of the samples between sublitharenite and quartz arenite fields, suggesting the presence of lithic components in the bulk sediment. (b) Plot of chemical index of alteration (CIA) versus index of chemical variability (ICV); note that samples cluster mainly between subalkali basalt and picrite, indicating the dominance of the mafic component. (c) A–CN–K plot; note that the Pratappura samples plot below the post-Archean Australian Shale (PAAS) standard, indicating moderate weathering in the presence of mafic components.

The presence of lithic components in the sediments indicates minimal chemical alteration. The presence of very fresh mineral grains of pyroxene and plagioclase also corroborates that the rocks of the upland catchment must have been exposed very recently or the conditions at the depositional site were such that there was no alteration before the sediments were deposited. The sediment samples were plotted on A–CN–K triangular plots to determine chemical maturity (Fig. 9c), and the samples plotted close to the post-Archean Australian Shale standard (PAAS). PAAS refers to the upper continental crust composition, and is used as a standard for comparing geochemical data. The CIA values in the examined sediments range from 55–74 (average = 69), which indicates that the sediment profile underwent mild weathering that was probably influenced by secondary calcrete formation. The ICV values, which represent chemically immature sediment from the first cycle of the sedimentary process, range from 0.99–2.6 (average = 1.50). High average ICV values (~1) are a result of sediments deposited in a tectonically active continental margin during the first cycle, and ICV values of <1 show highly mature sediments (i.e., enriched in resistant minerals) deposited after significant sediment recycling. Using the methods of Lee (Reference Lee2002), the CIA versus ICV plot (Fig. 9b) indicates that the sub-alkali and the picritic basalts are the major contributors of sediments in the Pratappura profile.
The REE abundance and chondrite normalized diagrams (Fig. 10a) show almost identical patterns, with a higher concentration of light REE (LREE) rather than heavy REE (HREE) with a negative Eu anomaly similar to that of the upper continental crust (UCC; McLennan, Reference McLennan2001), which indicates that the sediment samples are well homogenized. Similar to the LREE-deficient patterns, where the La/Yb <1, these sediments likely came from a mafic source. Depletion can be seen in the UCC- and PAAS-normalized REE patterns, although a hump in the middle REE could be due to pyroxene/amphiboles (Fig. 10b, c). The enrichment of TiO2 and Fe2O3 compared to UCC can also be seen in the multi-element plot (Fig. 10d). Additionally, all samples plot close to UCC and between picrite and sub-alkali basalt in the LREE versus HREE plot (Fig. 10e). In contrast, the samples plot between the fields of basalt and rhyolite in Ni+Cr+Mn versus Zr+Y+Sr (compatible versus incompatible elements; Fig. 10f). These diagrams imply that the samples exhibit a bias towards a source that is dominated by basalt. However, there is also an indication of a felsic component.
Rare earth element (REE) patterns for selected Pratappura samples (see Table 2). (a) Chondrite-normalized REE plots showing an upper continental crust (UCC) pattern; (b) UCC-normalized REE patterns with characteristic depleted light REE (LREE) and heavy REE (HREE) with enriched middle REE (MREE); (c) Post-Archean Australian Shale (PAAS)-normalized REE patterns showing less fractionated character and depleted REE values; (d) UCC-normalized multielement data shows enrichment of TiO2 and Fe2O3 than UCC; (e) in both LREE versus HREE and (f) Ni+Cr+Mn versus Zr+Y+Sr scatter plots, all samples cluster close to UCC and picrite, indicating a mafic source. Chondrite data from McDonough and Sun (Reference McDonough and Sun1995), UCC from Rudnick and Gao (Reference Rudnick, Gao, Holland and Turekian2003), and PAAS from Taylor and McLennan (Reference Taylor and McLennan1985).

Paleoclimatic inferences
The Pratappura profile was divided into five climatic zones in chronological sequence for accurate assessment and sequential changes in the major proxy metrics including grain size, δ13C, elemental analysis, magnetic susceptibility (χlf), loss-on-ignition (LOI), and phytoliths (Figs. 4, 8). Additionally, the four OSL dates presented with depth (Fig. 2) restrict us to suggest only climatic events of the past ca. 30 ka. To overcome this, specific observations are discussed using extrapolated ages determined by sedimentation rate.
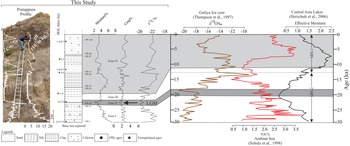
A steadily increasing trend in the sand and the carbonate carbon fraction is seen in zone-I (29.9–18 ka). In contrast, moisture content, % Corg, and magnetic susceptibility (χlf) all trend downward. An increase in CO3−2 fraction indicates evaporative conditions that favored the development of secondary calcrete (Khadkikar et al., Reference Khadkikar, Chamyal and Ramesh2000). Similarly, the decline in χlf, Al2O3, Fe2O3, TiO2, and CIA is also thought to be a consequence of hydrological conditions gradually diminishing with a decrease in sediment supply and less chemical weathering in the catchment region (Evans and Heller, Reference Evans and Heller1994; Figs. 4, 6). The region's semiarid climate is also indicated by a change in clay mineralogy from smectite–kaolinite to mainly smectite (Jain and Tandon, Reference Jain and Tandon2003; Fig. 5b). It is important to note numerous researchers in the Sabarmati and the Mahi River valleys reported regional flood plain aggradation and pedogenesis activities during MIS-3 (Juyal et. al., 2006; Thokchom et al., Reference Thokchom, Bhattacharya, Prasad, Dogra and Rastogi2017). The central Thar Desert region (Andrews et al., Reference Andrews, Singhvi, Kailath, Kuhn, Dennis, Tandon and Dhir1998; Jain and Tandon, Reference Jain and Tandon2003), the northwestern Deccan highland region (Kale and Rajaguru, Reference Kale and Rajaguru1987), the southern Ganga (Singh et al., Reference Singh, Sharma, Sharma, Srivastava and Rajagopalan1999), and the Sabarmati River alluvial plains, and the north Gujarat area (Srivastava et al., Reference Srivastava, Juyal, Singhvi, Wasson and Bateman2001) all reported similar records. Juyal et al. (Reference Juyal, Chamyal, Bhandari, Bhushan and Singhvi2006) hypothesized that the climate during floodplain aggradation in MIS-3 was likely comparable to or wetter than it is today based on the regional nature of the aggradation. However, as MIS-2 (29–18 ka) began, hydrological conditions gradually deteriorated as seen in the declining moisture content of the sediments (Fig. 4). Additionally, this time period shows fluvial aggradation in the rivers of western India as a result of lower Indian summer monsoon (ISM) intensity. Interestingly, this was also the time when increased aridity started in the region (Juyal et al., Reference Juyal, Chamyal, Bhandari, Bhushan and Singhvi2006). According to Bhattacharya et al. (2017, and references therein), the Banas River basin experienced a relatively enhanced ISM with fluctuations during the early MIS-2 (25 ka). Similar conclusions can be derived for the lower part of the alluvial sequence in the Saraswati River (dated to 32 ka).
Additionally the lower intensity of ISM and the deterioration of moisture conditions after 25.5 ka and the moisture minimum seen in central Asia between 21.3 ka and 19.8 ka (Herzchuh, Reference Herzchuh2006). Similar conclusions were made from the Guliya ice core records by Thompson et al. (Reference Thompson, Yao, Davis, Henderson, Mosley-Thompson, Lin, Beer, Synal, Cole-Dai and Bolzan1997), who found that high δ18O values suggested an enhanced summer monsoon, and lower values indicated a reduction in ISM. A stronger ISM during the MIS-2 is also indicated by the Arabian Sea records (Schulz et al., Reference Schulz, von Rad and Erlenkeuser1998) and 75 paleoclimatic records from central Asian lakes (Herzchuh, Reference Herzchuh2006; Fig. 11).
Photograph and graphic measured section of the lithostratigraphy of the Pratappura profile from the Dhadhar River (mainland Gujarat, western India), variation of percentages of moisture, Corg, CO3−2, and magnetic susceptibility (χlf), and δ13C plotted with positions in the Pratappura profile. The major climatic records derived from this profile were compared with oxygen isotopic data from the Guliya ice core (Thompson et al., Reference Thompson, Yao, Davis, Henderson, Mosley-Thompson, Lin, Beer, Synal, Cole-Dai and Bolzan1997). Enriched values of δ18O indicate periods of strengthened Indian summer monsoon (ISM) and lower values indicate a weaker ISM (dry phase). Total organic carbon (%TOC) is a proxy for productivity, and therefore is an indicator of monsoon-induced upwelling from the northern Arabian Sea (Schulz et al., Reference Schulz, von Rad and Erlenkeuser1998). Central Asian lake records (Herzchuh, Reference Herzchuh2006) indicate wet conditions during the middle and late Marine Isotope Stage 3 (MIS-3) and dry conditions during the Last Glacial Maximum (LGM).

Zone-II (18–11 ka), which corresponds to the Last Glacial Maximum (LGM), is composed of an increasing sand fraction, a lower CIA, Al2O3, and high CaO values, and mostly stable χlf and Corg values, which indicate that moisture conditions weakened, and an increase in aridity occurred at this time (Figs. 4 and 6). It is clear that moderately weathered sand dated between ca. 27–20 ka in the Mahi River valley and along the southern edge of Thar Desert indicates poor hydrological conditions corresponding to an increase in aridity during the LGM. According to Guliya ice core data in Thompson et al. (Reference Thompson, Yao, Davis, Henderson, Mosley-Thompson, Lin, Beer, Synal, Cole-Dai and Bolzan1997) and records from the Arabian Sea in Schultz et al. (Reference Schulz, von Rad and Erlenkeuser1998), this LGM episode occurred ca. 20 ka.
The phytoliths and χlf in zone-III (11–4 ka) show a noticeable change, with increasing silt and clay percentage primarily derived from the Pavagarh Hills of the Deccan volcanic suite, yet increased moisture content and Al2O3 and δ13C values indicate improved climatic conditions (Fig. 4). It is fascinating to see that this area now had more moisture and charcoal, and that the phytoliths display signs of burning. This suggests that the climate improved slightly becoming wetter, and the material that was needed to form overbank deposits along with charcoal must have been brought by intermittent heavy rains. A minor improvement in climatic conditions is indicated by a slight rise in immobile elements and a shift in the proportion of clay that is dominated by smectite to more clay minerals and a mixed signal from C3 and C4 grasses. ISM intensification during the early Holocene between 11 ka and 9.5 ka from central India was also observed by Kumar et al. (Reference Kumar, Agrawal, Sharma and Pandey2019). Overall conditions, however, continued to be more favorable for winter grasses, demonstrating that regional hydrological conditions were controlled by winter precipitation (Raj et al., Reference Raj, Mulchandani, Bhandari, Maurya and Chamyal2003; Prasad et al., Reference Prasad, Phartiyal and Sharma2007, Reference Prasad, Anoop, Riedel, Sarkar, Menzel, Basavaiah and Krishnan2014; Raj, Reference Raj2007).
Metrics for zone-IV (4–2 ka; Figs. 4 and 6) vary as does the lithology, which consists of alternating black and brown sandy concretized beds. Although phytolith morphotypes indicate a moderately wet pulse near the end of this zone, the fluctuations seen in χlf, % Corg and CO3−2, and δ13C values also imply an increase in moisture content. The beginning of the channel activity (river flow) coincides with the ISM's late Holocene intensification, which appears to have continued sporadically in mainland Gujarat until ca. 2 ka. The Banas River's 1.5 m-deep channel sand was dated to 1 ± 0.1 ka, and paleoflood sediments also gave an identical age that roughly coincides with the Medieval Warm Period (MWP; Bhattacharya et al., Reference Bhattacharya, Shukla, Patel, Rastogi and Juyal2017). Similar evidence of large floods associated with the MWP is reported from the Luni River (Thar Desert; Kale et al., Reference Kale, Singhvi, Mishra and Banerjee2000) and the Sabarmati River (Sridhar et al., Reference Sridhar, Chamyal and Patel2014). In zone-V (2 ka to present), there were very negligible changes in the proxies. The phytolith morphotypes (Fig. 8) towards the top of this zone indicate a change in climate that indicates the advancement of the summer monsoon. Overall, based on a robust laboratory dataset corroborating prior field-based results, we have a generalized idea of what the paleoclimates of this area have been from ca. 30 ka to present. The Pratappura profile sediment sequence is a viable site for determining paleoclimate in this area of India, and multiproxy research helps us to describe the various climatic events of the past ca. 30 ka as outlined above.
CONCLUSIONS
We used a multiproxy approach to analyze the sediments from the Pratappura profile using sedimentological and geochemical characteristics, χlf, δ13C, and phytoliths to determine weathering history, sediment provenance, and to derive a paleoclimatic history of this region of western India. Analyses of the Pratappura profile sediments using multiple proxies show a complex climate and sedimentological history. Silty-sand and sandy-silt facies cluster in the quartz arenite and sub-litharenite categories in a log Na2O/K2O versus log SiO2/Al2O3 plot, indicating low to moderate weathering. The CIA ranges from 55–74 and was plotted against the calculated ICV of 1.50, and samples clustered mainly between subalkali basalt and picrite, indicating the dominance of a mafic component in the sediments. Identical chondrite normalized REE patterns suggest that sediments are well-homogenized, and depleted chondrite normalized light REE (La/Yb < 1) values also suggest the prevalence of a mafic source for sediments in the catchment.
OSL was done for four samples and provided extrapolated dates for the section, and multiproxy data including moisture, χlf, % Corg and % CO3−2, δ13C, and phytolith analyses indicate that the section could be divided into five paleoclimate zones. The climate in the region changed from warm and humid to semiarid conditions between ca. 29 ka to 18 ka, but the LGM period marks the beginning of aridity. The period between ca. 18 ka and ca. 11 ka indicates less available moisture and a commensurate rise in aridity. When monsoon conditions appear in the early Holocene (ca. 11 ka to 4 ka), the climate starts to show an increase in moisture, but a wet phase is only noted between 4 ka and 2 ka. Between 2 ka and present, no discernible change in climate was noted; the regional climate was semiarid through this time.
Acknowledgments
We thank the director at BSIP Lucknow for providing the necessary help and support to carry out the work. We also thank directors at WIHG (Dehradun) and IITM (Pune) for providing analytical facilities. We thank five anonymous reviewers for their valuable comments, thus helping to improve the quality of the article. The current work is a part of the project (SR/S4/ES 21/Baroda Window/P1) of the Shallow Subsurface Study (SSS) program of the Department of Science and Technology (DST), New Delhi. The authors declare that they have no known competing financial interests or personal relationships that could have appeared to influence the work reported in this paper.
Supplementary Material
The supplementary material for this article can be found at https://doi.org/10.1017/qua.2022.39