I. INTRODUCTION
Electron beam-induced deposition (EBID)Reference van Dorp and Hagen1–Reference Randolph, Fowlkes and Rack4 is a direct-write technique characterized by decomposition of surface adsorbed precursor molecules in the vicinity of an electron beam. EBID applications include circuit edit, lithographic mask repair, electrical contacts to nanometer-scale structures, and rapid prototyping of integrated circuit and microelectromechanical system devices. In a recent review by Utke et al.,Reference Utke, Hoffman and Melngailis2 the impact of substrate temperature on EBID processes was identified as a topic of limited research. Several studies have investigated the effects of substrate heating, primarily for metal purity enhancement.Reference Botman, Mulders, Weemaes and Mentink5, Reference Mölhave, Madsen, Rasmussen, Carlsson, Appel, Brorson, Jacobson and Boggild6 Studies examining low-temperature substrates are scarce, and focus on growth rate enhancement.Reference Bell, Falconer, Zhiming and McConica7, Reference Funsten, Boring, Johnson and Brown8 Of these studies on substrate temperature variation, structural properties of EBID deposits, and avenues for material manipulation have not been studied in detail.
Low-temperature substrates in EBID enable multilayer adsorption of precursor, as opposed to mono- or submonolayer adsorption typically encountered in room temperature EBID. Cooling substrates to cryogenic temperatures has been shown to increase EBID growth rates for WReference Bell, Falconer, Zhiming and McConica7 and SnReference Funsten, Boring, Johnson and Brown8 films by as much as an order of magnitude. These improved growth rates are attributed to multilayer adsorption, which increases the probability of electron-adsorbate interactions. Films grown by cryogenic EBID were described in some cases to be “discontinuous,” but the underlying growth mechanisms and the possibility of predictive tailoring deposit structure by growth parameters have not been investigated.
Here, a common EBID precursor, methylcyclopentadienyl-platinum-trimethyl,Reference Park, Nagai, Takai, Lehrer, Frey and Ryssel9, Reference Gopal, Stach, Radmilovic and Mowat10 was used to deposit platinum-containing nanocomposites at cryogenic temperature using a focused electron beam. Three distinct surface morphologies were observed, namely a nanoporous mesh, a smooth continuous film, and a continuous rough-surfaced film. Dependencies of film thickness, microstructure, and surface morphology on electron beam flux and fluence, and Monte Carlo simulationsReference Hovington, Drouin and Gauvin11 of electron interactions with the condensate are used to construct a model of cryogenic EBID, which is contrasted to that of room temperature EBID. It is shown that the surface morphology can be controlled reproducibly by the electron fluence, but is independent of the electron flux (at a fixed fluence) used for exposure.
II. EXPERIMENTAL DETAILS
For this study, p-type Si (100) substrates were rinsed with acetone and deionized water, followed by a 5 min plasma clean using a Fischione Instruments model 1020 with a 25% O2/Argon mixture. Deposits were made using a FEI Nova (Hillsboro, OR) 600 Nanolab dual beam system (base pressure of 6.7∙10−5 Pascal) and a custom LN2 stage operating at −155 ± 5 °C. A standard capillary style gas injection system (GIS)Reference Utke, Friedli, Amorosi, Michler and Hoffman12 was used to introduce the gaseous precursor methylcyclopentadienyl-platinum-trimethyl (MeCpPtMe3) onto the cooled substrate to form a condensate. The thickness of this condensate was controlled by varying the distance between the GIS capillary and the Si substrate, as well as reducing the temperature of the precursor crucible to decrease the vapor pressure (and thereby the flow rate to the substrate). For this work, the GIS-substrate distance was 6 mm and the crucible temperature was set to 26 °C. The GIS valve was opened for 30 s prior to substrate cooling to eliminate any residual gases within the capillary. After the condensate was created, the valve to the crucible was closed to terminate gas flow.
Decomposition of condensed precursor molecules (i.e., “condensate exposure”) was induced with a rastered, 15 keV electron beam. The electron beam energy, current, pixel dwell time, and frame time were fixed at 15 kV, 710 pA, 0.3 μs, and 0.27 s, respectively. The electron beam probe size was approximately 5 nm. Beam line pitch (spacing between rastered lines) was not directly controlled and varied between 10 and 60 nm depending on the dimensions of the exposure. Once condensate exposure was complete, unexposed regions of the condensate were removed by heating the substrate to room temperature. All scanning electron microscopy (SEM) and transmission electron microscopy (TEM) micrographs were taken after the sample was electron exposed and returned to room temperature except where noted in Fig. 1. Cross sections were prepared in situ with a 30 keV Ga+ focused ion beam (FIB). An in situ sample lift-out, and thinning techniqueReference Zaykova-Feldman and Moore13 was used to prepare samples for analysis by high-resolution TEM (HRTEM) using a JEOL 2010F (Tokyo, Japan) operating at 200 keV. Compositional analysis was performed using energy dispersive x-ray (EDX) spectroscopy with a 15 keV and 140 pA beam (measured by Faraday cup before analysis). Standardless analysis with the PhiRhoZ algorithm was used to quantify the EDX spectrum.
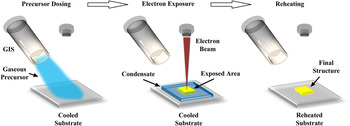
Schematic diagram illustrating the steps in the low temperature EBID process.

Monte Carlo simulations of electron trajectories in MeCpPtMe3 condensate on Si and electron energy deposition curves were calculated using the software package CASINO.Reference Hovington, Drouin and Gauvin11, Reference Toth and Philips14 The 105 electron trajectories were simulated to generate each curve. The density for the condensate was taken from Xue et al.,Reference Xue, Strouse, Shuh, Knobler, Kaesz, Hicks and Williams15 who calculated the precursor density to be 2.32 g/cm3 from crystallographic x-ray data. This value for the density is used as a reasonable approximation for the condensates in this work; however, it should be noted that the experimental condensate density is likely to be lower due to residual hydrocarbon and water molecule incorporation.
III. RESULTS
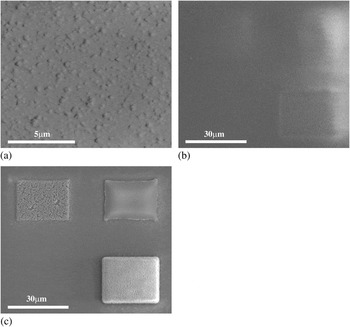
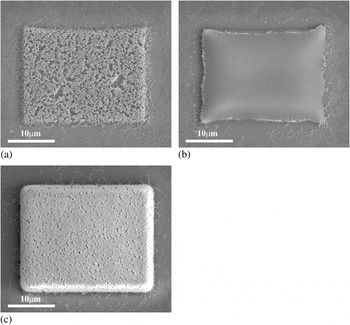
Figure 1 illustrates the steps involved to develop low temperature EBID structures. The substrate is first dosed with precursor to form a condensate followed by electron exposure for patterning. Once the substrate is reheated to room temperature the structures are revealed. Figure 2 shows SEM images detailing the process in Fig. 1, by showing the initial condensate morphology at −155 °C, the exposure step, and the resulting structures at room temperature. Three deposits were made with varying beam conditions to illustrate the three distinct surface morphologies, and the significance of the reheating step. Figure 2(a) illustrates the degree of surface roughness observed at cryogenic temperature. Figure 2(b) shows the same area (also at cryogenic temperature) after the three regions seen in Fig. 2(c) had been exposed by the electron beam. The condensate morphology was not altered significantly by the exposure treatments (the difference in secondary electron image contrast between Figs. 2(a) and 2(b) is caused by charging of the condensate). The area in Fig. 2(b) is shown again in Fig. 2(c) after unexposed condensate had been removed by reheating the sample to room temperature. The deposit morphologies, shown at higher magnification in Fig. 3, are revealed only after reheating. The deposits exhibit three distinct morphologies [Figs. 3(a)–3(c)] referred to hereon as “nanoporous mesh,”“smooth,” and “rough,” respectively.
Plan-view secondary electron images detailing the cryo-EBID process. (a) Pt precursor condensate at −155 °C showing a rough as-condensed surface. (b) Condensate after three regions were beam exposed, showing no immediate change in surface morphology at −155 °C. (c) Same field of view after reheating to room temperature. Irradiated material remains on the surface while nonirradiated precursor desorbs and is removed by the pumping system.

SEM images illustrating three surface morphology regimes deposited at constant flux (7.4 × 106 μm−2s−1) and increasing fluence: (a) nanoporous mesh, (b) smooth, and (c) rough with 1.1 × 10⁸, 3.7 × 10⁸, and 8.9 × 108 μm−2 fluence, respectively.

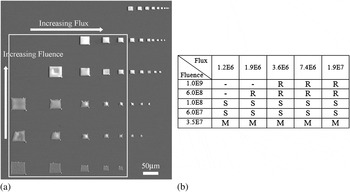
To investigate the boundaries between these regimes, a set of deposits was grown as a function of electron irradiation area and time so as to vary the electron flux and fluence used for exposure. Flux and fluence are defined here as electrons per area per time (current/exposure area) and electrons per area (current*deposition time/exposure area). These are analogous to the usage of “dose rate” and “dose” (or exposure dose) in the lithography community, but are here used to explicitly highlight the electrons-per-area values. A montage of plan-view SEM images of these deposits are shown in Fig. 4(a). In this figure, deposits in each row were fabricated using constant electron fluence, but the flux was increased from left to right by decreasing the exposure area. Constant fluence was maintained in each row by decreasing the deposition time accordingly. Conversely, each column corresponds to constant flux, while the fluence was increased from bottom to top by increasing the exposure time. The surface morphology of each deposit in this montage was classified as rough (R), smooth (S), or mesh (M), as summarized in Fig. 4(b). Within any single row, no variation in surface morphology regime is observed, indicating that the effects of electron flux are negligible (over the investigated range of 1.2 × 10⁶ to 1.9 × 107 μm−2s−1). In contrast, deposits in any single column vary systematically over the fluence range of 3.5 × 107 μm−2 to 1.0 × 109 μm−2. Qualitatively, low, intermediate, and high fluence yields the porous, smooth, and rough morphology, respectively.
Deposits fabricated as a function of electron flux and fluence used for cryo-EBID. (a) Montage of secondary electron images of the deposits taken at room temperature. Each row corresponds to constant fluence but increasing flux (left to right); each column corresponds to constant flux but increasing fluence (bottom to top). (b) Summary of the resulting morphologies within the white rectangle shown in (a) [R, S, and M = Rough, Smooth, and Mesh morphology, respectively. Base flux = .2 × 106 μm−2s−1; base fluence = 3.5 × 107 μm−2.] Deposits outside this area are consistent with these results, but are omitted from the table for clarity.

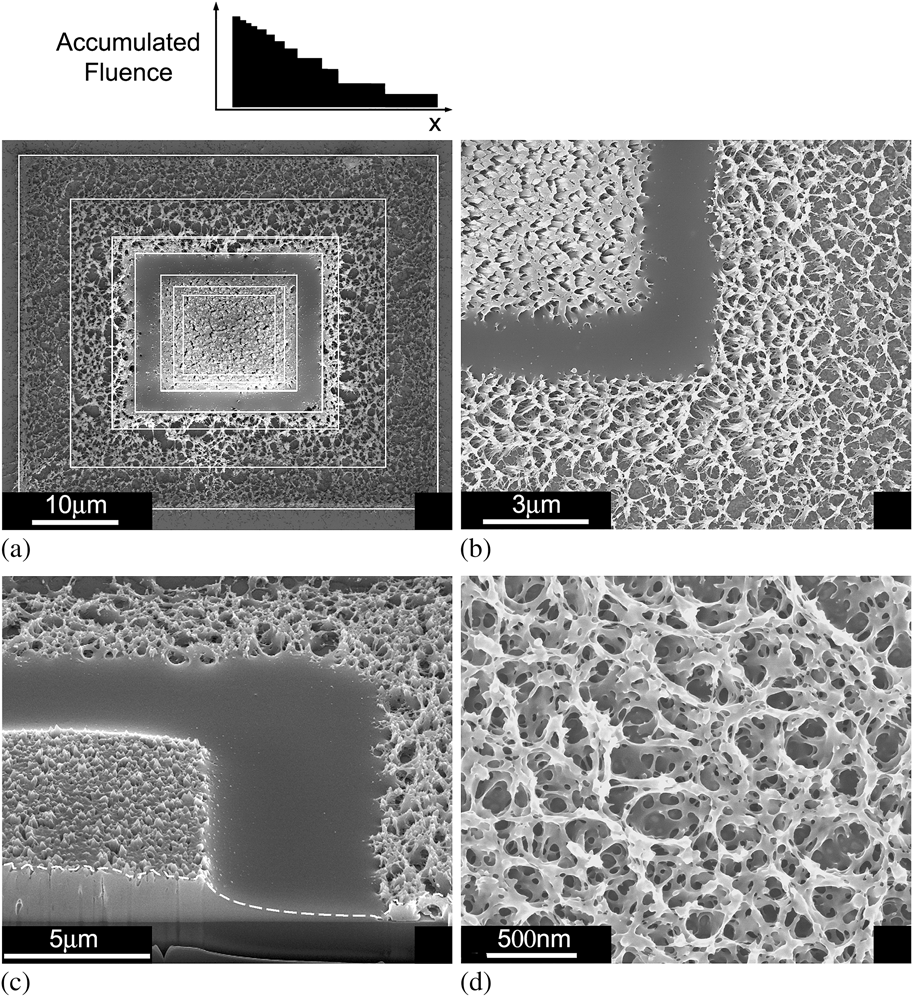
Transitions between the three morphology regimes can be demonstrated dramatically by creating a single deposit with 12 overlaid exposures. The exposure overlay was readily created by manipulating the SEM magnification parameter, such that the exposure area was increased every 5 s. Figure 5(a) shows a plan-view SEM image of a deposit fabricated using the overlay exposure method. White lines have been included on this image to guide the eye in discerning the seven outermost exposure regions. The remaining innermost exposures are not marked for clarity. The accumulated fluence as a function of position for this deposit is shown schematically above the image. The accumulated fluence is highest in the center of the deposit and decreases stepwise. This experiment demonstrates that the boundaries between the morphology regimes are abrupt and distinct, as shown in the higher magnification SEM image in Fig. 5(b).
Deposit fabricated using an electron-beam exposure overlay method. (a) Plan-view SEM image with white lines to indicate several exposure areas. (b) Higher magnification image showing the abrupt boundaries between the rough, smooth, and mesh morphology regimes. (c) Cross-sectional SEM image showing the thicknesses of each morphology regime (dashed white line inserted as a guide for the eye). The thickness of the rough area is approximately the thickness of the original condensate.
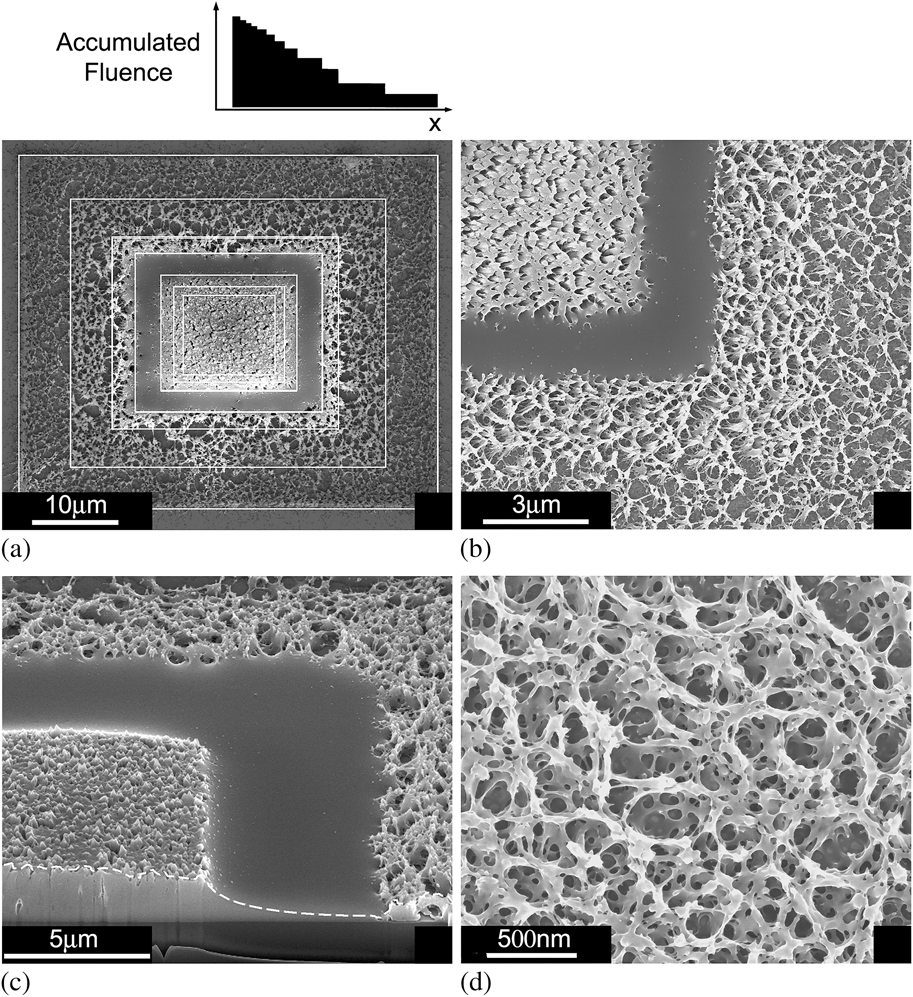
Figure 5(c) shows a 52° tilted view of the deposit taken after cross sectioning using a focused Ga+ beam. From this image, the relative thicknesses of the mesh, smooth, and rough regions can be compared. The thickness of the rough region approximates that of the original condensate (which was constant across the entire deposit). However, some degree of volumetric contraction is expected to occur from bond breaking and the evolution of methane (still volatile at −155 °C), the main byproduct of the electron-Pt precursor reaction.Reference Wnuk, Gorham, Rosenberg, van Dorp, Madey, Hagen and Fairbrother16 Significantly, the thickness of the rough region never exceeds the initial thickness of the condensate, indicating there is no appreciable diffusion of molecules comprising the condensate to the exposure site during electron irradiation (unlike the case of room temperature EBID). The smooth and mesh regions are significantly thinner than the rough region, even though the condensate thickness is constant over the exposed area. Figure 5(d) is included to illustrate to scale and porosity of the nanoporous mesh region.
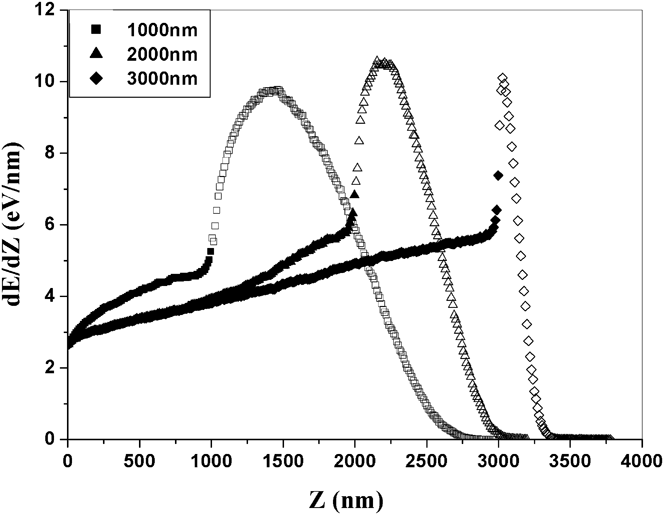
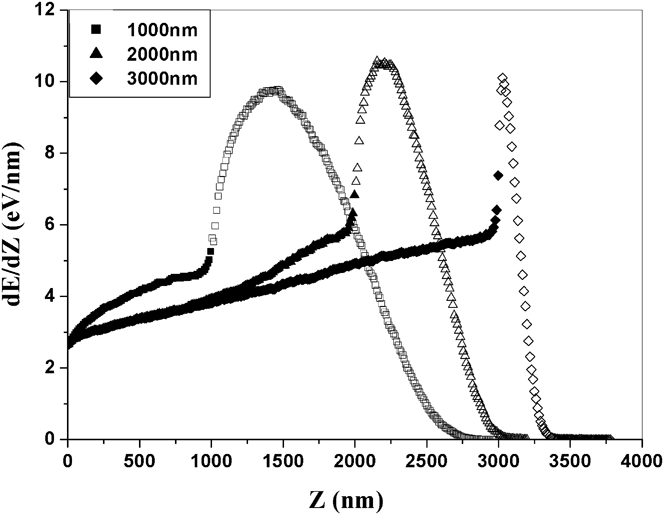
To explain these observations, electron energy deposition curves were calculated using Monte Carlo simulations of electron trajectories in the condensate-Si bilayer. Curves corresponding to initial electron energy of 15 keV and condensate thicknesses of 1000, 2000, and 3000 nm are shown in Fig. 6. The data markers are differentiated between filled and unfilled to denote deposited energy into the condensate and substrate, respectively. Each curve (dE/dZ) of electron energy (E) deposited into the sample per unit depth (Z) increases gradually from the vacuum-condensate interface (at Z = 0) to the condensate-Si interface, where dE/dZ increases abruptly because the electron stopping power of Si is greater than that of the condensate overlayer.
Monte Carlo simulations of electron energy (E) deposited into MeCpPtMe3 condensates (filled markers) on a Si substrate (nonfilled markers) per unit depth (Z) from the vacuum-condensate interface. Condensate thicknesses are shown in the figure; incident electron energy = 15 keV.
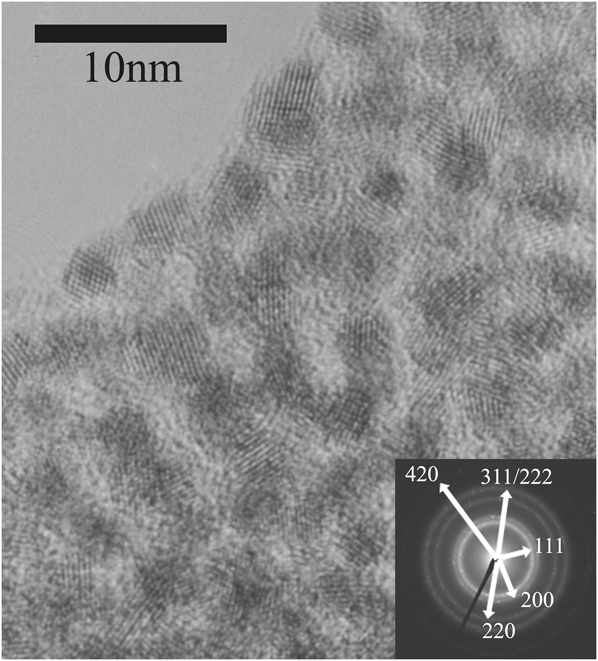
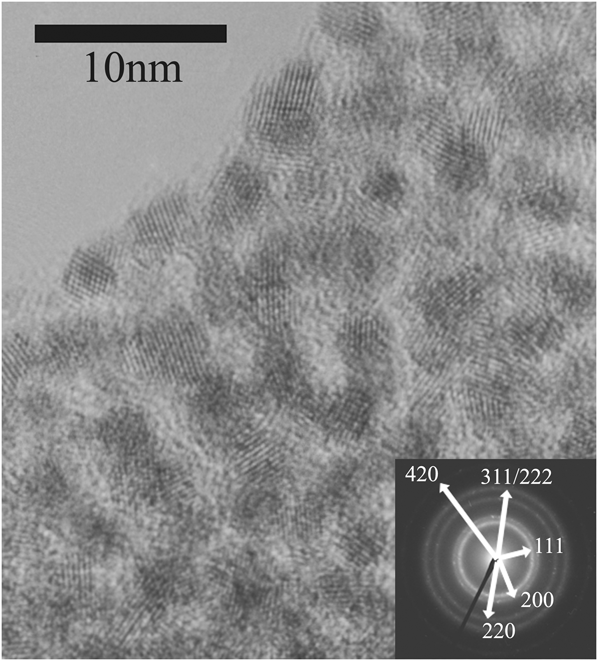
Finally, lamella for HRTEM was prepared from deposits representing each of the surface morphology regimes to compare the microstructure with material grown by room temperature EBID. In all cases, the deposits consisted of nanocrystals embedded in an amorphous matrix, shown in Fig. 7 for a “rough” morphology sample. The inset selected-area diffraction pattern (SADP) shows that the nanocrystals are face-centered-cubic Pt (JCPDS Card No. 04-0802), while the surrounding matrix is largely carbonaceous, as in the case of room temperature EBID.17 No systematic correspondence between nanocrystallite size and morphology regime was found. EDX analysis of the low temperature Pt deposits shows the composition to be 14% Pt, 74% C, and 12% O. Previous EDX studies have shown Pt composition for CpPtMe3Reference Koops, Kaya and Weber19 and MeCpPtMe3Reference Botman, Hesselberth and Mulders20 precursors to vary between 5% and 20% due to the chosen beam energy and current, however the oxygen content was not discussed in these studies and the non-Pt composition is assumed to be carbon. Auger electron spectroscopy was performed by Yavas et al. who found the composition of CpPtMe3 EBID films to be 21.5% Pt, 73% C, and 5.5% OReference Yavas, Ochiai, Takai, Hosono and Okuda21. The low temperature Pt deposits in this study show comparable composition to the previous literature; however, the observed discrepancy in oxygen incorporation (presumably by residual water from the SEM chamber) may have several contributing factors including differences in chamber background pressure, beam conditions used for deposition, and sensitivity of the chosen analytical techniques.
Cross-sectional HRTEM micrograph of a “rough” deposit fabricated by cryogenic EBID. Inset: SADP of the sample.
IV. DISCUSSION
In EBID, growth is initiated by electrons that dissociate precursor molecules. The dissociation rate is governed by the electron energy distribution and the energy dependence of the dissociation cross sections.Reference Yavas, Ochiai, Takai, Hosono and Okuda21, Reference van Dorp, Wnuk, Gorham, Fairbrother, Madey and Hagen22 It can be described in terms of electron energy transfer (or deposition) into a precursor overlayer. At room temperature, adsorbate coverage is typically limited to one monolayer, the overlayer thickness is negligible, and growth can be modeled in terms of the flux of primary, backscattered, and secondary electrons crossing the solid-vacuum interface.Reference Botman, de Winter and Mulders23, Reference Lobo, Toth, Wagner, Thiel and Lysaght24 Conversely, at cryogenic temperatures, the precursor overlayer thickness can be significant because it is limited only by the gas molecule fluence delivered to the substrate prior to electron exposure. Hence, electron transport through and scatter in the overlayer must be accounted for, which can be done by Monte Carlo simulations of electron-solid interactions. Here, we used the software CASINO,Reference Toth and Philips14 which employs the continuous slowing down approximation whereby elastic scattering is simulated explicitly, inelastic scattering is approximated by an energy-dependent stopping power, and the trajectories of low energy electrons (below ~50 eV) are ignored. This methodology is justified as a first order approximation because low energy electrons are excited along a high-energy electron trajectory at a rate that is proportional to its total energy loss rate,Reference Smith, Fowlkes and Rack25 and the excited electron spectrum has a weak dependence on the energy of the high energy electron.Reference Everhart and Hoff26 Hence, the Monte Carlo data provides a valid approximation to the dissociation rate.
The dE/dZ curves in Fig. 6 exhibit a continuous increase between the vacuum-condensate and condensate-Si interfaces, implying a corresponding increase in the precursor dissociation rate with Z. However, the maximum increase in dE/dZ between the two interfaces is approximately a factor of two, indicating that precursor dissociation takes place at a comparable rate throughout the entire thickness of the condensate (rather than in a top-down or bottom-up fashion). This is of particular importance in explaining the morphology and thickness variation of cryo-EBID deposits fabricated with varying electron fluence.
We first assume that the rough morphology thickness is comparable to that of the original condensate. This assumption has been checked by FIB milling the condensate while at cryogenic temperature, and then comparing the thickness once the sample has been reheated. The thickness is found to be constant. Compared to the original condensate thickness (rough region), the thickness of the nanoporous mesh and smooth regions generated by low fluence exposure are thinner, as seen in Fig. 5(c). The combination of the experimental and simulation data in Figs. 5(c) and 6 indicates that dissociation occurs within the entire thickness of the condensate, and that nonvolatile dissociation products can diffuse a significant distance (on the order of microns) within the condensate. The observations that intermediate electron fluence exposures yield continuous, smooth films that are thinner than the condensate [see Fig. 5(c)], and that the electron flux (at a fixed fluence, Fig. 4) does not alter the deposit mesostructure suggest that such diffusion takes place during reheating to room temperature. Critically, if the nonvolatile fragments instead exhibited negligible diffusion, the thickness of the nanoporous films would be expected to be similar to that of the rough region, and smooth films would be expected to have a nanoporous cap consistent with the rough region thickness, due to the gradual increase in dE/dZ with Z seen in Fig. 6.
The formation of nanoporous or continuous mesostructure is likely determined by the concentration of molecules dissociated during exposure, the resulting diffusivity of the dissociation products during reheating, the reaction probabilities between the diffusing species and the substrate, neighboring dissociation products, and solid phase deposited material. Furthermore, the structure of the nanoporous mesh is likely affected by intermittent adhesion to the substrate, and differences between the thermal expansion rates of the deposit and the substrate during reheating.
The rough deposits formed by high electron fluence exposure have a surface morphology and thickness similar to that of the condensate. In the context of the aforementioned model, such deposits are observed when the density of nondissociated molecules is negligible, and the diffusion distance of nonvolatile dissociation products is insignificant prior to bonding with neighboring species.
The microstructure of cryo-EBID deposits (Fig. 7) is similar to that of room temperature EBID deposits in both the nanoparticle size distribution and packing density. Electron fluence was not found to have a clear effect on microstructure. Because both nucleation and growth of the crystallites is thermally driven, small Pt clusters may exist in exposed regions of the condensate at cryogenic temperature. However, crystallite growth and the formation of the observed microstructure will be dominated by diffusion during reheating, consistent with the observed similarity between the microstructure of deposits grown at cryogenic and room temperature. We note that previous reports have shown that the microstructure of deposits grown at room temperature show a dependence on the electron fluence used for growth and for post-growth processing of the deposits.Reference Li, Toth, Tileli, Dunn, Lobo and Thiel28–Reference Li, Toth, Dunn, Moore and Thiel30 Analogous effects may occur if deposits grown at cryogenic temperature are irradiated during and after reheating to room temperature. Such work is, however, beyond the scope of this study.
Composition of low temperature EBID deposits is consistent with previous reports on room temperature EBID, with a Pt concentration of 14%. The concentration of oxygen found in the deposits indicates the possible uptake of water into the condensate. Oxygen may then be codeposited during the exposure step. Further work with carbon and platinum standards will be needed to determine whether the oxygen is incorporated into the condensate or if it is merely the result of exposure to air during transfer between deposition and EDX analysis systems.
The insensitivity of the results in Fig. 4 to electron flux indicates that time-dependent effect like local beam-induced heating cannot explain the observed changes in morphology. Rather, because the morphology is primarily fluence dependent, we conclude that the electron energy density deposited into the condensate (which is proportional to fluence) is paramount.
It is important to note that the low temperature EBID technique shown here draws similarities to electron or ion beam lithography. In the case of low temperature EBID, the condensate acts as the resist for subsequent patterning while the reheating process mirrors the solvating or development process in traditional lithography. In addition, spin-coated metal containing resists have been used for direct write of conducting linesReference Harriott, Cummings, Gross and Brown31–Reference Stark, Mayer, Griffis and Russell33 and metal nanocompositesReference Marqués-Hueso, Abargues, Canet-Ferrer, Agouram, Valdés and Martinez-Pastor34, Reference Abargues, Marqués-Hueso, Canet-Ferrer, Pedrueza, Valdés, Jiménez and Martinez-Pastor35 with electron and ion beams. However, these reports have focused heavily on quantifying proper fluence levels for the evaluation of line widths and electrical properties, without addressing these parameters during “suboptimal” fluence. In this work, we have shown that manipulation of substrate temperature and beam fluence can impact the surface morphology of EBID films, without compromising microstructure and composition. We expect this work to complement and offer additional versatility for future EBID applications.
In conclusion, electron fluence can be used to tailor the morphology of EBID films grown at low temperature, resulting in structures that are not attainable in room temperature EBID. Low fluence leads to a nanoporous structure, while further irradiation yields deposits with smooth and rough surface morphology. The microstructure of all deposits consists of metallic nanoparticles in an amorphous matrix, similar to that of room temperature EBID deposits. The effects discussed in this work can be used to control the morphology of deposits fabricated for specific applications without compromising microstructural-dependent properties
ACKNOWLEDGMENTS
The authors thank Juntao Li, Miguel Rodriguez, and Ruud van den Boom for assistance with the cryogenic setup and useful discussions.