1. INTRODUCTION
Unexpected and underanalyzed interactions between components and subsystems is a causal factor for many catastrophic system failures. While individual component failure modes can be modeled and predicted, the system-level effect of multiple faults across subsystem boundaries (software, hardware, etc.) is challenging to identify. Methods of risk-based and safety-centric design have been developed to address this challenge and impact the design decision-making process. A few methods use qualitative simulation of component behavior to provide an analysis of the system-level impact failures in terms of lost functional capability. Reasoning on the functional effect of failures provides designers with the information needed to understand the potential impact of faults in a risk-informed approach to design.
The challenge of risk assessment at the design stage is the lack of refined system information. Traditional methods of failure and risk analysis rely on statistical failure data and apply methods where expert knowledge of the system is needed to know the impact and path of fault propagation. For this reason, risk assessment traditionally occurs at the validation stage of a well-refined design, where specific component failure probabilities and likely fault propagation paths can be defined. However, to achieve the benefits of early risk-based decision making, several methods of failure analysis based on functional system descriptions have been developed. While some of these design-stage methods use historic failure rates associated with the component types or functions to identify risk (Stone et al., Reference Stone, Tumer and VanWie2005; Grantham-Lough et al., Reference Grantham-Lough, Stone and Tumer2009), others have used a behavioral approach to determine the potential impact of failures (Krus & Grantham Lough, Reference Krus and Grantham Lough2007; Huang & Jin, Reference Huang and Jin2008; Kurtoglu et al., Reference Kurtoglu, Johnson, Barszcz, Johnson and Robinson2008). By including component behavior information in the analysis, these latter approaches can simulate fault propagation and identify the effect of a fault within the context of the designed system. Early design-stage failure analysis is a powerful decision-making tool, allowing designers to make changes to decrease the risk of single, multiple, or cascading faults (Kurtoglu et al., Reference Kurtoglu, Tumer and Jensen2010). However, the functional approach also enables a high degree of failure characterization. Understanding the ways in which a system design can fail provides designers with the information to develop more robust alternatives.
The function failure identification and propagation (FFIP) framework is one of the methods for assessing the functional impact of faults in the early design stage (Kurtoglu et al., Reference Kurtoglu, Johnson, Barszcz, Johnson and Robinson2008). The result of using an FFIP-based analysis of a design is an evaluation of the state of each function in the system in response to a simulated failure scenario. In previous work, these results have been used to evaluate the consequence of different fault scenarios for a system design (Jensen et al., Reference Jensen, Tumer and Kurtoglu2009b; Papakonstantinou et al., Reference Papakonstantinou, Jensen, Sierla and Tumer2011; Sierla et al., Reference Sierla, Tumer, Papakonstantinou, Koskinen and Jensen2012) and for making design decisions based on fault consequence (Kurtoglu et al., Reference Kurtoglu, Tumer and Jensen2010). In this work, we take a different approach. Instead of looking at the functional effect of a single fault scenario, we reason on the total set of effects from different scenarios to make design decisions.
Identifying the system-level functional effect is key to using potential failure behavior information for design decision making. For example, the decision between using two different technologies should be informed by how faults in those technologies and faults in the rest of the system interacting with that technology to affect the mission objectives. For this reason, top-down safety-based design methods such as STAMP (Dulac & Leveson, Reference Dulac and Leveson2005; Leveson, Reference Leveson2011) use the control of undesired system functional states to develop the system architecture requirements. The challenge for top-down methods is providing assurance of completeness in capturing the potential low-level causes that might lead to the undesirable system state. Similarly, with bottom-up simulation methods such as FFIP, interpreting the overall system-level functional effect from a composite set of component-level functional effects is challenging for complex systems. For example, an electrical short is simple to simulate and to identify the functional effect to that component and other components on the same circuit. However, identifying system-level functions affected by this fault is challenging and usually relies on expert knowledge of the system. We see that there is a connection between the top-down and bottom-up approaches, and this paper demonstrates that data analysis and clustering techniques can be used to identify classes of potential system behavior from the simulation at the component level.
To summarize, the overarching objective of this work is to develop a design-stage simulation and analysis tool set that uses simulation data to reason about the functional robustness of systems to potential component faults and fault propagation. This type of approach is intended to enable designers to compare potential system architectures, identify component and subsystem behaviors that lead to undesired system states, and assess the impact of complex fault scenarios. In order to achieve this high-level objective, there are three specific objectives that this presented method addresses:
1. Characterize the impacts of a large space of the potential complex failure scenarios. (In what types of ways does the system fail?)
2. Identify the system-level importance of the sets of potential system failures. (What does each type of failure mean in terms of system functionality?)
3. Determine how this analysis can be used to make system design decisions. (Can we use this data for a systems view of functional robustness?)
By addressing the first objective, this method moves beyond single scenarios analysis and begins to develop a system-level characterization based on simulation of component behavior. The result of completing the first objective is distinct types of system failure analogous to failure modes for the system. However, because these are identified through simulation and data analysis, the types of system failure must be related to the system-level functionality. In this way, the second objective enables this method to link top-down and bottom-up analysis methods. The third objective begins to address how this approach can fit within the overall systems design processes.
1.1. Terminology
Due to the need to use terms that are found and defined differently in multiple disciplines, the following definitions are intended for this paper.
Component: Any physical, software, or human element in a system that has nominal and failure behavior.
Fault/failure mode: A discrete behavior of a component different from the nominal behaviors.
Fault scenario: The set of nominal and faulty component modes provided to the system simulation. Each component is in exactly one state at one time.
Flow: The energy, material, and signal that connects the functions of the system.
Function: The action a designer intends in the system that affects the flow of material, energy, or signal.
Function health state: The evaluation of the relationship between a components behavior and its intended function. With the following categories:
Healthy: Function acts on flow as intended.
Degraded: Function acts on flow but not as intended.
Lost: Function does not act on flow.
No flow: There is no flow on which the function could act (a type of lost).
System state: The set of health states for all functions resulting from the simulation of one fault scenario.
2. BACKGROUND
This section discusses the three technical areas used in this paper and presents some detail of the example system. First, we discuss FFIP, which is the source of the data on which the analysis and clustering methods will be applied. Second, we provide background on the method of clustering data using a k-means algorithm. Third, we present a categorical data-clustering approach for identifying an underlying probabilistic model for the structure of the data, namely, latent class analysis (LCA).
2.1. Function failure analysis in early design
The FFIP framework (Jensen et al., Reference Jensen, Tumer and Kurtoglu2008, Reference Jensen, Tumer and Kurtoglu2009b; Kurtoglu & Tumer, Reference Kurtoglu and Tumer2008; Jensen et al., Reference Jensen, Tumer and Kurtoglu2009a; Kurtoglu et al., Reference Kurtoglu, Tumer and Jensen2010; Tumer & Smidts, Reference Tumer and Smidts2010; Coatanéa et al., Reference Coatanéa, Nonsiri, Ritola, Tumer and Jensen2011; Papakonstantinou et al., Reference Papakonstantinou, Jensen, Sierla and Tumer2011; Sierla et al., Reference Sierla, Tumer, Papakonstantinou, Koskinen and Jensen2012) was introduced as a design-stage method for reasoning about failures based on the mapping between components, functions, and nominal and off-nominal behavior. The goal of the FFIP method is to identify failure propagation paths by mapping component behavior states to function “health.” This approach uses simulation to determine fault propagation and fault effect, thus providing the designer with the possibility of analyzing component and interaction failures and reasoning about their effects on the rest of the system. The two main advantages of the FFIP method are: a functional abstraction that allows it to be used in complex systems employing both software and physical components; and a simulation-based approach allowing analysis of multiple and cascading faults.
An FFIP analysis begins with a functional representation of a system and utilizes the mapping of functions to components in a component structural representation. A system simulation is built following the structural representation. The nominal and faulty behavior of generic components are stored as state machines in a component library. Each state represents a behavioral mode of the component where the qualitative intervals (high, low, etc.) of the input flow attributes are converted to output flow attributes. For example, in the nominal mode of a fuel line, the input flow level of fuel is the same as the output. However, in the blockage fault mode, the output flow level is reduced to zero. Finally, the main contribution of the FFIP approach is the function failure logic reasoner, which relates the input and output attributes of the component simulation to the expected change in the function mapped to those components. The result of the FFIP analysis is an evaluation of the health state of each function in the system. There are four potential health states for a function defined below. These states are based on the concept that a function is the expression of the designer's intent and describes the actions that affect the flows of energy, material, and signal in the system.
1. Healthy: The function affects the flow as intended.
2. Degraded: The function affects the flow different than intended.
3. Lost: The function does not affect the flow.
4. No flow: There is no flow for the function to act on (usually due to an upstream failure).
In FFIP, a failure event is the triggering of one or more component transitions. Based on the behavioral simulation, the functional impact is identified by the function failure logic reasoner. Each event scenario simulated produces one record. These records will be used by the clustering approaches demonstrated in this paper.
2.2. Data clustering
Separating data into clusters or partitions has been a useful activity in the data-mining community to elicit meaning from large data sets (Han et al., Reference Han, Kamber and Pei2006). Starting with the classification of human traits and personality in the 1930s–1940s, clustering analysis continues to be an important tool to enable machine learning. Multiple methods and algorithms have been developed based on different perspectives on the meaning of a cluster (Estivill-Castro, Reference Estivill-Castro2002). There are three main approaches to clustering with multiple methods and algorithms supporting them.
Hierarchical clustering assumes that some category or classification captures all the data and that data points can further be subclassified into more specific groups in a tree structure. In biology, the Linnaeus taxonomy of living things is an example of hierarchical clustering. Hierarchical methods often relate one or more data points by their similarity.
In contrast to hierarchical methods, partitioning methods separate the data space into different clusters without implying a higher level relationship between those clusters. Data points are related based on a measure of the distance between values. Algorithms that implement partitioning identify centroids of the clusters and then group all data points into a predetermined number of clusters based on their distance from that centroid. One method of data partitioning that evaluates the Euclidean distance between data points is k-means clustering (Lloyd, Reference Lloyd1982).
Two significant issues of k-means clustering are that the number of clusters must be selected first and that data points may only have membership in one cluster. To address the first issue, heuristic rules such as choosing k based on the square root of half the data set size can provide an initial assessment (Mardia et al., Reference Mardia, Kent and Bibby1980). Evaluation of the correctness of the value of k can be done through heuristic metrics as well. Variations of k-means known as soft or fuzzy clustering methods use a similar approach but instead provide membership percentages.
The third category of data-clustering methods is model based. These methods assume some structure to the data and try to find the correct statistical model to match that structure. Methods in this category use different means of estimating and finding the maximum likelihood of the data fitting the parameters of a statistical model (Pearl, Reference Pearl2000; MacKay, Reference MacKay2003). These methods assume that the reason some data points are related to other data points is due to some unobserved (or latent) variable. Unlike k-means, data points have a probability of being within a particular cluster based on their dependence to that unobserved variable. There are many variations of model-based clustering depending on the form of the data and the likely form of the clusters. For the analysis of function-based failure simulation data, the most appropriate model-based method is LCA. The details of this analysis and the justification for its use in this work are presented next.
2.3. LCA
Social scientists have used the concept of latent classes since the 1950s (Lazarsfeld & Koch, Reference Lazarsfeld, Koch and Koch1959). Manifest (or observed) variables are the data of empirical studies. A latent variable is one not directly tested but is nevertheless correlated to observations of the manifest variables. If the latent variable is continuous, then methods such as factor analysis and multivariate mixture estimation can be used to find this structure. However, if the latent variables have discrete categories, then the structure fits a latent class model (Vermunt & Magidson, Reference Vermunt, Magidson, Lewis-Beck, Bryman and Liao2004). As an example, survey questions on personal views of several political topics can form the parameters of a statistical model. LCA on the survey data could be used to identify subgroups into which the respondents are classified. Groups identified within this data would likely correspond to labels like “conservative” and “liberal.” There are three main results from performing an LCA. First, each data point has a probabilistic membership to each class of the latent variable (e.g., the respondent's likely political leaning). Second, each discrete variable state is correlated to a latent class (e.g., liberals have a high probability of answering affirmatively to question three). The third component of the LCA output is class membership percentages for the entire data set (e.g., 40% conservative).
Formally, the latent class model is based on the concept that the probability of observing a specific pattern (Y) of manifest variable states y, denoted P(Y = y), is a weighted average of the C class-specific probabilities P(Y = y|X = x), where X is a latent variable with C number of classes. Weighting with the proportion of that class to the latent variable P(X = x) results in Equation (1).
 $$P\lpar Y = y\rpar =\sum \limits_{x = 1}^C P\lpar X = x\rpar P\lpar Y = y \vert X = x\rpar.$$
Further, the manifest variables within a class, Y l are assumed to be locally independent. Therefore, Equation (2) defines the probability of observing a pattern in the L manifest variables within a class.
 $$P\lpar Y = y \vert X = x\rpar = {\prod\limits_{l = 1}^L} P\lpar Y_l = y_l \vert X = x\rpar.$$
Using the political example above, (Y) is the pattern of answers associated with a political group answering the specific questions y. This pattern is independent within each of the discrete political groups in X.
As with k-means data clustering, algorithms for implementing LCA use expectation maximization for a predefined number of groups. Therefore, LCA must be executed iteratively in order to identify the correct number of classes for the latent variables. Identifying the goodness of fit of the latent class model is typically accomplished by examining either the Akaike information criterion (AIC) or the Bayesian information criterion (BIC). These are metrics to estimate the information entropy (information lost) when a statistical model is used to describe reality. The AIC formulation modifies the log-likelihood estimation by the number of parameters, punishing overfitting models. The objective in checking goodness of fit with AIC is to find the minimum of Equation (3), where K is the number of parameters and L the likelihood function for the statistical model. The BIC formulation is similar but accounts for the sample data size.
 $$\hbox{AIC} = 2K - \ln \lpar L\rpar.$$
LCA was chosen as a clustering method over other clustering methods because the manifest variables are the discrete health states of each function in the system. In addition, the hypothesis of this work is that the failure behavior of a system is also categorical. This categorical system-level failure is the latent variable in our analysis. The discrete (and ordinal) nature of the variables rules out other multivariate mixture models.
2.4. Example system
To demonstrate the clustering approaches applied to function failure analysis results, we perform an FFIP analysis on a design concept of an electrical power system (EPS). This example system will be used to simulate numerous fault scenarios, identify the set of functional impacts for each scenario, and apply the clustering algorithms to find patterns of system failure behavior. This EPS example is an early design-stage model that uses batteries to provide power for a set of AC and DC loads. This example is based on the design of the Advanced Diagnostic and Prognostic testbed located at the NASA Ames Research Center (Poll, Reference Poll2007). In previous work, various potential design architectures were compared using a quantified interpretation of the FFIP results (Kurtoglu et al., Reference Kurtoglu, Tumer and Jensen2010). The example used in this work expands upon a similar but less complex example (Jensen et al., Reference Jensen, Hoyle and Tumer2012).
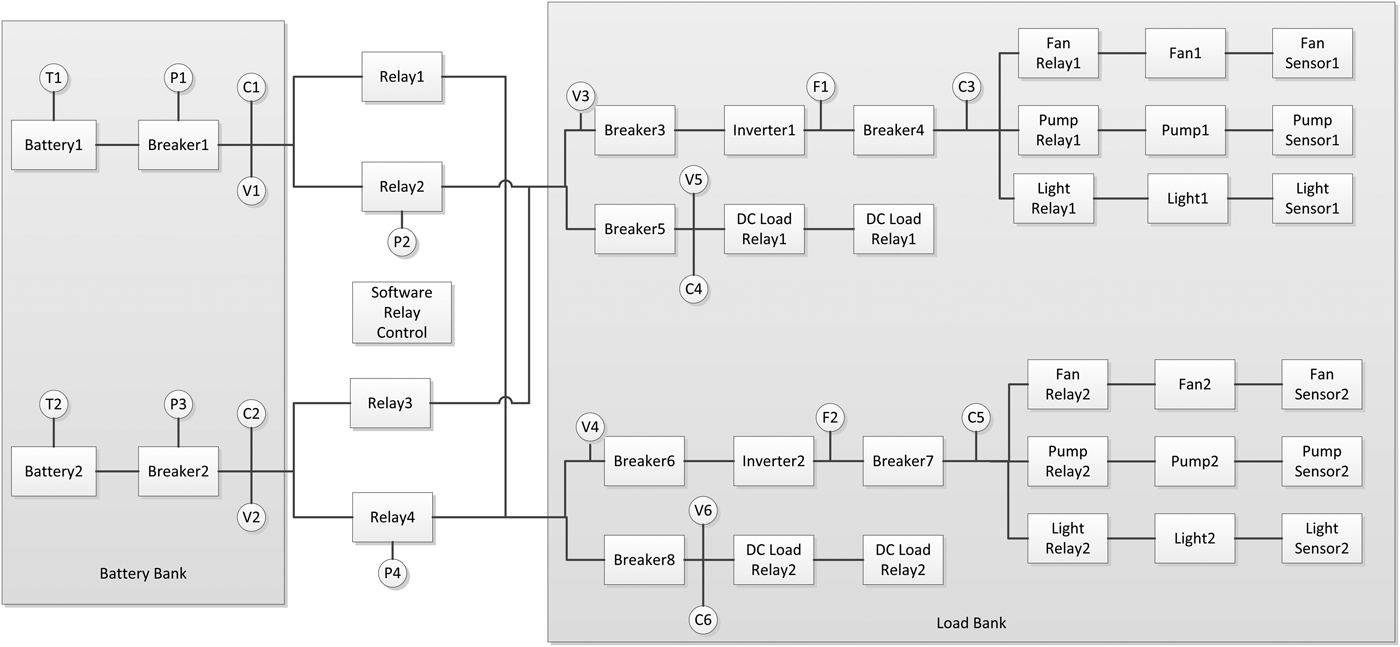
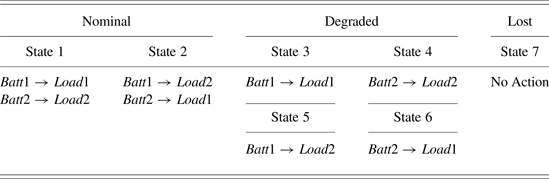
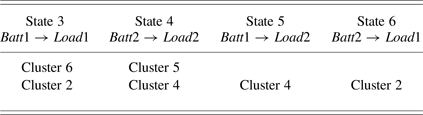
As seen in Figure 1, the concept for the EPS is a fault-tolerant software-controlled hardware system. At the system level, three operational states are recognized: nominal, when both load banks of AC and DC loads are operational; degraded, when only one of the load banks is operational; and lost, when neither load bank is operational. The purpose of the software control is to automatically maintain operation at a nominal state if possible and a degraded state otherwise. By evaluating the voltage levels in both the load banks and both battery banks, the controller decides to open or close relays 1 through 4. The first rule implemented in the software control is that no two batteries can be connected together. For example, relays 1 and 4 cannot both be closed while there is power available from both batteries, or an electrical over current will occur. After this rule, the controller observes the voltage and relay position sensor values to determine which relays to open or close to ensure continued operation. In a fault scenario, the controller can decide to swap power, so that the first battery powers the second load and vice versa, or simply to shut down one line and run at a degraded state. The control logic is implemented with a truth table, where values of sensors correspond to specific relay positions. The control attempts to keep the system in the best operating state as described in Table 1. In this table, the term “Batt1 → Load1” indicates that battery bank 1 is powering load bank 1.
Architecture of the electrical power system used for function-based failure analysis and results clustering.

Operational states the software control attempts to maintain
This fault-tolerant example system enables the identification of high-level system goals such as maintain load operation and illustrates fault propagation over both software and hardware components. This example system is complicated enough to demonstrate the clustering methods, yet it still provides clarity in the impact of complex faults. The FFIP analysis has also been demonstrated on a more complicated system (nuclear power generation; Papakonstantinou et al., Reference Papakonstantinou, Jensen, Sierla and Tumer2011; Sierla et al., Reference Sierla, Tumer, Papakonstantinou, Koskinen and Jensen2012).
3. METHODS
The development and justification of the functional effect analysis using the FFIP methodology is documented in previous work (Kurtoglu & Tumer, Reference Kurtoglu and Tumer2008; Jensen et al., Reference Jensen, Tumer and Kurtoglu2009a; Kurtoglu et al., Reference Kurtoglu, Tumer and Jensen2010; Papakonstantinou et al., Reference Papakonstantinou, Jensen, Sierla and Tumer2011; Sierla et al., Reference Sierla, Tumer, Papakonstantinou, Koskinen and Jensen2012) and will not be repeated here. Because the motivation of this work is to use data analysis techniques to identify underlying system behavior, we begin with collecting the analysis results from the FFIP-based simulation. Other methods of design analysis and simulation could be used instead. The two things that are needed to apply these techniques is a large number of behaviors to simulate (many scenarios) and multiple data points to describe each scenario. FFIP provides this by the ability to simulate single and multiple fault scenarios as well as variations in flow parameters. Further, for each scenario simulated, the result is the health state of each component-level function in the system. These function health states are the variables that describe the system state in response to the simulated scenario. In the following sections, we discuss the simulation and collection of functional effect failure data and the application of the similarity clustering and probabilistic LCA.
3.1. Identifying the functional impact of component faults and interactions
The impact of different component fault modes is identified for the EPS using a simulation of the system built by connecting component models created with the Stateflow toolbox in Matlab Simulink. A scenario is simulated where one or more faults is triggered and the resulting changes in system dynamics are allowed to propagate. The output of each simulation is the function health state of each component-level function. For example, one scenario includes triggering the failure behavior for both batteries. To simulate this scenario, the system simulation begins with all components operating nominally. Then after 25 time steps, the first battery's operating mode is changed to “failed–disconnected.” The effects of this change is the loss of current and voltage from that component. After 50 time steps, the second battery's operating state is changed in the same way. The effect of these changes is allowed to propagate through the system. In this example, the software controller attempts to switch between sources by changing which relays are closed. Finding no solution that provided power to the loads, the software controller defaults to opening all relays as a failure safety measure. After 100 time steps, the simulation is ended, and the final function health states for each component-level function is recorded as the result for that scenario. The injection of failures at 25 and 50 time steps is arbitrary. Through analysis of numerous simulation, it was found that the state machines used need 4 to 8 time steps to reach a steady state. Further, reducing the time between failure mode insertion resulted in no change to the final system state. However, the order of the fault mode changes did affect the final system state results for many scenarios (excluding the one above). Therefore, every order of faults is also simulated. Because this system has 58 component-level functions, the result of simulating a scenario is a vector where each element corresponds to the health state of each of the 58 functions. These function health states are recorded as integers from 1 to 4 to ease data handling.
Using a Matlab script, a large set of scenario results is generated; first simulating each component fault mode as a single fault scenario and then two fault combinations. Three or more fault scenarios can also be generated in the same manner. While simulating three or more scenarios is possible, for this example system the limited number of components resulted in few unique system states for more than two failure scenarios. For this system, simulating every possible combination of two faults is not computationally expensive. However, for more complex systems, there are three possible ways for guiding the scenario selection and simulation process. First, expert knowledge can provide direction on the components that are likely to negatively interact and have known fault causation or simply using proximity. Second, fault modes can be stimulated based on the relationship between causes and symptoms of faults (Jensen et al., Reference Jensen, Tumer and Kurtoglu2009b). This latter approach is based on triggering failure modes in components with fault symptoms (e.g., leaking), which are of the same type as fault causes (e.g., exposure to liquid). Third, the clusters generated using the approach may provide guidance in identifying fault modes that should be simulated together in an iterative approach.
Function failure analysis results are collected from each scenario in a matrix where each row is a separate scenario and the columns correspond to the resulting identified health state of the component functions. For the clustering analysis, three sets of scenarios were generated. The first set of results tested each failure mode of each component, resulting in 193 simulations. The second and third sets of scenarios tested two fault scenarios. The difference between these last two sets was a reversal of the order in which the faults where tested (e.g., battery fault then relay fault, and reversed order in the third set). For the three sets, this generated 37,299 fault simulation records. Both fault orderings were included because it is possible that the order of faults may change the system-level effects.
3.2. Preprocessing to enhance clustering effectiveness
The clustering methods demonstrated in this work are applied to find similarities and structure between different fault scenarios. However, the first level of grouping is to identify which fault scenarios resulted in identical functional results. These represent scenarios that cannot be functionally distinguished from each other. For example, faults in two loads that both cause high current draw can trip a breaker. The large number of combinations of two-load faults results in a large set of identical faults, that is, they all result in the same tripped breaker and subsequent loss of power. This grouping is accomplished through a simple sorting algorithm that groups identical scenario results into bins. Selecting one scenario result from each bin represents the set of unique system states. When applied to the EPS example system, the 37,299 total scenarios were sorted and 3509 unique system states were identified. The significant reduction reflects a large number of identical functional impacts. Many of these identical impacts are related to faults in the sensors, which all had five failure modes but resulted in little effect to the system because the controllers that use those sensors were not simulated. The exception to this was failures in the sensors used by the controller, where faults did result in a change in the behavior of the system. The unique system states represent one or more failure scenario results and are the data provided to the clustering methods.
3.3. Clustering of results based on functional similarity
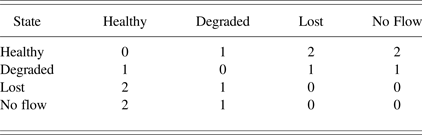
The motivation for implementing similarity clustering is to identify groupings of failure scenarios and aid designers in creating robust mitigation methods. For example, if a system designer knows of a particular undesirable system state, then finding all scenarios that lead to a similar functional state can identify if adequate control methods have been implemented. In order to identify the relationship between two system states, we must develop a metric of distance between function health states. In data-clustering methods, the distance between variables can be determined based on the Euclidean distance between the variable values ( $Distance = \sqrt {{a^2} + {b^2}} $). However, the values chosen to represent health states are categorical numbers not nominal numbers, which violates an underlying assumption in the Euclidean formulation. Therefore, we introduce a functional distance metric based on functional impact. A relational table (Table 2) is generated to define the similarity between function health states. For this analysis, we identify “Lost” and “No Flow” as having no significant functional difference to the system. Here, designers could choose to increase the distance of off-nominal states to effectively punish and group those scenarios as being worse. Because a low system-knowledge approach is being used for this example, all states have a single unit of difference. For example, we can consider a system with two functions and compare the similarity of two fault scenarios. If the resulting system state from Scenario 1 is {Healthy, Lost} and the system state from Scenario 2 is {Degraded, NoFlow}, then the Euclidean distance between these two using the relation matrix in Table 2 is
 $\sqrt {{1^2} + {0^2}} $, or 1.
Relational matrix for identifying the distance between function health states
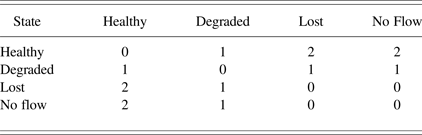
Table 2 is one way to quantify the qualitative distance between functional health states. The k-means clustering algorithm was also applied to the same simulation results, using different distance values and where “No Flow” and “Lost” were not equivalent. The cluster centroid and distances between centroids changes when this scale is changed. However, when comparing the population of scenarios between clusters using different distance matrices, the average error is about 0.5%. This is within the normal variation of the algorithm when repeated with the same relational matrix. As a result of this finding, it is clear that the concept of functional similarity is strongly dependent on the scale used in this relational matrix. However, population of the clusters and the resulting meaning of those clusters are consistent across scales.
3.3.1. Results of similarity clustering
The total distance is calculated by summing over the distance for each function health state. A weighting for functional importance could be incorporated into this step. However, for this analysis each function is given equal importance. This algorithm identifies the functional similarity using Table 2 for each low-level function. Because there is no way to know a priori how many clusters to expect, we repeatedly call the k-means algorithm to cluster the data using 1–10 clusters. In addition, the algorithm is replicated 100 times for each clustering to avoid local minimums. There are several recognized methods of identifying the appropriate number of clusters. The first approach implemented is the “knee method” (MacKay, Reference MacKay2003), where the within-cluster sum of square distance to the cluster centroid is plotted. When additional clusters do not substantially change the within-cluster sum of square, there is no need to further cluster the data. Using the EPS example data, the inflection point appears between 5 and 7 clusters (see Fig. 2a). This ambiguity results in the need for a second cluster validation method. By comparison of the dispersion of the scenario similarities within a cluster and the dispersion of the impacts of those scenarios, it is possible to identify the appropriateness of the clustering groups. For this work, a plot is developed where cluster centroids are plotted against the sum of their function health states normalized by the total number of functions. That is, a vertical value of 1 indicates that all functions are at the healthy state (a nominal scenario). If all component functions in the system were lost in a scenario, then the normalized impact would be 4. Vertical position gives an estimate of the scope of the system affected by the fault. Each scenario in a cluster is then plotted based on a horizontal position representing the distance of that scenario to the cluster centroid and a vertical position based on the normalized sum of function health states. Selecting to use five clusters for the k-means algorithm, the plot shown in Figure 2b illustrates the variance of the distances from the cluster centroid in the horizontal direction and the variance of the scenario impacts in the vertical direction.
Summary of results for applying a modified k-means clustering to the unique system failure states. (a) The sum of the within-cluster square distance of scenarios to the centroid of their respective cluster. (b) Graphing clusters based on their distance from centroid and total scenario impact with five clusters. Cluster 3 has both vertical (impact) variance and horizontal (similarity) variance and could be separated into two clusters.
For this example system, Table 3 records the mean and coefficient of variation for each cluster for the distance from the centroids and the normalized impact of the scenario. The coefficient of variation (CV) is the ratio of the standard deviation and the mean of a population, where larger numbers indicate greater dispersion of the data. For the distance metric, the CV indicates how similar the scenarios in the cluster are to each other. For the impact metric, the CV shows the variation in the impact for scenarios in that cluster. Based on this data, the scenarios with the least similarity are in clusters 3 and 5. Similarly, the most diverse set of impacts is in found in clusters 1 and 3. Based on this analysis, cluster 3 has the potential to have very dissimilar scenarios with somewhat significant differences in total functional impact. Because there was ambiguity in the correct number of clusters between 5 and 7 and the potential for cluster 3 to be subdivided, 6 clusters where selected for the analysis of scenario similarity.
Evaluating cluster distance and impact mean and coefficient of variation
3.4. The LCA method
The second method of grouping the failure results is focused on identifying patterns of failure behavior. For this method, a LCA is performed on the 3509 unique fault simulation results using the package poLCA (Linzer & Lewis, Reference Linzer and Lewis2011a, Reference Linzer and Lewis2011b) for the statistical software tool R (R Development Core Team, 2011). The poLCA package treats the manifest variables as categorical. The manifest variables in this analysis are the function health states, and the latent variable describes the system failure behavior. Similar to the k-means clustering, the number of latent variable classes must be specified prior to the analysis. Therefore, an iterative approach is also taken to fit multiple latent class models with different numbers of classes. In order to avoid local maxima, the poLCA classification algorithm is executed 10 times for each specified number of classes. The correct number of classes is identified as the latent class model with the lowest AIC and the lowest BIC.
Once the correct latent class model is identified, there are three desired outputs from the LCA. The first output is a set of conditional probability tables for each manifest variable. These tables identify the probability of finding a manifest variable at a specific state for each category of the latent variable. In the context of this analysis, this indicates that if a failure event is of a particular class of system failure, then the function is likely to be in a specific state (healthy, degraded, etc.) The second output uses these probability tables to identify the posterior probability of a scenario belonging to each class of the latent variable. This is the output used for the probabilistic classification of the failure events. Third, the proportion of each classification is reported. This leads to the identification of the class with the largest membership of failure events.
3.4.1. Results of model-based clustering
The AIC and BIC tend to flatten when evaluating latent models with more classes. Implementing a LCA on the example system data set, minima of AIC and BIC can be seen at five classes and eight classes. Unlike k-means clustering, LCA can identify probabilistic membership of scenarios into each class. Due to the low level of emergent behavior in this system, scenarios were classified into each class with very high confidence. The classification of individual scenarios in five or eight latent classes was compared, and five classes was selected due to the tendency to split 100% confident classification in the five-class model into two or more groups with partial classification in the eight-class model.
The meaning of the different classes is not directly found but must be inferred from the resulting groups. That is, if the system is found to have five different classes of failure, providing a description of those failure classes cannot be generated from the analysis but requires expert knowledge. The normal approach in an LCA is to compare the probabilities of observing a particular variable (function) state within a class to develop descriptions for that class. However, given 58 function variables that each have four different states, this task can be very challenging and is not scalable to large systems. Instead, by comparing the classification provided by LCA to the clustering found through the modified k-means, these groups can be readily identified. This will be discussed in the next section.
3.5. Comparing and validating clustering methods
The modified k-means clustering partitioned all of the unique scenario result states into six clusters. Each scenario result then has two properties: the normalized total impact of that scenario and the distance of that scenario from the theoretical centroid of the cluster in which it belongs. This distance is a measure of functional similarity over the identified 58 functions in the space. Scenarios very near the centroid are the “typical” scenarios for that cluster.
The result of the LCA model is a predictive description of the latent failure behavior and the probabilities of observing a particular function's state. Comparing this model-based approach to the k-means approach has two benefits. First, LCA provides a mathematical validation of the partitioning of the k-means method when the two clustering methods agree. Second, the centroid of the k-means cluster can be used to identify the meaning of the matching LCA cluster.
In Figure 3, the k-means clusters are plotted based on total normalized impact and their distance from the cluster centroid. The classification of scenarios by the LCA and the modified k-means was inconsistent for 26 of the 3509 unique scenarios. The scenarios that where classified differently by the two methods are noted with diamonds in Figure 3. Because this plot compares similarity and normalized impact, some of the markers overlap. This means that these scenarios are equally different from the cluster centroid and affect the same number of functions. It does not mean that the final system state of these scenarios is identical.
Comparing the clustering found through the k-means and latent class analysis method. Discrepancies are marked with diamonds. Note that some markers overlap.
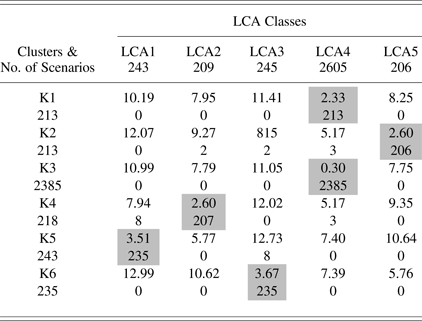
There are two metrics for evaluating the consistency of the clusters found by the two algorithms. In Table 4 both metrics are shown for the five class LCA results and the six clusters from the k-means algorithm. Using the first metric to compare if the scenario populations are consistent, the union of cluster membership is evaluated. In Table 4, the number below each cluster name is the total number of scenarios classified into that cluster or class. The integers within the table show the membership union. For example, two of the scenarios found in the third LCA class are also found in second cluster from the k-means algorithm. The numerical order provided by the algorithm is random. The second metric for comparing clusters is the distance between centroids. Because the LCA gives a probability distribution of health states for each function as the centroid, it cannot be directly compared to the single–value centroids from the k-means algorithm. Instead, the centroid of the resulting classification from the LCA is used. That is, if a class contained scenarios 1–3, then the centroid is based on the centroid of those three scenario results and not the probabilistic centroid of the model of that class which the LCA algorithm used to fit scenarios 1–3. In Table 4, the centroid to centroid distance is reported for each cluster and class as a real number in units of the distance between functional states. From Table 4, both metrics identify the same overlap in the k-means clusters and LCA classes (as indicated in the colored cells). Using this example, it is clear that the fourth LCA class is the combination of first and third k-means clusters.
Comparing the centroid to centroid cluster distance and scenario membership overlap
3.6. Relating clusters to system-level functionality
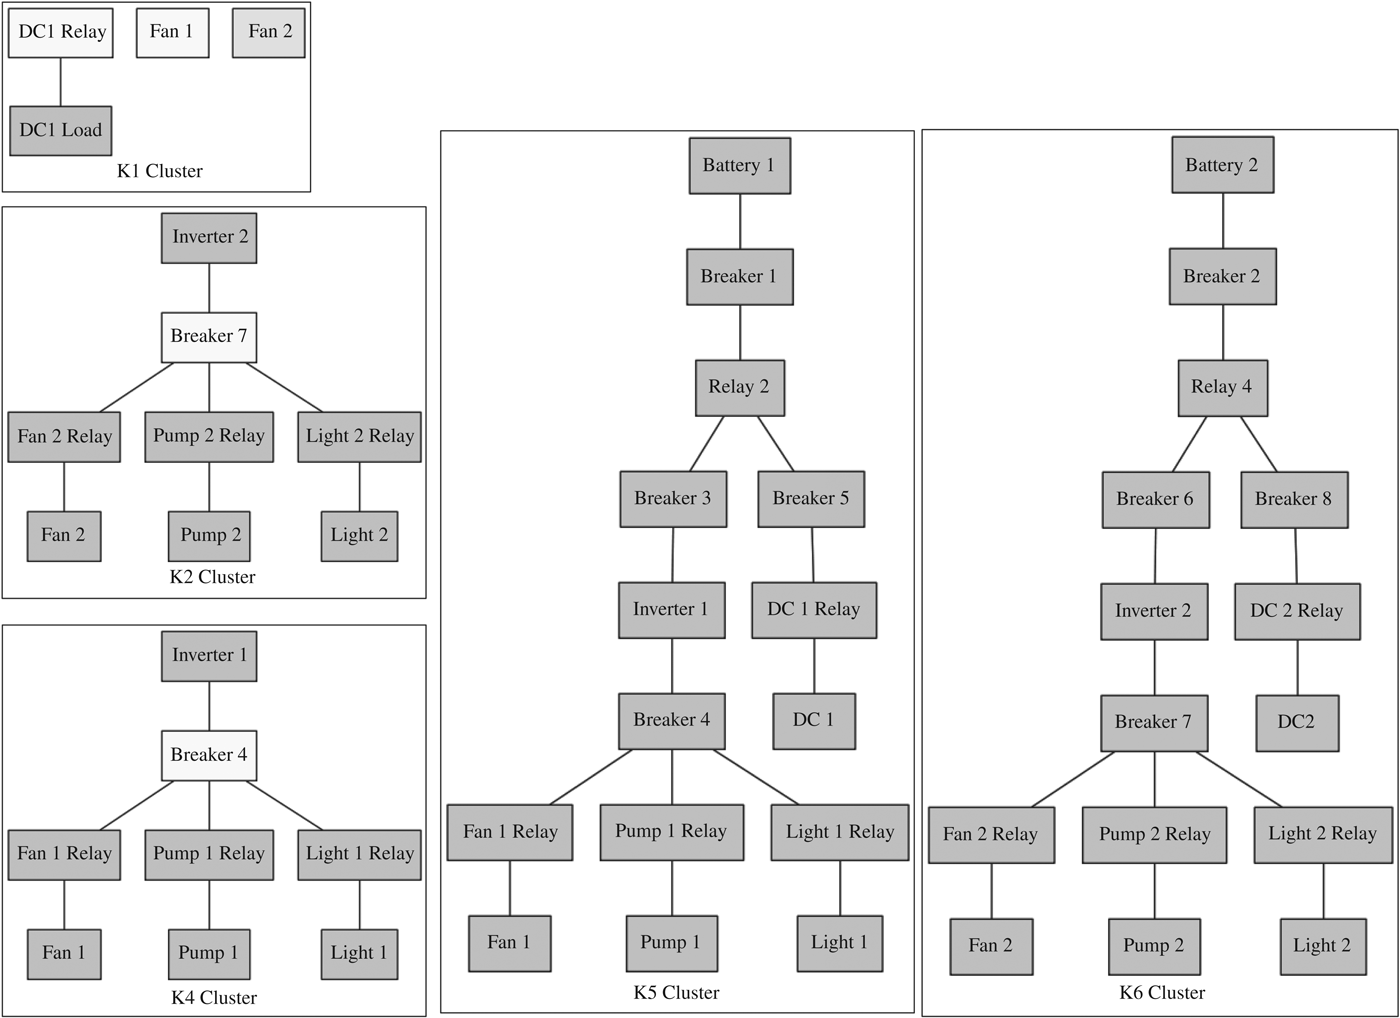
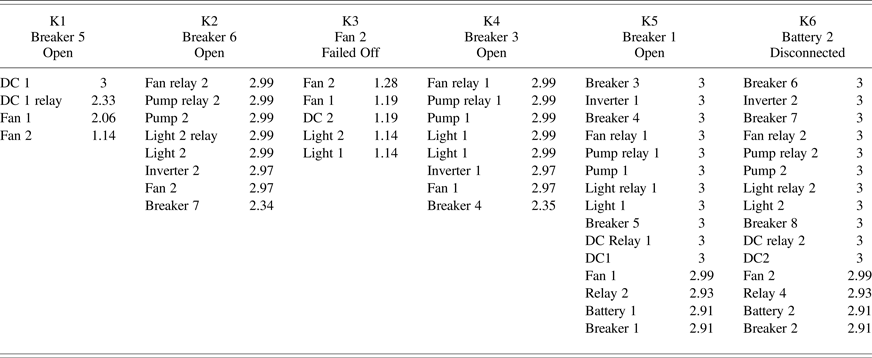
The centroid of each cluster found through the modified k-means analysis represents a point in the functional state space defined by 58 functions. In this space, each function may have the value between 1 and 3, representing nominal, degraded, and lost or no flow, respectively. By observing what scenario is closest to the cluster centroid and what functional dimensions have the largest impact for a cluster, the meanings of the clusters become apparent. In Table 5 the k-means clusters are sorted so that the highest functional impacts are grouped together. All component functions that do not appear in Table 5 have values near 1 and are considered predominately nominal for the scenarios in that cluster. In addition, the representative scenario for that cluster is also listed in the second row. The nonnominal functions are listed for each cluster, along with the centroid's location along that functional axis. By looking at these characteristic functions and the health states for each cluster centroid, the clusters can be described in terms of their dominant system-level effects. Thus each cluster is defined by a set of functions in some off-nominal health state. Although the clustering algorithm identifies that there are dependencies between these functions (and thus clusters them together), it cannot directly reveal causality. For this reason, we take the component-level functions identified in each cluster and use the model to organize the connectivity of the graph shown in Figure 4. Care should be taken not to interpret this as the direction of fault propagation. Instead, Figure 4 shows the relationship between the functional dependencies in the clusters and the physical system architecture. Finally, as can be seen in Table 5, the K3 cluster centroid does not have any characteristic functions in the degraded or lost state. This means that scenarios within this group have few failures that affect multiple functions and there are minimal dependencies between the faulty states of functions. Because the degraded and lost state functions are used to characterize the clusters, the K3 cluster is not included in Figure 4.
The clusters identified through the modified k-means and latent class analysis are mapped to the system model.
Off-nominal functional impact for each cluster and representative scenario
4. RESULTS
In this section, we will present how the results of conducting the clustering approach address the three objectives of characterizing the impacts of a large number of failure scenarios, identifying the system-level meaning of those characterizations, and determining how this analysis can be used to make system design decisions. The first objective of characterization is accomplished through identifying an underlying pattern of failure behavior exhibited in the system states that result from numerous fault simulations. This underlying pattern of behavior is found through applying the LCA to the set of unique systems states. The result of applying the LCA to the 3509 unique systems states that result from fault-scenario simulation for the example system best fit a model with five discrete classes of system failure. Further, the probability of scenarios fitting exactly one of the five classes is very high (most are 100%). This confirms that five different patterns of system failure emerge from the simulation of combinations of component fault behavior. Because the LCA approach fits a structure to the data, each class is fully defined by the probability of a function being at a health state. The health state of a function as a result of simulating a scenario is deterministic and has a known value after simulation. However, the class of system failure is a model where each function has a probability of being at each health state. The system-level failure behavior classes are the result of the interactions of component behaviors. For this reason, the five classes represent emergent failure behavior observed at the system level in the scenarios simulated. This does not represent all potential emergent behaviors of the system. The clustering algorithm uses the simulation data, and thus if the behavior is not present in the simulation, it will not be identified by the algorithm. However, due to the large number of scenarios that form the data for each class model, this approach does provide some confidence that this system will not experience significantly different behavior. While the LCA-based clustering was able to address the first objective by finding underlying classes of system behavior to characterize scenarios, those classes must also be related to the system-level functions of interest.
The second objective, to identify the system-level meaning (for designers) of the classes of behavior, is accomplished using a k-means clustering on scenario impact similarity. By using the cluster centroids, each cluster is described with a set of functions and their health state. Limiting the focus to degraded and lost functionality provided five of six clusters that can be used to relate the system functionality to the scenario clusters. Figure 4 shows the characteristic functions and their health states for each cluster and uses the system model to identify physical connections. The third cluster centroid did not exhibit consistently degraded or lost functionality and is not included. By comparing the system model to the cluster's representative functions, the relation to system-level functions begins to emerge. For example, the scenarios classified in Cluster 4 are predominately scenarios affecting the first load bank. When certain fault scenarios result in loss of power to that load bank, the function of those components is lost or degraded. For this simple system, this demonstrates that, without a priori knowledge of component connectivity, the clustering approaches identified behavior-based connections. For more complex systems with emergent behavior, these connections could be identified in components in different subsystems where interactions may be harder for designers to predict.
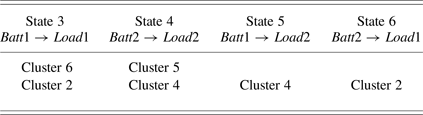
The third objective of this work was to determine whether the discrete failure behavior of the system identified through the clustering analysis could be used for system-level design decision making. As described in Section 2.4, the example system is designed to be fault tolerant where the software control attempts to operate as many of the loads as possible. The software control was designed to recognize and operate the system at the best available of the seven potential states identified in Table 1. Comparing these seven control action states to the clusters provides an assessment of the effectiveness of the system architecture and control. Table 6 shows how the degraded control states address faults from certain clusters. One example of a design decision that could be made after application of this analysis is to redesign the architecture and control to address the individual load faults that are seen in Cluster 3. The application of this approach has shown that the current control method addresses four of the fundamental failure behaviors of the system but has no specific action states to address the other two.
Relation of degraded software control states to scenario clusters
Finally, the small set of scenarios that k-means classified in Cluster 5 and that the LCA grouped in cluster 6 (see Fig. 3), correspond to scenarios where both battery banks could provide no power. These special scenarios that are hard to cluster indicate important scenarios for the system designer to investigate. For this system, scenarios where both batteries are disconnected (and other similar scenarios) are unrecoverable by the software control. Based on the probability, and the consequence of those faults, designers may want to redesign the system redundancies.
5. CONCLUSIONS
This paper proposed two different approaches for clustering the results of a function-based failure analysis method in the early design stage. In contrast to others methods, which focus on single faults or single failure scenarios, the goal of this work is to characterize a design's overall failure behavior. The results of implementing these clustering approaches on an example fault tolerant, software-controlled EPS demonstrates the ability to both identify system-level failure behavior and use the classification of that behavior for design decision making.
The first clustering approach was a modified k-means algorithm, where the distance between failure scenarios was determined based on the functional similarity of the impact of those scenarios. This method partitions the fault scenarios into discrete clusters. Each cluster has a centroid, which is the representative set of functions and their health states for that cluster. The second clustering approach was a model-based method that used LCA to identify a latent variable with a set of discrete classes. The latent variable is a single unmeasurable variable that describes the system's failure state or failure modes. The LCA provides a probabilistic model that is used to characterize the system behavior. By comparing these methods, the k-means clustering was mathematically validated when the scenario groupings agreed with the LCA classifications. Further, the challenge of describing the system failure modes found through LCA is addressed by using the centroids of the corresponding k-means clusters.
The example EPS describes how the designed control addressed some but not all of the system failure behavior modes. When informed by other variables such as cost, this could be used in a multiobjective decision-making process. A future challenge that this work can address is that large-scale system modeling may be impossible at the component fidelity level. However, the LCA classes are models of the system state and could be used as abstractions for the component details. For example, the EPS can be described as having a few nominal modes and the identified five failure modes. This simplified model can then be incorporated into a larger model without the need to specify low-level component behavior. In addition, more work is needed in applying the presented methodology to complex systems to develop a relationship between the completeness of the analysis and the number and types of failures to simulate.
The objective of this work is to aid designers in identifying the potential system-level failure behaviors and use the classification of those behaviors to improve system design. By using data analysis techniques on large sets of design-stage analysis data, designers can make better risk-informed decisions and provide stakeholders with safer systems.
ACKNOWLEDGMENTS
This research was supported by NASA through the Systems Engineering Consortium subcontracted through the University of Alabama–Huntsville (SUB2013059). Any opinions or findings of this work are the responsibility of the authors and do not necessarily reflect the views of the sponsors or collaborators.
David C. Jensen is an Assistant Professor in the Department of Mechanical Engineering at the University of Arkansas. He attained PhD, MS, and BS degrees in mechanical engineering at Oregon State University. He also leads the research effort for the Complex Adaptive Engineered Systems Research Laboratory. He has worked extensively in modeling, simulating, and validating complex engineered systems. His research has been supported by awards through NSF, NASA, the Air Fore Office of Scientific Research, and DARPA. Dr. Jensen's teaching and research are centered on design and mechanics, complex system design, and risk and safety in complex system design.
Oladapo Bello is a doctoral student and has worked in the Complex Adaptive Engineered Systems Research Laboratory at the University of Arkansas since January 2013. He is currently assisting in research relating to reliability analysis of complex systems. His Master's research work covered the identification of pipe blockage using modal analysis and simulation and computational fluid dynamics at the University of Manchester.
Christopher Hoyle is an Assistant Professor and Arthur E. Hitsman Faculty Scholar in the School of Mechanical, Industrial and Manufacturing Engineering at Oregon State University. He attained a PhD in mechanical engineering from Northwestern University, an MS in mechanical Engineering from Purdue University, and a BS in general engineering from the University of Illinois. Dr. Hoyle spent 15 years in industry as a project engineer and engineering manager, concerned primarily with electronics packaging and with managing the trade-offs between performance, manufacturability, and cost. His research is in the areas of decision-based design (linking consumer preferences and enterprise-level objectives with the engineering design process), uncertainty quantification and management, and complex system design. Areas of technical expertise include uncertainty propagation methodologies, Bayesian statistics and modeling, stochastic consumer choice modeling, optimization, and design automation.
Irem Y. Tumer is a Professor and the Associate Dean for Research and Economic Development in the College of Engineering at Oregon State University. She was previously a Research Scientist and Group Lead in the Complex Systems Design and Engineering group in the Intelligent Systems Division at NASA Ames Research Center. Professor Tumer was also involved in Project/Program Management in various NASA Programs including Intelligent Systems, Engineering for Complex Systems, Aviation Safety, and the Constellation Programs. She received her PhD in mechanical engineering from University of Texas at Austin in 1998. Dr. Tumer is Associate Editor of ASME's Journal of Mechanical Systems. Her expertise touches on systems engineering, model-based design, risk-based design, system analysis and optimization, function-based design, integrated systems health management, and vibration monitoring, which has resulted in numerous journal and refereed conference publications. Her research focuses on the overall problem of designing highly complex and integrated systems with reduced risk of failures, developing formal methodologies and mathematical frameworks to help understand and enhance complex system design.