1. Introduction
A mass extinction occurred in the Guadalupian epoch (Jin, Zhang & Shang, Reference Jin, Zhang and Shang1994; Stanley & Yang, Reference Stanley and Yang1994; Clapham, Shen & Bottjer, Reference Clapham, Shen and Bottjer2009), called the end-Guadalupian mass extinction or pre-Lopingian crisis (Jin, Zhang & Shang, Reference Jin, Zhang and Shang1994; Stanley & Yang, Reference Stanley and Yang1994; Shen & Shi, Reference Shen and Shi1996, Reference Shen and Shi2002; Wang & Sugiyama, Reference Wang and Sugiyama2000) or mid-Capitanian mass extinction (Wignall et al. Reference Wignall, Védrine, Bond, Wang, Lai, Ali and Jiang2009b; Bond et al. Reference Bond, Wignall, Wang, Izon, Jiang, Lai, Sun, Newton, Shao, Védrine and Cope2010, Reference Bond, Wignall, Joachimski, Sun, Savov, Grasby, Beauchamp and Blomeier2015). This bio-crisis affected marine taxa including fusulinids, small foraminifers, corals, brachiopods, bivalves and ammonoids (Jin, Zhang & Shang, Reference Jin, Zhang and Shang1994; Wang & Sugiyama, Reference Wang and Sugiyama2000; Weidlich, Reference Weidlich2002; Isozaki & Aljinović, Reference Isozaki and Aljinović2009; Wei et al. Reference Wei, Chen, Yu and Wang2012; Hada et al. Reference Hada, Khosithanont, Goto, Fontaine and Salyapongse2015; Zhang, Wang & Zheng, Reference Zhang, Wang and Zheng2015). Several geological events have been proposed as the main cause of the mass extinction, including Emeishan volcanism (Zhou et al. Reference Zhou, Malpas, Song, Robinson, Sun, Kennedy, Lesher and Keays2002; Wignall et al. Reference Wignall, Sun, Bond, Izon, Newton, Védrine, Widdowson, Ali, Lai, Jiang, Cope and Bottrell2009a; Sun et al. Reference Sun, Lai, Wignall, Widdowson, Ali, Jiang, Wang, Yan, Bond and Védrine2010), large-scale sea-level fall and loss of shallow-marine habitat (Chen, George & Yang, Reference Chen, George and Yang2009; Wignall et al. Reference Wignall, Védrine, Bond, Wang, Lai, Ali and Jiang2009b; Qiu et al. Reference Qiu, Wang, Zou, Yan and Wei2014), cooling (Isozaki, Kawahata & Minoshima, Reference Isozaki, Kawahata and Minoshima2007; Isozaki, Aljinovic & Kawahata, Reference Isozaki, Aljinovic and Kawahata2011; Kofukuda, Isozaki & Igo, Reference Kofukuda, Isozaki and Igo2014) and marine anoxia (Isozaki, Reference Isozaki1997; Saitoh et al. Reference Saitoh, Isozaki, Yao, Ji, Ueno and Yoshida2013b; Zhang et al. Reference Zhang, Zhang, Li, Farquhar, Shen, Chen and Shen2015; Wei et al. Reference Wei, Wei, Qiu, Song and Shi2016). However, the causes for this biocrisis are still disputed.
There is a negative excursion of carbon isotope associated with this mass extinction at the Guadalupian–Lopingian (G–L, 259.1 ± 0.5 Ma, Zhong et al. Reference Zhong, He, Mundil and Xu2014) boundary (Wang, Cao & Wang, Reference Wang, Cao and Wang2004; Wignall et al. Reference Wignall, Sun, Bond, Izon, Newton, Védrine, Widdowson, Ali, Lai, Jiang, Cope and Bottrell2009a; Bond et al. Reference Bond, Wignall, Wang, Izon, Jiang, Lai, Sun, Newton, Shao, Védrine and Cope2010). Wignall et al. (Reference Wignall, Sun, Bond, Izon, Newton, Védrine, Widdowson, Ali, Lai, Jiang, Cope and Bottrell2009a) interpreted the negative excursion of carbon isotope at the G–L boundary as the carbon cycle perturbation resulted from Emeishan volcanism. Further, they suggested that the negative excursion discovered by Wang, Cao & Wang (Reference Wang, Cao and Wang2004) actually occurred during middle Capitanian time (see also Bond et al. Reference Bond, Wignall, Wang, Izon, Jiang, Lai, Sun, Newton, Shao, Védrine and Cope2010). However, Nishikane et al. (Reference Nishikane, Kaiho, Henderson, Takahashi and Suzuki2014) questioned the volcanic mechanism and middle Capitanian negative excursion of carbon isotope. They argued that the drop in eustatic sea level during Guadalupian time would not be consistent with widespread volcanism since enhanced volcanism is generally associated with a high plate production rate which would result in sea-level rise. The high carbon isotope ratios during middle Capitanian time at Penglaitan global boundary stratotype section and point (GSSP) section (see Chen et al. Reference Chen, Joachimski, Sun, Shen and Lai2011) is also inconsistent with the negative excursion of carbon isotope during middle Capitanian time (Nishikane et al. Reference Nishikane, Kaiho, Henderson, Takahashi and Suzuki2014). Instead, they suggested a declined primary production as the cause for the negative excursion at the G–L boundary (Nishikane et al. Reference Nishikane, Kaiho, Henderson, Takahashi and Suzuki2014; see also Yan, Zhang & Qiu, Reference Yan, Zhang and Qiu2013). A new interpretation for the negative excursion of carbon isotope at the G–L boundary was suggested by Saitoh et al. (Reference Saitoh, Isozaki, Ueno, Yoshida, Yao and Ji2013a) who interpreted it as the result of the upwelling of oxygen-depleted water rich in 12C onto the euphotic shelf. Alternatively, Jost et al. (Reference Jost, Mundil, He, Brown, Altiner, Sun, DePaolo and Payne2014) questioned the reliability of carbon-isotope negative excursion at the G–L boundary as a primary signal, and interpreted it as local burial conditions or diagenetic origin in some important sections. Accordingly, the interpretation for the carbon isotope negative excursion at the G–L boundary has been highly controversial, and needs more work to reveal the causes of the carbon isotope changes and the kill-mechanism of this extinction. Combining detailed petrographic analysis via thin-section, we have analysed facies, foraminifer fossils record, carbonate-carbon and bulk organic-carbon isotope changes across the G–L boundary at the Tianfengping section in Enshi city (in Hubei Province) in the middle Yangtze Platform, South China. Our results show a different interpretation for the carbon isotope changes during the boundary interval.
2. Geological background
The road-side Tianfengping section (30° 19′ 37″ N, 109° 18′ 52″ E) is located at the Tianfengping village in Enshi city in western Hubei Province, South China. The Tianfengping section crops out over the Maokou Formation, Kuhfeng Formation and Wuchiaping Formation, in ascending order. A detailed description of lithology and interpretation is provided in Section 4. Located in the eastern Palaeo-Tethys ocean in the tropical zone (Scotese & Langford, Reference Scotese, Langford, Scholle, Peryt and Ulmer-Scholle1995, p. 3; Muttoni et al. Reference Muttoni, Gaetani, Kent, Sciunnach, Angiolini, Berra, Garzanti, Mattei and Zanchi2009), the South China Block was during Capitanian time a large carbonate platform divided by the deep-water Jiangnan Basin in the middle into the Yangtze Platform in the west and the Cathaysian Platform in the east (Fig. 1). The Xiakou-Lichuan Bay (Yin et al. Reference Yin, Jiang, Xia, Feng, Zhang and Shen2014) was located in the northern Yangtze Platform (Fig. 1). Our studied section at Tianfengping was located in the centre of this bay. The Kangdian old land was located in the west of the Yangtze Platform.
Capitanian palaeogeography of South China (modified from Zhu, Reference Zhu1989; Wang & Jin, Reference Wang and Jin2000; Chen et al. Reference Chen, Liu, Wang and Zheng2003; Du et al. Reference Du, Song, Zhang, Lu, Lu, Chen, Liu and Yang2015) and the locations of studied sections. TP – Tianfengping section; QZ Basin – Qianzhong intrashelf basin; JN Basin – Jiangnan basin; TP – Tianfengping section; TQ – Tieqiao section.

From middle Capitanian time, the Emeishan large igneous province (LIP) erupted in the southwestern Yangtze Platform (Ali et al. Reference Ali, Thompson, Zhou and Song2005; Wignall et al. Reference Wignall, Sun, Bond, Izon, Newton, Védrine, Widdowson, Ali, Lai, Jiang, Cope and Bottrell2009a), resulting in a large volcanic and volcaniclastic succession which accumulated across the G–L boundary. The volume of Emeishan LIP was from 0.3×10⁶ km3 (Xu et al. Reference Xu, Chung, Jahn and Wu2001) to 0.6×10⁶ km3 (Yin et al. Reference Yin, Huang, Zhang, Hansen, Yang, Ding, Bie and Sweet1992, p. 146), only about one-tenth of the Siberian LIP with a volume of 4×10⁶ km3 (Courtillot, Reference Courtillot1999). Several rift basins including the Qianzhong basin near Guiyang in Figure 1 (Chen et al. Reference Chen, Liu, Wang and Zheng2003) and the Xiakou-Lichuan Bay were suggested to be of rift origin by Zhu (Reference Zhu1989), which may be related to the thermal decay of the Emeishan plume.
3. Methods
One hundred samples were collected at Tianfengping with a c. 25 cm sample interval, avoiding weathered samples. One hundred thin-sections were created for petrographic examination and identification of fossils.
For inorganic-carbon isotope measurements, we prepared 57 samples of bulk carbonate rock. For each sample, a fresh chip was ground using an agate mortar. Powdered samples were dissolved in phosphoric acid to release CO2 at Kiel IV of automated carbon reaction device, which was coupled with a Finnigan MAT 253 mass spectrometer for δ 13C and δ 18O measurements. All C-isotope ratios are calibrated to V-PDB using NBS-19. Analytical precision for δ 13C and δ 18O is ±0.04 ‰ and ±0.08 ‰ (1σ), respectively. This experiment was carried out at the Nanjing Institute of Geology and Palaeontology, Chinese Academy of Sciences.
For bulk organic-carbon isotope analyses, 84 samples were powdered smaller than 200 mesh using an agate ball mortar. These powdered samples were digested by 6 N HCl to remove all carbonates. The acid-insoluble residues were cleaned and dried, mixed with CuO and sealed in vacuo for further furnace processing. The samples were combusted at 800 °C and the released CO2 was cryogenically extracted and sealed in vacuum tubes for subsequent 13C/12C determination using a Finnigan MAT 253 at the Nanjing Institute of Geology and Palaeontology, Chinese Academy of Sciences. Reproducibility was better than ±0.08 ‰ for organic carbon calibrated to a urea (IVA33802174) standard with δ 13Corg value of –40.73 ‰. All data are reported in per mille (‰) relative to V-PDB standard.
4. Results
4.a. Lithostratigraphy
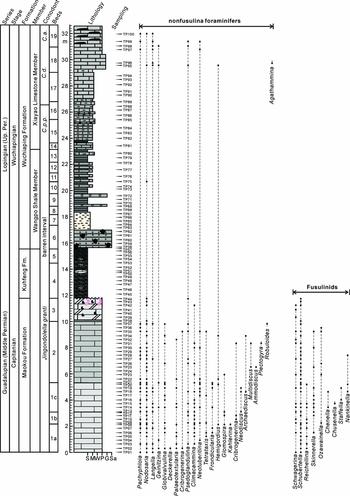
The Tianfengping section consists of the middle Permian Maokou and Kuhfeng formations, and the upper Permian Wuchiaping Formation (Fig. 2). The Wuchiaping Formation can be subdivided into the Wangpo Shale Member in the lower part and the Xiayao Limestone Member in the upper part (Feng, Yang & Jin, Reference Feng, Yang and Jin1997; p. 75).
Graphic sedimentary log across the Guadalupian–Lopingian boundary at the Tianfengping section, South China. S – shale; M – lime mudstone; W – wackestone; P – packstone; G – grainstone; Sa – sandstone. The conodont data is from Xia et al. (Reference Xia, Zhang, Kakuwa and Zhang2006). C. p.p. – Clarkina postbitteri postbitteri; C.d. – Clarkina dukouensis; C.a. – Clarkina asymmetrica.

4.a.1. Maokou Formation
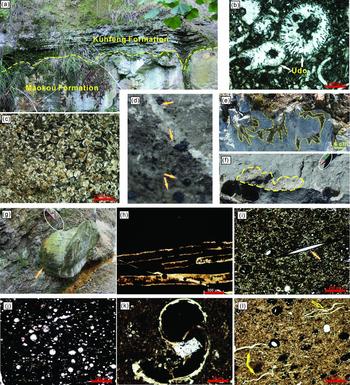
The Maokou Formation is composed of massive limestones/dolostones and is subdivided into light-grey limestones in the lower part, grey to dark-grey limestones in the middle part and limy dolostones in the upper part (Figs 2, 3a). The limestones in the lower and middle Maokou Formation show abundant stylolites and bioturbation (Fig. 2), and contain abundant bioclasts such as brachiopods, crinoids, echinoids, foraminifers, sponge spicules and green calcareous algae (Figs 2, 3b). Non-skeletal grains such as peloids, oncoids and cortoids also occur in the lower and middle Maokou Formation. The limy dolostones in the uppermost Maokou Formation contain dolomite crystals with cloudy centres and clear rims (Fig. 3c), suggesting replacement of limestones. There are also abundant bitumen (Fig. 3d) and small karst caves (Fig. 3e, f) in the uppermost Maokou Formation, suggesting a phase of karstification during sub-aerial exposure. The boundary between the Maokou and Kuhfeng formations is a regional unconformity (Fig. 3a).
Field photos and thin-section micrographs of the Maokou and Kuhfeng formations at Tianfengping, South China. (a) The Maokou–Kuhfeng boundary; and (b) Udoteacean packstone. Sample TP18. Plane polarized light (PPL). Bar scale 500 μm. (c) Dolomites with cloudy centres and clear rims. Sample TP42. PPL. Bar scale 500 μm. (d) Bitumens (arrows) at the top of the Maokou Formation. Size of bitumen is about 1 cm. (e) Small karst caves (dash lines) at the top of the Maokou Formation. (f) The internal surface of karst cave (dash line) the top of the Maokou Formation. Pencil for scale. (g) Dolomite nodule in the black chert. Hammer for scale. (h) Phylloids in the black chert in the lowermost Kuhfeng Formation. Sample TP45. PPL. (i) Siliceous sponge spicule (arrow) in the black chert. Sample TP50. PPL. (j) Radiolarian chert. Sample TP55. PPL. (h–j) Bar scale 500 μm. (k) Ammonoid in the lower Kuhfeng Formation. Sample TP46. PPL. Bar scale 50 μm. (l) Small and thin-shell brachiopod fragments (solid arrows) and intact one (hollow arrow). Sample TP50. PPL. Bar scale 200 μm.

4.a.2. Kuhfeng Formation
The 3.8 m-thick Kuhfeng Formation is composed of thin-bed (3–8 cm thick) black cherts interbedded with c. 1 cm carbonaceous black shales (Fig. 3a). Authigenic carbonate concretions are common and the largest (c. 1 m) occurs in the middle Kuhfeng Formation (Fig. 3g). Microscopically, phylloid algae (Fig. 3h), siliceous sponge spicules (Fig. 3i) and abundant radiolarians (Fig. 3j) occur in the lower, middle and upper parts of Kuhfeng Formation, respectively. Some small ammonoids (Fig. 3k) and brachiopods (Fig. 3l) also occur in the middle Kuhfeng Formation.
4.a.3. Wuchiaping Formation
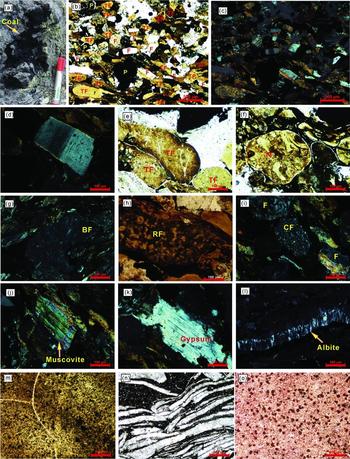
The Wuchiaping Formation includes the Wangpo Shale Member in the lower part and Xiayao Limestone Member in the upper part. The Wangpo Shale Member consists of lithic arenite and claystones in the lower part and black shale intercalated with thin-bed limestone in the upper part (Fig. 2). Coal is very common in the lower Wangpo Shale Member (Fig. 4a). The lithic arenite contains abundant feldspar and pyrite minerals (Fig. 4b–d) and lithic grains including tuff (Fig. 4e, f), basalt (Fig. 4g), spherulitic rhyolite (Fig. 4h) and chert (Fig. 4i). The tuff grains are very common. Muscovite (Fig. 4j), authigenic gypsum (Fig. 4k) and albite (Fig. 4l) also occur in this sandstone. The claystones overlying the lithic arenite are rich in pyrites (Fig. 4m), and the overlying floatstone contains abundant phylloid green algae (Fig. 4n). The thin-bedded lime mudstones occurred as intercalated bed in the black shale in the upper Wangpo Shale Member, containing abundant small round peloids (Fig. 4o).
Field photos and thin-section micrographs of the Wangpo Shale Member in the Wuchiaping Formation at Tianfengping. (a) Black coal (arrow). Marker for scale. (b) Feldspar (F), tuff fragment (TF) and pyrite (P) in sandstone. Sample TP59. PPL. Bar scale 500 μm. (c) Cross-polarized light (CPL) of (b). (d) Palgioclase in the sandstones. Bar sample TP 59. CPL. (e) Tuff fragments (TF) showing oxidized rim. Sample TP59. PPL. (f) Tuff fragment (TF) showing glassy fragment (arrow). Sample TP59. PPL. (g) Basaltic fragment (BF) showing angular shape. Sample TP60. CPL. (h) Spherulitic rhyolite fragment (RF). Sample TP59. PPL. (i) Chert fragment (CF) and feldspar (F) grains. Sample TP60. CPL. (j) Muscovite (arrow) grain. Sample TP60. CPL. (k) Authigenic gypsum. Sample TP59. CPL. (l) Authigenic albite in the sandstone. Sample TP62. CPL. (d–l) Bar scale 100 μm. (m) Claystones containing abundant black pyrite. Sample TP67. PPL. (n) Phylloid fragments (light bands) and calcisphere (light spots). Sample TP69. PPL. (o) Peloid wackestone. Sample TP74. PPL. (m–o) Bar scale 500 μm.

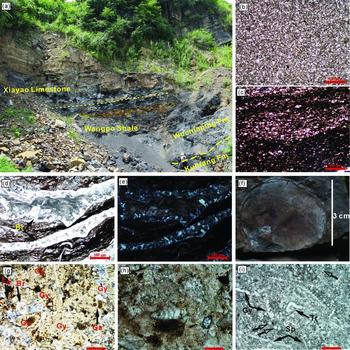
The Xiayao Limestone Member in the upper Wuchiaping Formation consists of thin- to thick-bedded argillaceous lime mudstones, wackestones and packstones (Fig. 5a, b). The argillaceous lime mudstones and wackestones display laminations (Fig. 5c) and contain large brachiopods (Fig. 5d–f), partially replaced by authigenic albite (Fig. 5e). The packstones to grainstones in the upper Xiayao Limestone Member contain abundant green algae and sponge spicules, gastropods, brachiopods, foraminifers (Fig. 5g–i) and ubiquitous disseminated glacuconites (Fig. 5h).
Field photos and thin-section micrographs of the Xiayao Limestone Member in the Wuchiaping Formation at Tianfengping. (a) Outcrop of the Wuchiaping Formation; (b) Lime mudstone, Sample TP 84. PPL. (c) Laminations in the argillaceous lime mudstone. Sample TP83. PPL. (d) Large brachiopods (Br) in the argillaceous lime mudstone. Sample TP86. PPL. (b–d) Bar scale 500 μm. (e) CPL image of (d). Authigenic albites occur in the rim of brachiopod fragments. (f) Brachiopod fossil in Sample TP93 in Bed 17. (g) Gymnocodiacean algae (Gy) grainstone containing small foraminifera (Fo), brachiopod spicule (Br) and gastropod (Ga). Sample TP95. PPL. Bar scale 500 μm. (h) Disseminated glauconites (yellow-green color). Sample TP95. PPL. Bar scale 100 μm. (i) Packstone containing abundant sponge spicules (Sp and hollow arrows), trilobite (Tr) and Gymnocodiacean green algae (Gy). Sample TP97. PPL. Bar scale 500 μm.

4.b. Foraminifer biostratigraphy
Fossil range data show that the Maokou Formation contains a high diversity of nonfusulina foraminifers and fusulinids, but that the Wuchiaping Formation only contains a few small foraminifers at Tianfengping (Fig. 6). For the small foraminifers, the long-ranging genera persisting into the Wuchiapingian strata include Pachyphloia, Nodosaria, Langella, Geinitzina, Psedoglandulina, Neotuberitina, Hemigordius and Agathammina at Tianfengping (Fig. 6), in which Pachyphloia, Nodosaria, Geinitzina, Hemigordius and Agathammina had been also reported in Wuchiapingian deposits in Guangyuan in South China (Lai et al. Reference Lai, Wang, Wignall, Bond, Jiang, Ali, John and Sun2008), at Tieqiao in South China (Wignall et al. Reference Wignall, Védrine, Bond, Wang, Lai, Ali and Jiang2009b; Zhang et al. Reference Zhang, Zhang, Li, Farquhar, Shen, Chen and Shen2015) and in Takachiho in Japan (Kobayashi, Reference Kobayashi2012). The Globivalvulina, Deckerella, Palaeotextularia, Cribrogenerina, Climacammina, Tetrataxis, Frondicularia, Glomospira, Cribrogenerina, Neodiscus, Archaediscus, Multidiscus, Ammodiscus, Plectogyra and Robuloides disappeared in the Wuchiaping Formation at Tianfengping (Fig. 6). However, some of these disappeared genera had been reported in the Wuchiapingian strata elsewhere, such as Palaeotextularia in Guangyuan in South China (Lai et al. Reference Lai, Wang, Wignall, Bond, Jiang, Ali, John and Sun2008), Climacammina in Guangyuan (Lai et al. Reference Lai, Wang, Wignall, Bond, Jiang, Ali, John and Sun2008), Laibin (Wignall et al. Reference Wignall, Sun, Bond, Izon, Newton, Védrine, Widdowson, Ali, Lai, Jiang, Cope and Bottrell2009a; Zhang et al. Reference Zhang, Zhang, Li, Farquhar, Shen, Chen and Shen2015) in South China and Takachiho in Japan (Kobayashi, Reference Kobayashi2012), Frondicularia in Guangyuan (Lai et al. Reference Lai, Wang, Wignall, Bond, Jiang, Ali, John and Sun2008), Laibin Wignall et al. Reference Wignall, Védrine, Bond, Wang, Lai, Ali and Jiang(2009b) and Takachiho in Japan (Kobayashi, Reference Kobayashi2012), Glomospira in Takachiho in Japan (Kobayashi, Reference Kobayashi2012), Neodiscus in Takachiho in Japan (Kobayashi, Reference Kobayashi2012), and Multidiscus in Laibin in South China (Zhang et al. Reference Zhang, Zhang, Li, Farquhar, Shen, Chen and Shen2015) and Takachiho in Japan (Kobayashi, Reference Kobayashi2012). Most of the foraminiferal genera therefore persist into the Wuchiapingian stratigraphy and only nine of them disappear from the upper Maokou Formation.
Foraminifera occurrences across the G–L boundary at Tianfengping, South China. For lithologic keys and conodont zones see Figure 2.

For the fusulinids range data, all of these fusulinid genera identified in the Maokou Formation disappeared in the Kuhfeng and the Wuchiaping formations (Wuchiapingian) at Tianfengping (Fig. 6). They were Schwagerina, Schubertella, Reichellina, Skinnerella, Ozawainella, Chenella, Chusenella, Staffella and Nankinella. However, Reichellina, Codonofusiella, Staffella and Nankinella had been reported in Wuchiapingian deposits elsewhere such as Guangyuan (Lai et al. Reference Lai, Wang, Wignall, Bond, Jiang, Ali, John and Sun2008), Laibin Wignall et al. Reference Wignall, Védrine, Bond, Wang, Lai, Ali and Jiang(2009b) in South China (Jin et al. Reference Jin, Shen, Henderson, Wang, Wang, Wang, Cao and Shang2006) and in Takachiho in Japan (Kobayashi, Reference Kobayashi2012). Most of the fusulinid genera therefore disappear at 9.5 m in the upper Maokou Formation in the upper Capitanian (e.g. J. granti zone; Xia et al. Reference Xia, Zhang, Kakuwa and Zhang2006) at Tianfengping (Fig. 6).
4.c. Carbon isotope chemostratigraphy
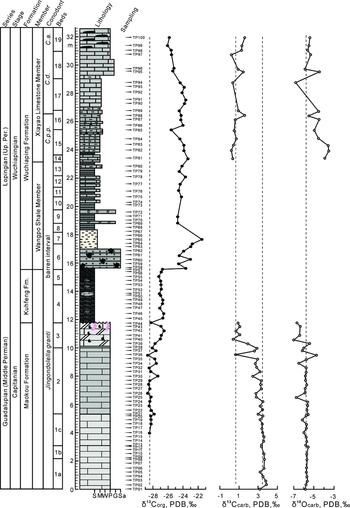
At Tianfengping, carbonate-carbon isotopic ratios δ 13Ccarb range from –0.7 ‰ to 3.9 ‰ with an average value of 2.3 ‰ (Table 1). The δ 13Ccarb profile stabilizes at c. 3.8 ‰ in the lower and middle Maokou Formation below 9.0 m and shifts to 0.7 ‰ in the upper Maokou Formation (Fig. 7). The δ 13Ccarb values in the Wuchiaping Formation are relatively low, ranging from 0.2 ‰ to 1.6 ‰ with an average value of 0.8 ‰ (Fig. 7). The δ 13Ccarb profile in the Wuchiaping Formation shows a gradual positive change from c. 0.5 ‰ to 1.60 ‰ (Fig. 7). Carbonate δ 18Ocarb values range from –7.0 ‰ to –3.5 ‰, with an average value of –5.6 ‰ (Table 1).
Stable carbonate-carbon, bulk organic-carbon, oxygen isotopes and the isotopic difference between carbonate-carbon and organic-carbon isotope data at Tianfengping, South China.

Carbonate-carbon isotope (δ 13Ccarb) and oxygen isotope (δ 18Ocarb), and organic-carbon isotope (δ 13Corg) profiles across the G–L boundary at Tianfengping, South China. For lithologic keys see Figure 2.

Organic-carbon isotopic ratios (δ 13Corg) range from –28.7 ‰ to –21.5 ‰, with an average value of –26.0 ‰. The δ 13Corg profile stabilizes at c. –28.4 ‰ in the lower and middle Maokou Formation (below 9.0 m) and shows a positive change from –28.4 ‰ to c. –26.5 ‰ in the upper Maokou Formation (Fig. 7). The δ 13Corg profile stabilizes at c. –26.5 ‰ in the lower Kuhfeng Formation and changes to c. –27.1 ‰ in the upper Kuhfeng Formation. At the Kuhfeng–Wuchiaping formation boundary, δ 13Corg profile shows an abrupt shift from –26.5 ‰ in the Kuhfeng Formation to –21.5 ‰ in the lower Wangpo Shale Member. The δ 13Corg profile then stabilizes at c. –23.9 ‰ in the upper Wangpo Shale Member and lower Xiayao Limestone Member, and then gradually shifts to –25.8 ‰ in the upper Xiayao Limestone Member (Fig. 7).
In summary, δ 13Ccarb values in the Wuchiaping Formation are substantially lower than in the Maokou Formation (c. 3 ‰ in magnitude). The δ 13Ccarb values in the upper Maokou Formation are isotopically lighter than in the lower and middle Maokou Formation. The δ 13Corg values in the upper Maokou Formation and Kuhfeng Formation are higher than in the lower and middle Maokou Formation, while δ 13Corg values in the Wuchiaping Formation are much higher than in the Kuhfeng and Maokou formations. Even in the Wuchiaping Formation, the δ 13Corg profile displays three steps from heavier to lighter values in the lower Wangpo Shale Member, upper Wangpo Shale Member to lower Xiayao Limestone Member and upper Xiayao Limestone Member, respectively.
5. Discussion
5.a. Changes in the sedimentary environment
The unconformity at the Maokou–Kuhfeng formation boundary at Tianfengping also occurred in other sections, for example Jianshi and Badong, suggesting a regional regression and sub-aerial exposure in South China (e.g. Chen et al. Reference Chen, Li, Huang, Zhang and Duan2000; Niu et al. Reference Niu, Duan, Fu, Xu, Zeng and Zhu2000). The occurrence of phylloids and small brachiopods in the black chert of the Kuhfeng Formation suggests that it was not a typical deep-marine environment. The spherical radiolarians which prefer inhabiting relatively shallower-water environments (Kozur, Reference Kozur1993) are abundant in the Kuhfeng Formation at Maocaojie near our studied section (Shi et al. Reference Shi, Feng, Shen, Ito and Chen2016). Furthermore, high organic carbon (6 %, Yao et al. Reference Yao, Gao, Yang and Long2002; 1.5–18 %, Shi et al. Reference Shi, Feng, Shen, Ito and Chen2016) in the Capitanian Kuhfeng Formation at Tianfengping probably suggests a restricted environment with weak water circulation (e.g. Zhang et al. Reference Zhang, Zhang, Li, Farquhar, Shen, Chen and Shen2015; Wei et al. Reference Wei, Wei, Qiu, Song and Shi2016; Saitoh et al. Reference Saitoh, Ueno, Matsu'ura, Kawamura, Isozaki, Yao, Ji and Yoshida2017). The petrography, which is characterized by abundant peloids, sandstones and claystones intercalated with coal beds in the Wangpo Shale Member (Wuchiapingian) (Fig. 4), suggests a coastal swamp environment; the argillaceous limestone and low biodiversity dominated by brachiopods in the low Xiayao Limestone Member (Fig. 5b–f) suggest a restricted environment, however. Abundant authigenic gypsums and albites in the Wangpo Shale Member and lower Xiayao Limestone Member suggest high concentrations of SO42− and/or Na+ in the diagenetic fluids since the gypsums grew in intergranular pore (Fig. 4k) and the albites were formed by the replacement of skeletons such as brachiopods (Fig. 5e). In the upper Xiayao Limestone Member, the packstones/grainstones contain abundant bioclasts with high biodiverisity (Fig. 5g–i) and glauconites, suggesting an open shallow-marine environment. In summary, the lower part of the Wuchiaping Formation (upper Permian) was deposited in a coastal swamp environment. The middle Permian Maokou Formation and the upper part of Wuchiaping Formation (upper Permian) were deposited in shallow-marine environments. The middle Permian Kuhfeng Formation, which is sandwiched between the Maokou and Wuchiaping formations, may have been deposited in a mid-depth environment rather than a deep basin. The Kuhfeng Formation elsewhere in South China was also deposited in the water depth not deeper than several hundred metres (Kametaka et al. Reference Kametaka, Takebe, Nagai, Zhu and Takayanagi2005).
5.b. Primary or diagenetic origin of carbon isotope records
5.b.1. δ 13Ccarb changes
Carbon isotopic ratios can be altered by the post-depositional processes such as meteoric burial and organic diagenesis (e.g. Rosales, Quesada & Robles, Reference Rosales, Quesada and Robles2001). It is critical to assess the diagenetic effect on carbon isotopic composition in order to reconstruct the environmental changes. The oxygen isotope ratios of whole-rock carbonates are generally altered during diagenesis (e.g. Weissert, Joachimski & Sarnthein, Reference Weissert, Joachimski and Sarnthein2008). Positive correlations between δ 18O and δ 13C in marine carbonate sediments are often taken as evidence for diagenetic alteration, as it is difficult to produce such arrays in a primary depositional environment (Marshall, Reference Marshall1992; Melim, Swart & Eberli, Reference Melim, Swart and Eberli2004; Knauth & Kennedy, Reference Knauth and Kennedy2009; Preto, Spotl & Guaiumi, Reference Preto, Spotl and Guaiumi2009). At Tianfengping, there is a weak covariation between δ 13Ccarb and δ 18Ocarb values (R2 = 0.25, Fig. 8a) in the Maokou Formation, recording a primary seawater signal. However, the negative shift of δ 13Ccarb profile at the top of the Maokou Formation is associated with the similar negative shift of δ 18Ocarb profile (Fig. 7), suggesting a diagenetic origin in this interval although the rest of the Maokou Formation shows uniform δ 13Ccarb values at 3.5 ‰, which is close to the average δ 13Ccarb value of the Capitanian deposits (c. 4 ‰, Buggisch et al. Reference Buggisch, Krainer, Schaffhauser, Joachimski and Korte2015) and records a primary signal. The diagenetic dolostone succession in the uppermost Maokou Formation is just below a regional unconformity at the Maokou–Kuhfeng formations boundary, which is characterized by a palaeokarst (Fig. 3e, f), probably also indicating a diagenetic origin of δ 13Ccarb at the top of this formation (e.g. Joachimski, Reference Joachimski1994). However, there is no correlation between δ 13Ccarb and δ 18Ocarb (R2 = 0.10, Fig. 8a) in the Wuchiaping Formation, suggesting a primary signal. The primary δ 13Ccarb values in the Wuchiaping Formation are much lower than in the Maokou Formation.
(a) Cross-plot between carbonate-carbon isotope and oxygen isotope at Tianfengping; (b) Cross-plot between carbonate-carbon isotope and organic-carbon isotope.

5.b.2. δ 13Corg changes
Organic carbon was drawn from the same dissolved inorganic carbon (DIC) of carbonate during photosynthesis. However, the negative correlation between δ 13Corg and δ 13Ccarb (R2 = 0.62, Fig. 8b) suggests that other factors such as organic sources can also control the δ 13Corg changes. The heavy δ 13Corg values in the dolostone succession in the uppermost Maokou Formation, coincident with the occurrence of bitumen (Fig. 7) and the similar values of δ 13Corg between the dolostone succession and the overlying Kuhfeng chert, suggest that the hydrocarbon bitumen was probably derived from the Kuhfeng Formation, a hydrocarbon source rock in South China (Liu et al. Reference Liu, Jin, Luo and Peng2014), affected the δ 13Corg in the dolostone succession. The δ 13Corg values (c. 22 ‰) of sandstones and claystones in swamp facies in the lower Wangpo Shale Member are much heavier than the δ 13Corg of the Kuhfeng chert in the moderate-water-depth shelf facies. This suggests an input of terrestrial organic matter sources in the lower Wangpo Shale Member since marine organic carbon older than Oligocene age is isotopically lighter than the land-derived carbon (Galimov, Reference Galimov2006). Furthermore, the δ 13Corg values in the upper Wangpo Shale Member and the lower Xiayao Limestone Member deposited in a restricted environment near coastline are heavier than the δ 13Corg values in the upper Xiayao Limestones deposited in open marine. This also suggests a more terrestrial 13C-rich organic matter input in the former. The input of terrestrial organic matter therefore controls the δ 13Corg changes at Tianfengping.
5.c. Carbon isotopic changes and their implication for mass extinction
The carbon-isotope correlation between the Tianfengping section and the Tieqiao section displays: (1) a similar trend of δ 13Corg between these two sections; (2) a positive peak at the Maokou–Heshan formation boundary or the Kuhfeng–Wuchiaping formation boundary; and (3) similar values of δ 13Ccarb in the upper Maokou Formation and the lower Wuchiapingian between these two sections (Fig. 9). These similarities suggest the δ 13Ccarb and δ 13Corg changes represent regional signals at least since these two sections are c. 730 km apart from each other. The clastic-origin tuff/claystones in the lowermost Heshan Formation at Tieqiao are related to Emeishan volcanism (Zhong, He & Xu, Reference Zhong, He and Xu2013). The tuff sandstone/claystones in the Wangpo Shale Member at Tianfengping (Fig. 9) is also related to the Emeishan volcanism (cf. Isozaki et al. Reference Isozaki, Yao, Ji, Saitoh, Kobayashi and Sakai2008; He et al. Reference He, Xu, Zhong and Guan2010; Deconinck et al. Reference Deconinck, Craquin, Bruneau, Pellenard, Baudin and Feng2014). The negative shift of δ 13Corg values at the G–L boundary at Tieqiao can be correlated to the same small negative shift (c. 0.5 ‰ in magnitude) of δ 13Corg values in the upper Kuhfeng Formation at Tianfengping. Combined with the conodont zones, the G–L boundary at Tianfengping is probably in the upper Kuhfeng Formation (Fig. 9). The gradual negative shift of δ 13Corg in the Xiayao Limestone Member in the upper Wuchiaping Formation at Tianfengping can be correlated to the similar negative shift of δ 13Corg in the Clarkina dukouensis conodont zone at Tieqiao (Fig. 9).
Carbon-isotope correlation between the Tianfengping section in Hubei Province of South China and the Tieqiao section in Laibin in Guangxi Province of South China. Organic- and inorganic-carbon isotope data at Tieqiao from Yan, Zhang & Qiu (Reference Yan, Zhang and Qiu2013). Sea-level change at Tieqiao is from Qiu et al. (Reference Qiu, Wang, Zou, Yan and Wei2014) and Haq & Schutter (Reference Haq and Schutter2008).

The δ 13Ccarb in the lower Wuchiapingian represents a primary signal and is much lighter (c. 3.0 ‰ in magnitude) than that in the lower and middle Maokou Formation, which also records a primary signal. Previous studies have suggested that the lower δ 13Ccarb values in the lower Wuchiapingian strata were controlled by: (1) volcanism and/or thermo-metamorphism methane (Wignall et al. Reference Wignall, Sun, Bond, Izon, Newton, Védrine, Widdowson, Ali, Lai, Jiang, Cope and Bottrell2009a; Wei et al. Reference Wei, Chen, Yu and Wang2012); (2) low biologic productivity or declined photosynthesis (Isozaki, Kawahata & Ota, Reference Isozaki, Kawahata and Ota2007; Yan, Zhang & Qiu, Reference Yan, Zhang and Qiu2013; Nishikane et al. Reference Nishikane, Kaiho, Henderson, Takahashi and Suzuki2014); (3) shallow-marine anoxia (Saitoh et al. Reference Saitoh, Isozaki, Ueno, Yoshida, Yao and Ji2013a, Reference Saitoh, Ueno, Isozaki, Nishizawa, Shozugawa, Kawamura, Yao, Ji, Takai, Yoshida and Matsuo2014, Reference Saitoh, Ueno, Matsu'ura, Kawamura, Isozaki, Yao, Ji and Yoshida2017; Zhang et al. Reference Zhang, Zhang, Li, Farquhar, Shen, Chen and Shen2015; Wei et al. Reference Wei, Wei, Qiu, Song and Shi2016); and (4) re-oxidation of 12C-enriched organic material due to eustatic sea-level falling (Lai et al. Reference Lai, Wang, Wignall, Bond, Jiang, Ali, John and Sun2008). Lithic arenites with abundant tuff grains in the Wangpo Shale Member in the lower Wuchiaping Formation at Tianfengping (Fig. 3) suggest a volcanic eruption related to the Emeishan large igneous province (LIP) (Fig. 5). Generally, large basalt volcanism releases abundant 12C-enriched CO2 into atmosphere (Hansen, Reference Hansen2006). However, according to the model calculation by Berner (Reference Berner2002), the Siberian LIP can only yield c. 1.0–1.7 ‰ magnitude negative excursion in one million years. The much smaller Emeishan LIP eruption may not yield this large gradual negative change in δ 13Ccarb values in the lower Wuchiapingian because small volumes of greenhouse gases need to be released extremely quickly (Jost et al. Reference Jost, Mundil, He, Brown, Altiner, Sun, DePaolo and Payne2014).
Declined primary productivity decreases the 12C-enriched organic matter burial, resulting in a negative excursion of inorganic-carbon isotope (Magaritz, Reference Magaritz1989; Broecker & Peacock, Reference Broecker and Peacock1999; Twitchett et al. Reference Twitchett, Looy, Morante, Visscher and Wignall2001; Korte & Kozur, Reference Korte and Kozur2010). This idea had been applied to explain the negative excursion of δ 13Ccarb across the G–L boundary at Tieqiao by Yan, Zhang & Qiu (Reference Yan, Zhang and Qiu2013). However, the widespread black shale (Wangpo Shale Member) in the lower Wuchiaping Formation is enriched in organic matter in the South China (e.g. at Tianfengping) and North China blocks. In addition, there were widespread coal beds at the G–L boundary across the South China Block. The low value of δ 13Ccarb in the lower Wuchiapingian at Tianfengping is therefore associated with high organic matter succession instead of low organic matter, suggesting that low primary productivity may not be the cause for this negative excursion.
The upwards rising of chemocline permits the return of isotopically light carbon to shallow-water depths, resulting in a fall of δ 13Ccarb in shallow-water (Küspert, Reference Küspert, Einsele and Seilacher1982, p. 482; Algeo et al. Reference Algeo, Ellwood, Nguyen, Rowe and Maynard2007). The shallow-marine anoxia had been suggested to be the cause of the negative excursion of δ 13Ccarb across the G–L boundary Saitoh et al. Reference Saitoh, Isozaki, Ueno, Yoshida, Yao and Ji(2013a). However, the strongest anoxia at the G–L boundary at Laibin (Wei et al. Reference Wei, Wei, Qiu, Song and Shi2016) is not associated with the negative excursion of δ 13Ccarb (Yan, Zhang & Qiu, Reference Yan, Zhang and Qiu2013), suggesting that the anoxia may not have been a major cause for this carbon-isotope shift.
During global sea-level fall, 12C-enriched organic matter may have been oxidized at exposed continental shelves and transported into the ocean (Holser & Magaritz, Reference Holser and Magaritz1987, Reference Holser and Magaritz1992; Baud, Magaritz & Holser, Reference Baud, Magaritz and Holser1989). The heavier values of δ 13Corg occurring in the coastal environments instead of the open shallow-marine environments at Tianfengping indicates that the input of terrestrial organic matter controls the δ 13Corg changes (e.g. Siegert et al. Reference Siegert, Kraus, Mette, Struck and Korte2011; Kraus et al. Reference Kraus, Brandner, Heubeck, Kozur, Struck and Korte2013) because marine organic carbon older than Oligocene age is isotopically lighter than the land-derived carbon (Galimov, Reference Galimov2006) and Permian wood shows heavier δ 13C values than coeval marine-sourced organic matter (Foster et al. Reference Foster, Logan, Summons, Gorter and Edwards1997; Krull, Reference Krull1999; Korte et al. Reference Korte, Veizer, Leythaeuser, Below and Schwark2001; Ward et al. Reference Ward, Botha, Buick, De Kock, Erwin, Garison, Kirschvink and Smith2005; Hermann et al. Reference Hermann, Hochuli, Bucher, Vigran, Weissert and Bernasconi2010). The negative correlation between δ 13Ccarb and δ 13Corg (R2 = 0.62, Fig. 8) therefore suggests that low δ 13Ccarb values correspond to relatively high δ 13Corg values during/or immediately after regression which brings more terrestrial organic matter input and results in high values of δ 13Corg at Tianfengping or even in South China. Large-scale regression during the G–L transition enhanced the oxidization of exposed organic matter or soil, resulting in a high input of 12C-rich DIC via river runoff. In South China, the unconformity at the G–L boundary is regional (He et al. Reference He, Xu, Chung, Xiao and Wang2003, Reference He, Xu, Wang and Luo2006; Shen et al. Reference Shen, Wang, Henderson, Cao and Wang2007) and represents a regional to global sea-level fall (Shen et al. Reference Shen, Wang, Henderson, Cao and Wang2007; Wignall et al. Reference Wignall, Bond, Haas, Wang, Jiang, Lai, Altiner, Védrine, Hips, Zajzon, Sun and Newton2012; Qiu et al. Reference Qiu, Wang, Zou, Yan and Wei2014). This large-scale global regression (Haq & Schutter, Reference Haq and Schutter2008) is associated with the widespread negative excursion of δ 13Ccarb in South China (Wang, Cao & Wang, Reference Wang, Cao and Wang2004; Lai et al. Reference Lai, Wang, Wignall, Bond, Jiang, Ali, John and Sun2008; Bond et al. Reference Bond, Wignall, Wang, Izon, Jiang, Lai, Sun, Newton, Shao, Védrine and Cope2010), Japan (Isozaki, Kawahata & Minoshima, Reference Isozaki, Kawahata and Minoshima2007; Isozaki, Kawahata & Ota, Reference Isozaki, Kawahata and Ota2007) and Iran (Shen et al. Reference Shen, Cao, Zhang, Bowring, Henderson, Payne, Davydov, Chen, Yuan, Zhang, Wang and Zheng2013), probably suggesting an impact of regression on this carbon-isotope change. At Tianfengping, the Kuhfeng–Wuchiaping formation boundary and the Maokou–Kuhfeng formation boundary represent regional unconformities and reflect large-scale sea-level fall. These two pulses of regression may correspond to the two episodes of Emeishan eruption evidenced by two basalt successions separated by a siliceous limestone succession at Xiongjiachang in Guizhou Province, South China (e.g. Wignall et al. Reference Wignall, Sun, Bond, Izon, Newton, Védrine, Widdowson, Ali, Lai, Jiang, Cope and Bottrell2009a). Sea-level fall and re-oxidized organic matter may therefore be the main controlling factor of this negative shift of δ 13Ccarb in lower Wuchiapingian strata. Qiu et al. (Reference Qiu, Wang, Zou, Yan and Hou2013) reported two pulses of carbon isotope excursion during middle Capitanian time and at the G–L boundary in South China, corresponding to two pulses of regression. The mechanism of re-oxidized organic matter can also be used to explain the first pulse of δ 13Ccarb negative excursion during middle Capitanian time. This sea-level fall coincides with the disappearance of foraminifers and fusulinids at Tianfengping (Fig. 6), suggesting that sea-level fall may be the cause of the biotic crisis at the G–L boundary via the loss of shallow-marine habitat where benthos lived (e.g. Qiu et al. Reference Qiu, Wang, Zou, Yan and Wei2014).
6. Conclusions
The negative shift of δ 13Ccarb in the uppermost Maokou Formation at Tianfengping in South China is of diagenetic origin. However, the δ 13Ccarb values in the main part of the Maokou Formation and in the Wuchiaping Formation represent primary signals of coeval sea water. Bulk organic-carbon isotope changes at Tianfengping mainly reflect the shift of organic matter sources, that is, the increased contribution of terrestrial organic matter. Sea-level fall led to high terrestrial organic matter input and resulted in heavy δ 13Corg values. The 3.0 ‰-magnitude lower δ 13Ccarb in the Wuchiaping Formation compared to that in the lower–middle Maokou Formation at Tianfengping was probably caused by the re-oxidized 12C-rich organic matter or soil during sea-level fall. Large-scale global regression resulted in the decrease of δ 13Ccarb in lower Wuchiapingian strata and led to the disappearance of foraminifers and fusulinids during Capitanian time in South China.
Acknowledgements
We thank two anonymous reviewers and the editor Paul Upchurch for their constructive comments and suggestions. This work was financially supported by the National Natural Science Foundation of China (grant no. 41302021). We thank Zhijun Zhu's suggestions for mineral identification.