Implications
Once daily milking (ODM) is a management practice that improves working conditions and reduces production costs in dairy farming, but decreases milk yield. By identifying the factors that contribute to this phenomenon, it will be possible to develop breeding strategies that can be used to reduce milk loss during ODM in goats. We investigated whether the reduction in milk yield that accompanies ODM could be explained by sustained disruption of the mammary epithelium. We showed that ODM does not affect MEC number but decreases the activity of these cells, and we found that the effect of ODM on milk yield is reversible after 5 weeks with no carryover effect.
Introduction
To maintain the sustainability of dairy farming operations, a reduction in production costs and an improvement in working conditions are needed. Once daily milking (ODM) is a management practice that contributes to the attainment of these objectives. However, the decrease in milk yield that is associated with ODM is a major drawback to its adoption. Milk yield is determined by the number of mammary epithelial cells (MEC) and their activity. Few data are available concerning the regulation of MEC activity and number during ODM. However, given that apoptosis is induced during mammary involution (Wilde et al., Reference Wilde, Knight and Flint1999), the longer interval between milking during ODM should accelerate MEC apoptosis, which, by reducing MEC number, should reduce milk yield. We previously reported a decrease in synthetic activity and suggested that apoptosis of milk MEC may have been induced after 1 and 5 weeks of ODM in goats (Ben Chedly et al., Reference Ben Chedly, Lacasse, Marnet, Komara, Marion and Boutinaud2011) and after 1 week in cows (Boutinaud et al., Reference Boutinaud, Ben Chedly, Delamaire and Guinard-Flament2008). However, in those studies only changes at the transcriptional level were reported.
A decrease in milk yield is observed on the very first day that ODM is implemented. Such a quick response of the mammary gland to ODM suggests the existence of cellular activity regulation. To our knowledge, there are no data describing the early regulation of MEC dynamics and activity during the first days of ODM application. One of the putative regulatory mechanisms is the disruption of mammary epithelium integrity (Stelwagen, Reference Stelwagen2001). Disruption of mammary tight junctions is associated with a decrease in milk yield in different situations such as psychological stress (Stelwagen et al., Reference Stelwagen, Hopster, Van der Werf and Blokhuis2000), mastitis (Leitner et al., Reference Leitner, Chaffer, Shamay, Shapiro, Merin, Ezra, Saran and Silanikove2004) and longer milking intervals (Stelwagen et al., Reference Stelwagen, Davis, Farr, Prosser and Sherlock1994; Delamaire and Guinard-Flament, Reference Delamaire and Guinard-Flament2006). It has recently been shown that the disruption of tight junctions in goat mammary gland can induce cell death and a decrease in mammary activity (Ben Chedly et al., Reference Ben Chedly, Lacasse, Marnet, Wiart-Letort, Finot and Boutinaud2009 and Reference Ben Chedly, Boutinaud, Bernier-Dodier, Marnet and Lacasse2010). However, there are no data showing the implication of the disruption of mammary epithelium during ODM in the regulatory mechanisms that may control the reduction in milk yield, such as regulation of cell number and activity of MEC.
In order to study regulation of cell number and activity in the mammary gland implied in milk synthesis, we have to sample MEC. There are invasive techniques to recover MEC from the mammary gland such as sampling tissue after slaughter or using a biopsy needle. In order to reduce the invasive effect of the study we should minimise the number of mammary biopsy collection and chose other techniques especially for kinetic studies. The collection of MEC from milk is a non-invasive method that has been used previously to study mammary gene expression in cows (Hayashi et al., Reference Hayashi, McCoard, Roy, Barnett, Mackenzie and Mcnabb2004; Murrieta et al., Reference Murrieta, Hess, Scholljegerdes, Engle, Hossner, Moss and Rule2006; Boutinaud et al., Reference Boutinaud, Ben Chedly, Delamaire and Guinard-Flament2008) and in goats (Boutinaud et al., Reference Boutinaud, Rulquin, Keisler, Djiane and Jammes2002; Ben Chedly et al., Reference Ben Chedly, Lacasse, Marnet, Komara, Marion and Boutinaud2011). The use of this technique avoids the carryover effect of sampling that may be observed in mammary biopsies.
In the present study, we investigated the involvement of the disruption of mammary epithelium integrity during ODM and the regulation of the synthetic activity and apoptosis of MEC in goats. Another objective of this study was to compare the results obtained using mammary biopsies and MEC collection in the milk.
Material and methods
Animals and experimental design
Twelve alpine goats producing 3.67 ± 0.64 kg/day of milk in their first 47 ± 1.6 days in milk (DIM) were selected on the basis of their well-balanced milk yield and lactose and protein content. Goats were milked in double 12-stall parallel milking parlour using a low line with 38 kPa vacuum pressure. The pulsation rate was 120 pulsations/min and the pulsation ratio was 60 : 40. During the trial on the 48th day of lactation, all the goats were fed according to INRA recommendations (INRA, 2007) with alfalfa hay ad libitum and 800 mg concentrate. Before the experiment started, all goats were milked twice a day at 0700 and 1600 h.
During the experimental period, the goats were assigned to two groups: a control group, which was milked twice daily over the trial, and a once daily milking/twice daily milking (ODM/TDM) group, which was subjected to ODM during 5 weeks and switched back to TDM for the following 5 weeks. The ODM/TDM group was milked at 0700 h during the ODM period. During the ODM period, goats were separated physically into two groups in order to facilitate the access to the milking parlour and to avoid error in milking management of the two groups. During the TDM switchback period, all goats were regrouped in a single pen.
Milk and mammary tissues samples
Milk production was recorded at each milking, 7 days a week. Twice a week, the lactose, fat and protein contents and somatic cell counts (SCC) in milk samples collected at morning and afternoon milkings were determined by a commercial laboratory using infrared analysis (Lillab, Châteaugiron, France).
Milk samples were collected from all goats in the two groups on days −8, 1, 16, 21 and 35 during the ODM period and on days 1 and 16 of the TDM switchback period, to analyse total N (Kjeldahl), non-protein N (precipitation at pH 4.6 with TCA and filtration) and non-casein N (precipitation at pH 4.6 with 10% acetic acid and 1 M sodium acetate) content. Casein was determined as total N minus non-casein N and whey protein as non-casein N minus non-protein N.
Mammary tissue was sampled by collecting mammary biopsies from both half udders with a 12G/10 cm, 22 mm Bard Monopty disposable core biopsy instrument (Bard, Voisins Le Bretonneux, France) as described by Ben Chedly et al. (Reference Ben Chedly, Lacasse, Marnet, Komara, Marion and Boutinaud2011). The mammary biopsy samples were collected on day 8 before the start of the ODM period, as well as on days 2 and 16 of ODM and on days 2 and 16 of the TDM switchback period for all goats in both groups. The biopsies were used for total RNA extractions and histochemistry. Three 20 mg biopsy samples were frozen in liquid nitrogen and stored at −80°C until used for RNA extractions. The biopsy sample used for histochemistry was washed in PBS and fixed in 4% paraformaldehyde for immuno-histochemistry. The fixed tissue was cryoprotected by 48 h incubation in a 40% sucrose solution and then coated with OCT Compound Tissue-Tek (Sakura Finetek Europe, LaboNord, Templemars, France), frozen in a cooled bath of isopentane and stored at −80°C until use.
Blood samples were collected from the jugular vein before morning milking on the 6th day before the start of the trial, on days 1, 2 and 16 of the ODM period, and on days 2 and 16 of the TDM switchback period. These blood samples were used for lactose analysis with a colorimetric reaction (kit for lactose/D-galactose, Roche Diagnostico, Meylan, France) and a multiparameter analyzer (Kone Instrument Corporation, Espoo, Finland).
Purification of MEC
Milk samples (0.9 kg) were collected on the 8th day before the start of the experiment, on days 1, 7, 21 and 28 of the ODM period, and on days 1 and 7 of the TDM switchback period in both groups of goats, in order to perform MEC purification as described by Ben Chedly et al. (Reference Ben Chedly, Lacasse, Marnet, Komara, Marion and Boutinaud2011). A Vi-CELL XR analyzer (Beckman Coulter, Roissy, France) to determine the total milk cell count and cell viability.
RNA extraction and real-time RT-PCR
The extraction of total RNA from milk purified MEC and mammary biopsies was performed in Trizol, according to the manufacturer's recommendations. The RNA pellet was suspended in RNase-free water and the total quantity of RNA was determined with an Agilent 2100 bioanalyzer (Agilent Technologies, Massy, France). RNA quality was assessed using the RNA integrity number generated by version B.02 of Agilent 2100 Expert Software (Agilent Technologies). Twelve samples of RNA from a total of 84 milk MEC preparations were eliminated from the analysis due to their poor RNA quality.
Complementary DNA was obtained using the First Strand cDNA kit (Roche Diagnostics), according to the manufacturer's instructions, with 500 ng of total RNA. PCR amplifications of cDNA samples were performed using the primers described by Boutinaud et al. (Reference Boutinaud, Ben Chedly, Delamaire and Guinard-Flament2008) for cyclophilin, α-LA (α-lactalbumin), κ-casein and Bax. The primers used for β-actin, r18S, CLPN-2, MMP-2, occludin, E-cadherin and caspase-3 are described in Ben Chedly et al. (Reference Ben Chedly, Lacasse, Marnet, Wiart-Letort, Finot and Boutinaud2009).
Real-time PCR was performed as described by Ben Chedly et al. (Reference Ben Chedly, Lacasse, Marnet, Komara, Marion and Boutinaud2011).
Quantification of RNA
The number of amplified mRNA molecules was determined using the method described by Ben Chedly et al. (Reference Ben Chedly, Lacasse, Marnet, Wiart-Letort, Finot and Boutinaud2009). The mRNA levels of the studied genes were expressed relative to a reference gene. The cyclophilin, β-actin, r18S and glyceraldehyde-3-phosphate dehydrogenase (GAPDH) genes were evaluated as potential reference genes. The effect of treatments was evaluated in order to identify the gene that showed the least variation. The gene with the most stable expression in both milk MEC and biopsy samples was r18S. Thus, r18S was used as the reference gene during this study. The results for each target gene are expressed as a ratio using the selected reference gene.
Histochemistry
Apoptotic cells were quantified in mammary gland biopsies on the 8th day before the start of the experiment and on days 2 and 16 of the ODM period. This quantification was done by the detection of DNA fragmentation using the TUNEL (terminal deoxynucleotidyl transferase-mediated dUTP-biotin nick end labelling) method using 7-μm-thick cryosections as described by Ben Chedly et al. (Reference Ben Chedly, Lacasse, Marnet, Wiart-Letort, Finot and Boutinaud2009).
E-cadherin labelling was performed on mammary gland biopsies corresponding to the second day of the ODM period in all goats using 7-μm-thick cryosections as described by Ben Chedly et al. (Reference Ben Chedly, Lacasse, Marnet, Wiart-Letort, Finot and Boutinaud2009).
Proliferating MEC were identified as cells expressing the proliferating cell nuclear antigen (PCNA) in mammary biopsies from days 2 and 16 of the ODM period in all goats using 7-μm-thick cryosections as described by Ben Chedly et al. (Reference Ben Chedly, Lacasse, Marnet, Wiart-Letort, Finot and Boutinaud2009). Alveolar characteristics were determined with propidium iodide staining, which reveals the outlines of the acini. For each acinus, the ImageJ software (Wayne Rasband, National Institutes of Health, Bethesda, MD, USA) was used to count the number of epithelial cells and to determine alveolar size.
Statistical analysis
Milk data obtained during the ODM period and during TDM switchback period were analysed separately using the same statistical model. Milk yield and composition and gene expression data were analysed by ANOVA using the MIXED procedure of SAS (SAS Institute, 1999) with the REPEATED statement. Days were used as repeated effects and goats as subjects. Data obtained on day-7 were used as covariates. The effects of group, day and the interaction group × day were tested. Milk SCC were log10 transformed prior to the analysis. For gene expression data, the ratio of the number of mRNA molecules of the target gene to the corresponding number of molecules of r18S gene was multiplied by 106 and log10 transformed and analysed as milk data. Gene expression data obtained from biopsy samples and milk MEC were analysed separately. Total MEC and MEC in milk were analysed as gene expression data. The TUNEL and E-cadherin labelling data were analysed by ANOVA using the MIXED procedure of SAS. The effects of group, day and the interaction group × day were tested. Goats were used as a RANDOM effect.
Results
Milk yield and composition
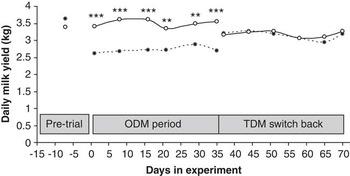
The ODM/TDM goats produced less milk (22%; P < 0.001) than control goats during the 5 weeks of ODM (Figure 1). When all goats were milked twice a day during the TDM switchback period, the ODM/TDM group produced a level of milk yield similar to that of the control group (Figure 1). There was an apparent drop in milk production in control goats at the onset of the TDM switchback period. This is related to the biopsies performed on day 2 of the switchback period. The ODM goats were also submitted to the same procedure but the effect is less apparent because milk production was still increasing at that time.
Milk yield of goats milked once a day (once daily milking (ODM)/twice daily milking (TDM)) or twice a day (control). Data are presented as LSM except for day 7, which are means. Statistically different means during a specific time are indicated by ***P < 0.001 and **P < 0.01. —○—, control group; – – ● – –, ODM/TDM group.

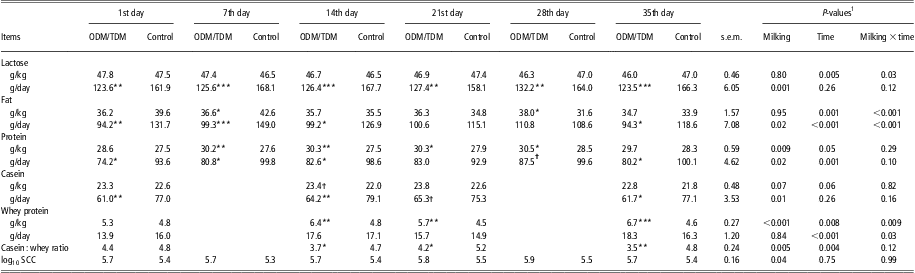
During the ODM period, the goats milked once a day produced less lactose, fat and protein in the milk than the control goats (Table 1). Casein yield, but not whey protein yield, was reduced in ODM/TDM goats (Table 1). Milk lactose concentration was similar for the two groups of goats during the ODM period. Protein content was higher, casein content tended to be higher, and whey protein content was higher in ODM/TDM goats than in the control goats. Accordingly, the casein : whey protein ratio was lower in the ODM/TDM group than in the control group (Table 1). There was a treatment × time interaction on milk fat content, with milk of the ODM/TDM group containing less fat during the 1st week of treatment and more fat at the end of the 4th week, as shown in Table 1.
Milk composition of goats milked once a day (ODM/TDM) or twice a day (control) during the once-a-day milking period
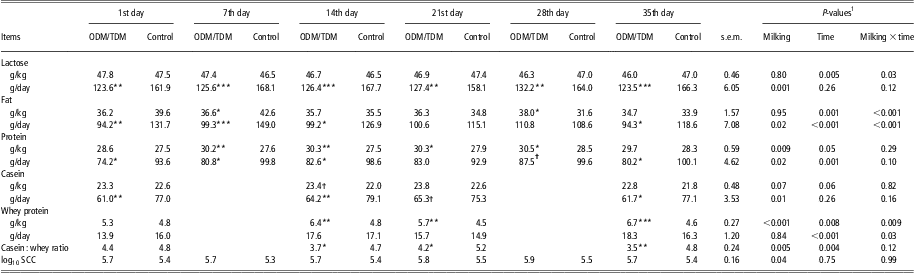
ODM = once daily milking; TDM = twice daily milking; SCC = somatic cell counts.
1P-values indicate the effect of milking frequency and its interaction with time in a repeated measures analysis.
Statistically different means for ODM/TDM and the control group for a specific time are indicated by: ***P < 0.001; **P < 0.01; *P < 0.05 and †P < 0.10.
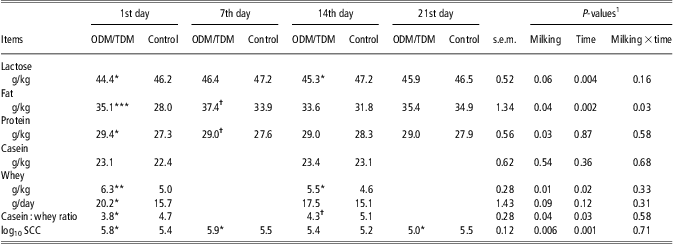
When all animals were on TDM, the lactose, fat, protein and casein yields were similar for the ODM/TDM and control groups (Table 2). Lactose content tended to be lower in the ODM/TDM goats than in the control goats. Fat and protein content were higher in ODM/TDM goats as shown in Table 2. The milk whey protein content remained higher in ODM/TDM goats, while casein content was similar for the two groups of goats. This led to a lower milk casein : whey protein ratio in the ODM/TDM group.
Milk composition of goats milked once a day (ODM/TDM) or twice a day (control) during the twice-a-day switchback period
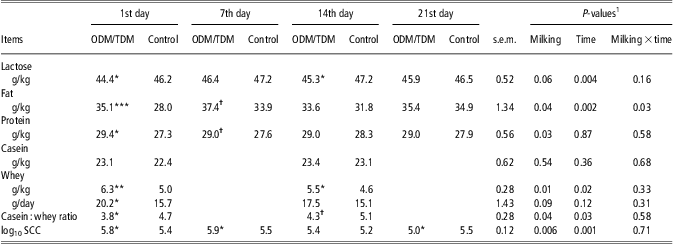
ODM = once daily milking; TDM = twice daily milking; SCC = somatic cell counts.
1P-values indicate the effect of milking frequency and its interaction with time in a repeated measures analysis.
Statistically different means for ODM/TDM and control groups for a specific time are indicated by: ***P < 0.001; **P < 0.01; *P < 0.05 and †P < 0.10.
Blood lactose
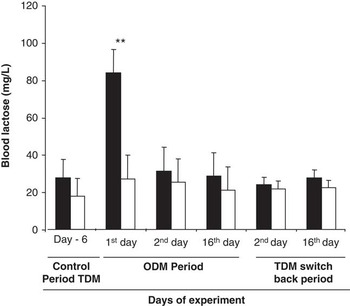
A higher blood lactose concentration was observed in ODM/TDM goats after the first 24 h of milk accumulation during the ODM period (Figure 2). However, blood lactose concentrations were similar in ODM/TDM and control goats after 2 days and 2 weeks of ODM (P > 0.10). Similar blood lactose concentrations were observed for the two groups of goats during the second day and after the second week of TDM (Figure 2).
Blood lactose concentration for goats milked once a day (ODM/TDM, ▪) or twice a day (control, □). Data are presented as LSM ± s.e.m. except for day 6, which are means. Statistically different means for a specific time are indicated by **P < 0.01. ODM = once daily milking; TDM = twice daily milking.

Milk cells
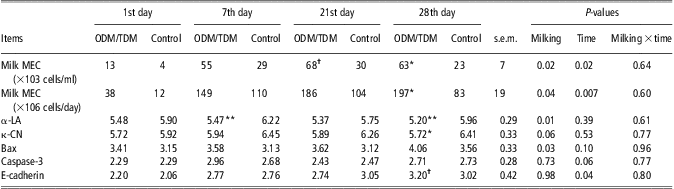
During the ODM period, SCC was higher for ODM/TDM goats than for control goats (Table 1). The number of MEC per ml of milk recovered and the estimated loss of MEC per day (cells/day) were higher for milk from the ODM/TDM group than from the control group during the ODM period (Table 3). However, the viability of milk MEC was similar for the ODM/TDM group and the ODM group (85.7 ± 2.5% v. 83.5 ± 2.8%, P = 0.58).
MEC recovered in milk and log10 of target gene mRNA levels relative to r18S mRNA levels in milk MEC of goats milked once a day (ODM/TDM) or twice a day (control) during the once-a-day milking period
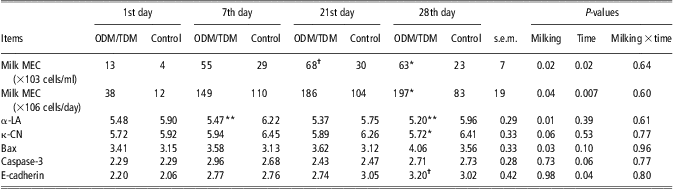
MEC = mammary epithelial cells; ODM = once daily milking; TDM = twice daily milking; α-LA = α-lactalbumin; κ-CN = κ-casein.
1P-values indicate the effect of milking frequency and its interaction with the time of treatment for all data in a repeated measures analysis.
Statistically different means for ODM/TDM and the control group for a specific time are indicated by: **P < 0.01; *P < 0.05 and †P < 0.10.
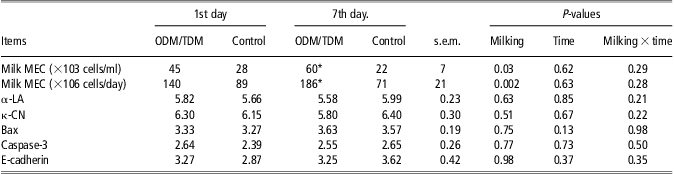
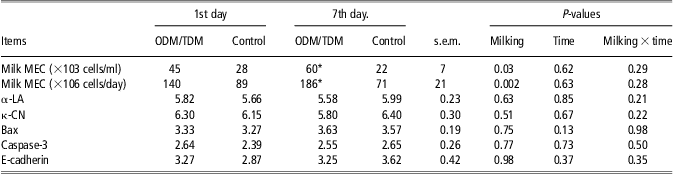
The concentration of milk MEC and the estimated loss of MEC per day remained higher in the ODM/TDM group than in the control group (Table 4) during the TDM switchback period. However, cell viability was similar for the two groups of goats with regard to milk MEC (82.4 ± 3.5% and 88.2 ± 3.8%, respectively for ODM/TDM and Control, P = 0.29).
Mammary epithelial cells (MEC) recovered in milk and log10 of target gene mRNA levels relative to r18S mRNA levels obtained in milk MEC of goats milked once a day (ODM/TDM) or twice a day (control) during the twice-a-day switchback period
MEC = mammary epithelial cells; ODM = once daily milking; TDM = twice daily milking; α-LA = α-lactalbumin; κ-CN = κ-casein.
1P-values indicate the effect of milking frequency and its interaction with the time of treatment for all data in a repeated measures analysis.
Gene expression
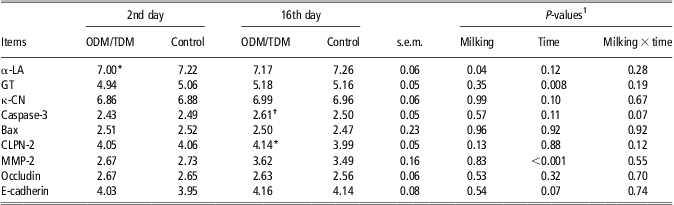
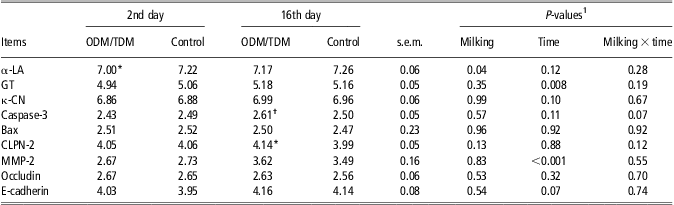
We observed lower levels of α-LA mRNA in ODM/TDM goats compared with control goats during the ODM period in milk MEC sampled after 1, 3 and 4 weeks of ODM application and in mammary biopsies taken after the second day and the second week of the ODM period as shown in Tables 3 and 5. The mRNA level of κ-CN tended to be lower in milk MEC samples from ODM/TDM goats than from control goats in the ODM period (Table 3) but similar levels were found in mammary tissue (Table 5). The mRNA level of galactosyl-transferase (GT) did not change with milking frequency.
Log10 of target gene mRNA levels relatively to r18S mRNA levels obtained in mammary tissue of goats milked once a day (ODM/TDM) or twice a day (control) during the once-a-day milking period
ODM = once daily milking; TDM = twice daily milking; GT = galactosyl-transferase; α-LA = α-lactalbumin; κ-CN = κ-casein.
1P-values indicate the effect of milking frequency and its interaction with time of treatment for all data in a repeated measures analysis.
Statistically different means for ODM/TDM and control groups for a specific time are indicated by: *P < 0.05 and †P < 0.10.
The expression of gene indicator of cell death varied with milking frequency; however, the results differed according to the indicators used and between milk MEC and mammary tissue. We observed a higher mRNA level of Bax in milk MEC of ODM/TDM goats compared with control goats (Table 3), whereas in the mammary biopsy samples the Bax mRNA level did not change with milking frequency (Table 5). A higher mRNA level of CLPN-2 and a tendency for a higher mRNA level of caspases-3 were observed in mammary biopsies from the ODM/TDM group compared with the control group after 2 weeks of ODM (Table 5). The mRNA levels of MMP-2 in mammary tissue were similar for the ODM/TDM and control groups during the ODM period.
Similar mRNA levels of occludin and E-cadherin in mammary biopsies were observed in ODM/TDM and control goats during the ODM period, as reported in Table 5. The E-cadherin mRNA level in milk MEC was also similar for ODM/TDM and control goats (Table 3).
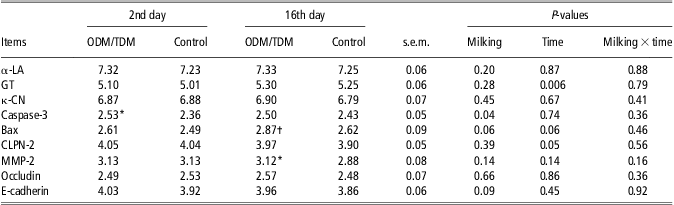
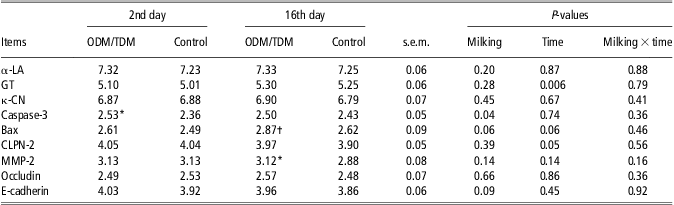
During the TDM switchback period, similar mRNA levels of α-LA and κ-CN in milk MEC and mammary tissue were observed for the ODM/TDM and control groups, as reported in Table 4 and Table 6. In milk MEC, no carryover effect of ODM was observed during the TDM switchback period for any of the evaluated genes. Nevertheless, mammary tissue from ODM/TDM goats contained a higher mRNA level of caspases-3 and tended to contain a higher mRNA level of Bax in comparison with the control goats. Similarly, E-cadherin mRNA tended to be more expressed in ODM/TDM mammary biopsies than in that of control goats (Table 6).
Log10 of target gene mRNA levels relatively to r18S mRNA levels obtained in mammary tissue of goats milked once a day (ODM/TDM) or twice a day (control) during the twice-a-day switchback period
ODM = once daily milking; TDM = twice daily milking; GT = galactosyl-transferase; α-LA = α-lactalbumin.
1P-values indicate the effect of milking frequency and its interaction with time of treatment for all data in a repeated measures analysis.
Statistically different means for ODM/TDM and control groups for a specific time are indicated by: *P < 0.05 and †P < 0.10.
Histochemical analyses of mammary tissue
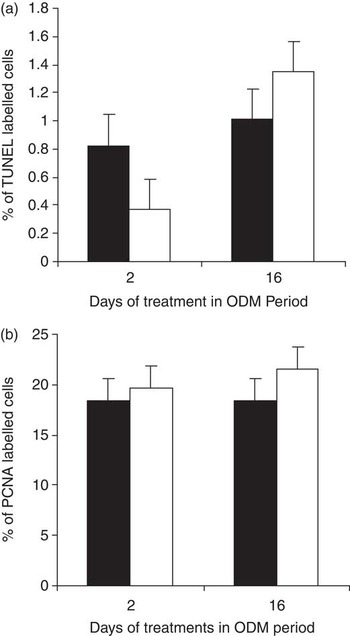
The proportion of apoptotic cells in mammary tissue measured after TUNEL staining was similar for the ODM and control goat groups after 2 and 16 days during the ODM period (P = 0.79), as shown in Figure 3a. The TUNEL labelled apoptotic cells were more abundant after 16 days of experiment than after 2 days (P = 0.02) without a substantial difference between the milking frequencies (P = 0.10).
Percentage of TUNEL (a) or PCNA (b) labelled cells in mammary tissue from goats milked once a day (▪) or twice a day (□) for 2 and 16 days. Data are presented as LSM ± s.e.m. TUNEL = terminal deoxynucleotidyl transferase-mediated dUTP-biotin nick end labelling; PCNA = proliferating cell nuclear antigen; ODM = once daily milking.

The proliferation of MEC in the mammary tissue, evaluated by the count of PCNA labelled cells, was similar for the ODM/TDM and control groups after 2 and 16 days in the ODM period (P = 0.46, Figure 3b). The PCNA labelled cells were similar after 2 and 16 days of experiment (P = 0.47) without any difference between the milking frequencies (P = 0.44).
Alveolar size (24 300 ± 2100 and 20 700 ± 2100 μm2, respectively for ODM/TDM and Control, P = 0.27) and the number of cells per alveolus cross section (33.4 ± 1.5 and 32.2 ± 1.5, respectively for ODM/TDM and Control, P = 0.51) were similar for the ODM/TDM and control goats during ODM period. Similarly, the number of alveoli per area unit did not differ significantly between the milking frequencies (5.4 ± 0.3 and 5.6 ± 0.3, respectively for ODM/TDM and Control, P = 0.79). Only the effect of time was observed with higher cell number per alveoli and number of alveoli per area unit as lactation advanced (P = 0.02 and P = 0.002, respectively).
Similar labelling intensity of E-cadherin was observed in both groups of goats after 2 days of ODM (P = 0.88, data not shown).
Discussion
Decrease in milking frequency, especially ODM, is generally associated with a decline in milk yield (Davis et al., Reference Davis, Farr and Stelwagen1999; Pomiès et al., Reference Pomiès, Marnet, Cournut, Barillet, Guinard-Flament and Rémond2008). The decline in milk yield varies between 6% and 40% due to different factors, such as the stage of lactation, breed of animals and duration of the treatment (Marnet and Komara, Reference Marnet and Komara2008). The 22% decrease in milk yield observed over the 5 weeks of ODM in this trial was in agreement with a previous study reporting a 20% milk loss in goats milked once a day (Salama et al., Reference Salama, Such, Caja, Rovai, Casals, Albanell, Marin and Marti2003). In the present trial, we did not observe a time-dependent effect, as milk yield loss was found to be constant over the 5-week ODM period. This is consistent with the observations of Komara et al. (Reference Komara, Boutinaud, Ben Chedly, Guinard-Flament and Marnet2009), but not with our previous observations (Ben Chedly et al., Reference Ben Chedly, Lacasse, Marnet, Komara, Marion and Boutinaud2011) or those of Salama et al. (Reference Salama, Such, Caja, Rovai, Casals, Albanell, Marin and Marti2003), in which milk yield loss was greater during the first weeks of ODM. This difference is likely attributable to the longer experimental period in those studies (15 and 24 weeks, respectively).
The decrease in milk yield observed during ODM was associated with a decrease in milk lactose yield. Loss of lactose through disrupted tight junctions would decrease the amount of lactose recovered in milk (Stelwagen et al., Reference Stelwagen, Davis, Farr, Prosser and Sherlock1994). However, ODM only induced transient tight junction disruption, which was limited to the first day of ODM. This is consistent with an acute regulation of milk synthesis through tight junction disruption followed by metabolic adaptations probably involving changes in milk secretion after actin skeleton modifications as proposed by Knight et al. (Reference Knight, Wilde and Peaker1988). Thus, the reduction of milk lactose yield is essentially due to a reduction of its synthesis by the mammary gland. The decrease in lactose synthesis during ODM seems to be regulated at the transcriptional level since a lower mRNA level of α-LA was observed over the 5 weeks of the ODM period. Downregulation of the α-LA transcripts in ODM was observed in both milk MEC and tissue samples. The decrease in α-LA mRNA levels observed in the present experiment is consistent with our previous observations in goats (Ben Chedly et al., Reference Ben Chedly, Lacasse, Marnet, Komara, Marion and Boutinaud2011) and cows (Boutinaud et al., Reference Boutinaud, Ben Chedly, Delamaire and Guinard-Flament2008) in milk MEC and in bovine mammary tissue (Boutinaud et al., Reference Boutinaud, Galio and Devinoy2009; Littlejohn et al., Reference Littlejohn, Walker, Ward, Lehnert, Snell, Verkerk, Spelman, Clark and Davis2010; Grala et al., Reference Grala, Phyn, Kay, Rius, Littlejohn, Snell and Roche2011). Manipulation of α-LA transcript levels in mice by deletion and replacement has been linked to changes in milk volume (Stacey et al., Reference Stacey, Schnieke, Kerr, Scott, McKee, Cottingham, Binas, Wilde and Colman1995). Therefore, we believe, as suggested by Kuhn et al. (Reference Kuhn, Carrick and Wilde1980), that lactose synthesis and, consequently, milk volume, is regulated by the synthesis of α-LA.
The higher milk protein content observed in the ODM/TDM group compared with the control group during the ODM period indicates that protein synthesis decreased less than milk volume. Accordingly, only a trend toward lower κ-CN mRNA levels was detected in MEC. Downregulation of κ-CN was previously reported during ODM in cows (Boutinaud et al., Reference Boutinaud, Ben Chedly, Delamaire and Guinard-Flament2008) and also in goats (Ben Chedly et al., Reference Ben Chedly, Lacasse, Marnet, Komara, Marion and Boutinaud2011).
The increase in milk whey protein content can be attributed, in part, to a leakage of serum protein into milk through disrupted tight junctions (Stelwagen et al., Reference Stelwagen, Davis, Farr, Prosser and Sherlock1994). However, tight junction disruption was transient and cannot explain our observations. The increase in milk whey protein during ODM might be attributable to higher levels in serum albumin and IgG still observed after the closure of the tight junctions probably associated with the higher level of SCC (Stelwagen and Lacy-Hulbert, Reference Stelwagen and Lacy-Hulbert1996; Auldist and Prosser, Reference Auldist and Prosser1998). However, it can also be due to an increase in casein hydrolysis, which could generate small protein fragments quantified as whey proteins. An increase in proteases such as plasmin was previously reported in cows during ODM (Stelwagen et al., Reference Stelwagen, Davis, Farr, Prosser and Sherlock1994). In addition, the synthesis of some whey proteins such as β-lactoglobulin might be less sensitive to inhibition of milk accumulation.
The results obtained in this study reveal time-dependent regulation of milk fat synthesis, which must be confirmed through further studies. However, the variation in milk fat content observed over the different weeks of the ODM period can explain the contradictory effects reported in various studies. Some studies reported an increase in milk fat content (Stelwagen et al., Reference Stelwagen, Davis, Farr, Prosser and Sherlock1994; Lacy-Hulbert et al., Reference Lacy-Hulbert, Woolford, Nicholas, Prosser and Stelwagen1999; O'Brien et al., Reference O'Brien, Ryan, Meaney, McDonagh and Kelly2002) but others reported no variation (Rémond et al., Reference Rémond, Aubailly, Chilliard, Dupont, Pomiès and Petit2002; Marnet and Komara, Reference Marnet and Komara2008) or a decrease (Ben Chedly et al., Reference Ben Chedly, Lacasse, Marnet, Komara, Marion and Boutinaud2011) in milk fat content during ODM. Our finding suggests that the inhibition of milk fat synthesis by ODM may gradually disappear beginning in the second week of treatment.
It has been suggested that the decrease in milk yield during ODM can be attributed to a loss of MEC in the gland caused by apoptosis. In this study, similar apoptosis and proliferation rates were observed in both groups after 2 and 16 days in the ODM period. Accordingly, similar size of alveoli and number of cells per alveolus were observed for ODM/TDM and control goats. This suggests that apoptosis is not involved in the decrease in milk yield observed during ODM in goats. A previous study reported similar apoptotic rates in mammary tissue after 3 weeks of unilateral ODM in goats (Boutinaud et al., Reference Boutinaud, Rousseau, Keisler and Jammes2003). An increase in cell death in mammary tissue was reported after 4 weeks of unilateral ODM in goats (Li et al., Reference Li, Rudland, Fernig, Finch and Wilde1999). We found that the milk yield of ODM/TDM goats reached that of the control goats as soon as TDM was resumed. The carryover effect of ODM seems to be dependent on the duration of its application (Pomiès et al., Reference Pomiès, Marnet, Cournut, Barillet, Guinard-Flament and Rémond2008). According to Li et al. (Reference Li, Rudland, Fernig, Finch and Wilde1999), apoptosis induction during ODM is a time-dependent phenomenon with high DNA laddering in mammary tissue after 4 weeks, but not after 10 weeks, in glands subjected unilaterally to ODM. However, our data obtained with milk cells suggested a higher loss of epithelial cells through the milk during ODM as already observed in a previous study (Ben Chedly et al., Reference Ben Chedly, Lacasse, Marnet, Komara, Marion and Boutinaud2011). Further studies should be investigated in order to know whether the higher exfoliation of MEC could account for the reduction in milk yield. The absence of any carryover effect of ODM during the TDM period support our histological data and suggests that ODM for 5 weeks did not significantly affect the number of MEC in goat mammary gland.
Despite the lack of an observable increase in cell apoptosis, we observed an increase in pro-apoptotic transcripts in MEC during ODM, which agrees with previous observations related to milk MEC after 1 and 5 weeks of ODM in goats and cows (Boutinaud et al., Reference Boutinaud, Ben Chedly, Delamaire and Guinard-Flament2008; Ben Chedly et al., Reference Ben Chedly, Lacasse, Marnet, Komara, Marion and Boutinaud2011). We can hypothesise that milk accumulation during 24 h in mammary gland induces cellular regulation, which initiated the apoptosis process by overexpressing pro-apoptotic transcripts. However, maintaining the lactogenic stimulus by milking may inhibit the apoptotic process, which may explain the limited detection of the last steps in apoptosis by TUNEL after 2 weeks of ODM in goats. Nevertheless, pro-apoptotic transcripts in mammary tissue biopsies were not affected by the treatment in contrast with results obtained in cows (Boutinaud et al., Reference Boutinaud, Galio and Devinoy2009; Grala et al., Reference Grala, Phyn, Kay, Rius, Littlejohn, Snell and Roche2011). The higher pro-apoptotic gene expression in milk MEC could result from a longer stay of MEC in the cistern of the gland due to 24 h milk accumulation, and that could constitute an artefact of this method of cell collection. Since the viability of milk MEC was similar between the two groups of animals, we believe that milk cells are freshly exfoliated after myoepithelial contraction during the milking. Further investigations on anti-apoptotic transcripts and on the characterisation of apoptosis in milk MEC will give us more information on the mammary apoptotic process during ODM.
In the present experiment, we also investigated the implication of tight junction disruption in the decrease of milk yield during ODM. The disruption of mammary epithelium integrity is a phenomenon associated with a decrease in milk yield (Stelwagen et al., Reference Stelwagen, Hopster, Van der Werf and Blokhuis2000; Leitner et al., Reference Leitner, Chaffer, Shamay, Shapiro, Merin, Ezra, Saran and Silanikove2004; Delamaire and Guinard-Flament, Reference Delamaire and Guinard-Flament2006). The accumulation of milk in mammary gland during less than 18 h for cows and 21 h for goats induces a disruption of tight junctions (Stelwagen et al., Reference Stelwagen, Davis, Farr, Prosser and Sherlock1994 and Reference Stelwagen, Farr, McFadden, Prosser and Davis1997). In our experiment, we showed that ODM induced a disruption of tight junctions as suggested by the studies reporting longer milk accumulation in mammary gland. However, our finding revealed that the disruption of tight junctions occurs only on the first day of ODM application and disappears thereafter. The disruption of mammary epithelium has been associated with a decrease in the expression of constitutive tight and adherens junctions protein such as occludin and E-cadherin respectively (Ben Chedly et al., Reference Ben Chedly, Boutinaud, Bernier-Dodier, Marnet and Lacasse2010). The similar labelling intensity of E-cadherin observed for the ODM/TDM and control groups after 2 days of the ODM period suggests that adherens junctions was not affected by ODM after 2 days of treatment. The analysis of blood lactose concentrations confirmed that tight junctions had already returned to a tight state on the second day of ODM. The similar mRNA levels of E-cadherin and occludin observed in the ODM/TDM group and the control group after the second day and week of ODM is consistent with the similar expression levels of E-cadherin in that period of ODM application. Although the disruption of tight junctions was transient, the decrease in milk yield persisted over the 5 weeks of ODM. This indicates that the disruption of tight and adherens junctions was not essential for the inhibition of milk synthesis during ODM. Nevertheless, we cannot rule out the possibility that the disruption of tight and adherens junctions observed at the onset of ODM may initiate cellular regulation that induces an inhibition of milk synthesis.
The results obtained in this experiment indicate that the decrease in milk yield was largely attributable to a decrease in MEC activity as evidenced by the decrease in milk lactose and protein associated with a downregulation of transcripts involved in milk synthesis. Comparison of gene expression of mammary biopsies and milk cells harvested on consecutive days (days 1 and 2 of each period), shows good level of agreement between the methods for all gene, except for Bax suggesting that milk cells constitute an alternative method for studying gene expression in mammary cells. However, we were unable to demonstrate that ODM affects MEC number. We found no evidence that the disruption of tight junctions was involved in the decrease in milk yield during the ODM period. The inhibition of milk synthesis observed during ODM is attributed to a decrease in MEC synthetic activity rather than to a decrease in their number.
Acknowledgements
The authors would like to thank Sylvie Marion, Laurence Finot, Sandra Wiart-Letort, Thibaud Le Mouel and Nicole Huchet for their technical assistance. Thanks are also extended to Jean-Marc Aubry, Michel Chorho and Eric Siroux for taking care of the goats. We are grateful to Luc Delaby and Steve Méthot for their assistance with the statistical analyses.