Implications
Lipids in red clover silages are less degraded as compared with lipids in ryegrass silages, which have been attributed to a lipid-protective mechanism in red clover. This implicates that less oilseeds would be required to reach milk with a healthier fatty acid profile when feeding red clover instead of ryegrass silages. However, the lipid protection is not transferred to grass lipids in mixed grass–red clover silages.
Introduction
Feeding red clover instead of ryegrass silage leads to an increase in the content of polyunsaturated fatty acids (PUFA) and a decrease of saturated fatty acids in ruminant products (Dewhurst et al., Reference Dewhurst, Fisher, Tweed and Wilkins2003; Lee et al., Reference Lee, Harris, Dewhurst, Merry and Scollan2003; Vanhatalo et al., Reference Vanhatalo, Kuoppala, Toivonen and Shingfield2007). This can be linked to the presence of a high polyphenol oxidase (PPO) activity and elevated concentrations of diphenols in red clover (Van Ranst et al., Reference Van Ranst, Lee and Fievez2011). PPO catalyzes the oxidation of diphenols to quinones, which in turn can bind to nucleophilic binding sites of proteins (Mayer, Reference Mayer2006). When these proteins are plant lipases, lipid metabolism will be influenced (Van Ranst et al., Reference Van Ranst, Fievez, Vandewalle, Van Waes, De Riek and Van Bockstaele2010). Moreover, binding of quinones to and between proteins embedded in a lipid membrane such as the chloroplast might induce the formation of a network of protein-bound phenols and as such encapsulate lipids (Van Ranst et al., Reference Van Ranst, Lee and Fievez2011). Finally, quinones directly binding to lipids cannot be excluded as a third possible protection mechanism (Van Ranst et al., Reference Van Ranst, Lee and Fievez2011). This PPO-diphenol-mediated protection of lipids could offer the perspective of reducing levels of PUFA-rich concentrates (e.g. 18:3n-3 from linseed), when feeding red clover silages instead of the more common ryegrass silages.
However, in practice, pure red clover silages are rather rare as they are difficult to ensile because of their high buffering capacity and low content of water-soluble carbohydrates (WSC) (Buxton and O'Kiely, Reference Buxton and O'Kiely2003). Therefore, mixtures of red clover with ryegrass are more common, as ryegrass increases the ensilability. However, there are no reports on the effects of varying proportions of red clover in mixed red clover/ryegrass silages on the lipid metabolism in the silage and in the rumen. Therefore, it is not known whether the protective properties of PPO in red clover can influence the chemical structure of lipids and their fatty acids (FA) in the co-ensiled ryegrass.
The goal of this research was to study the lipid metabolism in ensiled red clover, ryegrass and their mixtures using lab scale silages. Lipid metabolism in the rumen was evaluated through characterization of lipolysis and of PUFA biohydrogenation reactions in an in vitro batch system.
Material and methods
Plant material
Red clover (Trifolium pratense cv. Lemmon) and perennial ryegrass (Lolium perenne cv. Aberdart) were sown (experimental fields of 1.3 × 7 m; location: 50°59′5′′N/3°46′27′′E) on 12 September 2006 and mowed five times per year. For each forage species, two experimental fields were used. The material in this experiment was harvested on 10 August 2009 (third cut) using a Haldrup harvester. The average yield of the experimental fields was 21.6 and 10.9 kg fresh material/ha for red clover and perennial ryegrass, respectively. The two former cuts were on 19 May 2009 and 30 June 2009. At harvest, red clover was at the early blooming stage.
Silages
Forages were harvested separately, damaged on a clean plastic foil using a tractor and ground roller and mixed in ryegrass/red clover ratios: 100/0, 75/25, 50/50, 25/75 and 0/100 (fresh weight basis). Forages were wilted in a ventilated oven at 30°C to obtain a dry matter content of ∼350 g DM/kg. This wilting process was performed on the day of harvesting, with the ventilated oven being switched off when the target DM was reached. Samples were ensiled the next day. To determine when the target DM was reached, DM content was determined every hour during drying. Therefore, a sample of 50 g of forage was taken per replicate from the ventilated oven. Dry matter value was determined using a microwave oven (800 W, 3 to 5 min). Wilted forage mixtures were ensiled by vacuum packing in thick polyethylene bags (poly nylon vacuum bags 300 × 400 mm and 20 μm thick), using a commercial inoculant (105 CFU Lactobacillus plantarum, 105 CFU Lactobacillus casei and 104 CFU Saccharomyces cerevisiae per ml inoculant; EM-Agriton, Roeselare, Belgium; 4 ml of inoculant diluted in 200 ml of distilled water per 3 kg of wilted material). This resulted in silages of ∼500 g of wilted material. Samples were taken both from fresh and wilted forages, as well as after 1, 2, 4, 11 and 60 days of ensiling. A separate silage was prepared in triplicate for every time point (total of 75 silages).
In vitro rumen incubations
Samples were taken for in vitro rumen incubations from wilted and ensiled (60 days) forages and stored at −20°C until freeze-drying. Lyophilized samples were ground in a mill with a 1 mm sieve (Brabender Technologie, Duisburg, Germany) (Van Ranst et al., Reference Van Ranst, Fievez, Vandewalle, Van Waes, De Riek and Van Bockstaele2010).
Incubations were performed as described by Van Ranst et al. (Reference Van Ranst, Fievez, Vandewalle, Van Waes, De Riek and Van Bockstaele2010). Briefly, 0.25 g of freeze dried and ground plant material was added together with 20 ml of phosphate buffer (pH = 6.5) and 5.0 ml of rumen fluid, strained through a kitchen sieve. Rumen fluid corresponded to a pooled sample taken before morning feeding from two fistulated wethers, given a standard hay diet at maintenance. The flasks were flushed with CO2 to obtain anaerobic conditions and incubated in an oven under continuous shaking at 39°C. After 1, 2, 4, 8 and 24 h of incubation, the flasks were removed from the incubator and the reaction was stopped by quickly cooling the flask in an ice bath. In vitro incubations were performed in three runs in 3 subsequent weeks. Each run included a repetition of each treatment. Therefore, the number of replicates at every time point was three (n = 3). The pH of the rumen fluid was measured just after opening the incubation flask (692 pH/ion; Metrohm, Herisau, Switzerland). Two milliliters of the rumen fluid were taken and acidified with 200 μl of 98% formic acid (J.T. Baker B.V., Deventer, The Netherlands) containing 10 mg/ml of ethylbutyric acid (Sigma-Aldrich, Bornem, Belgium), which was added as an internal standard for volatile fatty acid (VFA) analysis as described further in this paper. To the remainder (23 ml) of the incubation fluid, 15 ml chloroform/methanol (2/1; v/v) was added and samples were stored in the freezer (−18°C) until lipid extraction and isolation of lipid fractions as described further in this paper.
Analysis
PPO activity
Samples (100 g) were taken in triplicate for ryegrass and red clover immediately after harvest, frozen in liquid nitrogen and stored at −80°C until analysis. After grinding the forage samples in a mortar under liquid nitrogen until a powder was obtained, PPO activity was performed according to Van Ranst et al. (Reference Van Ranst, Fievez, Vandewalle, De Riek and Van Bockstaele2009b). Briefly, proteins were extracted using a 0.1 M phosphate buffer with 30 mM ascorbic acid and were denatured with acetone. The pellet, obtained after centrifugation (5000 g, 5 min, 4°C), was re-dissolved in phosphate buffer without ascorbic acid. This purified protein extract was used to measure PPO activity using 4-methyl-catechol (Sigma-Aldrich), with the absorbance being measured at 400 nm every 10 s for 1 min. Activities were expressed relative to the protein content of the extract, which was analyzed using the Folin-Ciocalteau reagent (Sigma-Aldrich) (Van Ranst et al., Reference Van Ranst, Fievez, Vandewalle, De Riek and Van Bockstaele2009b).
Isolation of lipid fractions
For FA analyses (Lourenço et al., Reference Lourenço, Van Ranst, De Smet, Raes and Fievez2007), 40 ml of chloroform/methanol (C/M; 2/1, v/v) and non-esterified C19:0 (internal standard) was added to fresh, wilted and ensiled samples (5 g) on the day of sampling. Endogenous water was determined (105°C for 4 h) to adjust the ratio of C/M/water to 8/4/3 (v/v/v). These extracts were left overnight, and two further extractions with 30 and 20 ml of C/M (2/1; v/v) were performed on the next day. After each extraction step, the C/M layer was separated through centrifugation (1821 g for 10 min), recovered, combined and brought to a final volume of 100 ml with C/M (2/1; v/v). Incubation fluid was stored at −18°C with chloroform/methanol (2/1; v/v) before extraction according to Boeckaert et al. (Reference Boeckaert, Vlaeminck, Mestdagh and Fievez2007). The procedure, including three consecutive extraction steps with C/M (2/1, v/v), was as described for the forage samples, except for the adjustment to the endogenous water content. Moreover, non-esterified C13:0 instead of non-esterified C19:0 was used as internal standard. Extracts were stored at −18°C until further analysis. Lipid extracts of forages were separated into three lipid fractions by solid phase extraction sequentially over a silica gel and an aminopropyl column (adapted from Dreyfus et al., Reference Dreyfus, Guerold, Freysz and Hicks1997). Forage lipids consisted of polar lipids (PLs, mainly composed of glycolipids, phospholipids and sulpholipids), free fatty acids (FFA) and neutral lipids (NL mainly composed of triacylglycerols (TAG), diacylglycerols (DAG) and monoacylglycerols (MAG)). For their isolation, 10 ml of extract was dried under nitrogen stream, redissolved in 300 μl of chloroform and transferred to a glass solid phase extraction column (Sigma-Aldrich) with 600 mg silica gel 60, 220-240 mesh (Fluka, Bornem, Belgium). This was washed twice using 2 ml of chloroform before sample application. The first eluate (TAG + DAG + MAG + FFA) was obtained using 10 ml of chloroform/acetic acid (99/1, v/v) and the second (PLs) using successively 10 ml of acetone/methanol (9/1, v/v) and 5 ml of methanol. Neutral lipids and FFA in the first eluate were separated as follows: the eluate was dried under a stream of nitrogen, redissolved in a small amount of hexane/chloroform/methanol (95/3/2, v/v/v) and transferred to an aminopropyl column, which was previously activated by eluting 7.5 ml hexane before sample application. Neutral lipids were eluted with 8 ml of chloroform, followed by FFA, eluted with 5 ml of diethyl ether/acetic acid (98/2, v/v) and residual PL with 2.5 ml methanol/chloroform (6/1, v/v) and 2.5 ml 0.05 M sodium acetate in methanol/chloroform (6/1, v/v). This latter eluate was added to the PL eluate isolated with the first column. Ten milligrams of internal standard (C21:0) was added to each of the three lipid fractions.
FA separation and quantification
Total FA content and composition of these extracts were analyzed after methylation (Raes et al., Reference Raes, De Smet and Demeyer2001) with NaOH/MeOH, followed by HCl/MeOH through GC separation (Hewlett-Packard 6890 gas chromatograph; Hewlett-Packard, Brussels, Belgium) on a Solgel-wax column (30 m × 0.25 mm × 0.25 μm; SGE Analytical Science; Victoria, Australia). The oven temperature program was as follows: 150°C for 2 min; increased at 3°C/min until 250°C; injector temperature: 250°C; and detector temperature: 280°C. Hydrogen (H2) was used as carrier gas. Two microliters of the sample were injected with a split ratio of 1/50. FA peaks were identified on the basis of their retention times, compared with an external standard (Supelco external standard mix; Supelco Inc., Park Bellefonte, USA). The quantification of FA methyl esters was based on the internal standard and on the conversion of chromatogram peak areas to the weight of FA, using a theoretical relative response factor of each FA (Ackman and Sipos, Reference Ackman and Sipos1964; Wolff et al., Reference Wolff, Bayard and Fabien1995). GC analysis did not allow separation of cis and trans C18:1 isomers and are reported as their respective sums.
Silage characteristics
After opening of silages, samples were taken and stored under vacuum at −18°C for determination of pH, total volatile alkaline compounds and fermentation acids (lactic, acetic, propionic and butyric acids) (Fraser et al., Reference Fraser, Fychan and Jones2004). For determination of fermentation acids, 5 g of fresh silage in 25 ml of distilled water was mixed (1 min) (Ultra-turrax T25; Janke & Kunkel, Staufen, Germany) and shaken (2 h) (Unimax 2010; Heidolph instruments, Schwabach, Germany) at ambient temperature. The pH of this extract was measured using a pH probe (692 pH/ion; Metrohm). To this extract, 10% formic acid, containing 10 mg/ml of ethylbutyrate (Sigma-Aldrich) as internal standard for VFA determination, was added and the extract was purified by filtration through a cheese cloth and centrifugation (10 min at 22 000 × g; 4°C). The supernatant was used for lactic acid analysis through oxidation to acetaldehyde in Conway microdiffusion chambers and spectrophotometry at 224 nm (Conway, Reference Conway1957). Analysis of VFA was performed by gas–liquid chromatography on a Shimadzu GC-14A (Shimadzu Corporation, ‘s-Hertogenbosch, The Netherlands) equipped with a Supelco Nukol capillary column (30 m ×0.25 mm × 0.25 μm; Sigma-Aldrich). H2 was used as carrier gas at a flow of ∼60 ml/min, with a split/splitless of ∼60/1. Inlet and detector temperature was set at 250°C and oven temperature was as follows: start temperature 90°C was held for 1 min, next temperature increased to 130°C at 20°C/min and increased further to a final temperature of 160°C at 5°C/min, held for 5 min. An external standard was used to create a standard series for every separated VFA (acetate, propionate, iso-butyrate, butyrate, iso-valerate, valerate and caproate). Rumen VFAs were analyzed with the same protocol, using incubation fluid after centrifugation and filtration over glass wool.
For determination of WSC and DM content of forages, samples were dried for 48 h at 75°C. Dry matter content was determined by gravimetry before and after drying. For silage samples, a correction was made for the fermentation acids by including the amount of VFA in the DM. Determination of WSC was performed in a water extract using Somogyi's reagent after hydrolysis with 0.05 N sulphuric acid (Wiseman et al., Reference Wiseman, Mallack and Jacobson1960). Water extracts were made from oven-dried samples ground in a Brabender grinder (Brabender Technologie) through a 1 mm sieve. Oven drying can result in losses of WSC, and therefore the results presented are an indication of the concentration rather than the exact concentration.
Methane (CH4)
Before opening the incubation flasks, CH4 and H2 productions were measured, according to the method reported by Hassim et al. (Reference Hassim, Lourenço, Goel, Vlaeminck, Goh and Fievez2010), with a micro-GC composed of two gas chromatographic modules and equipped with a thermal conductivity detector (3000 micro-GC; Agilent, Wilmington, USA). Ethane (C2H6; 1 ml/flask) was used as the internal standard. CH4 and H2 were separated by using the module A, which contained a molecular sieve column (10 m × 0.32 mm ×0.12 μm) with a PLOT U as pre-column (3 m × 0.32 mm ×0.30 μm). Ethane was identified with module B containing a PLOT U column (8 m × 0.32 m × 0.30 μm). The operating conditions for the micro-GC were 100 ms for sample injection, 10 s for sampling and inlet temperature at 100°C. Additional settings for module A were 6 s for backflushing, column temperature at 110°C and pressure of 40 psi, whereas column temperature and pressure for module B were set at 130°C and 28 psi, respectively. Argon was used as the carrier gas for both columns.
Calculation
Forage in silo lipolysis was calculated as the difference in amount of total FA (mg/g DM) in the PL fraction between the wilted and the ensiled forages divided by the amount of total FA (mg/g DM) in the PL of the wilted forage. In vitro rumen biohydrogenation of C18:3n-3 was calculated as follows: [(proportion of C18:3n-3 in total C18 FA)0 h–(proportion of C18:3n-3 in total C18 FA)x h]/(proportion of C18:3n-3 in total C18 FA)0 h. The degree of biohydrogenation of C18:2n-6 was calculated similarly. These calculations assume that degradation and synthesis of C18 FA are insignificant (Wu and Palmquist, Reference Wu and Palmquist1991).
Statistics
All results were analyzed using the general linear models of SPSS 17.0 for Windows (SPSS Inc., Chicago, USA). For the silages, the following model was used: Yij = μ + Si + Rj +Si × Rj + εij, with Si is the effect of ensiling duration (i = 0, 1, 2, 4, 11 or 60 days), and Rj the effect of ryegrass/red clover ratio (j = 100/0, 75/25, 50/50, 25/75 or 0/100) as fixed factors. Interactions between the main effects were tested in the same model. Multiple comparisons were made using a Tukey test.
For the incubation, the following model was used: Yijk = μ +Ii + Tj + Rk + Ii × Tj + Ii × Rk + Tj × Rk + Ii × Tj × Rk + εijk, where Ii is the effect of incubation time (i = 0, 1, 2, 4, 8 or 24 h); Tj the effect of treatment (j = wilted and ensiling for 60 days); and Rk the effect of ryegrass/red clover ratio (k = 100/0, 50/50 or 0/100) as fixed factors. Interactions were tested in the same model. Multiple comparisons were made using a Tukey test.
All mentioned differences were assigned at P < 0.05, unless stated otherwise.
Results
Fresh forages and silages
PPO activities in fresh red clover and ryegrass samples amounted to 5.29 (± 0.120) and 0.10 (± 0.095) nkatal/mg DM, respectively.
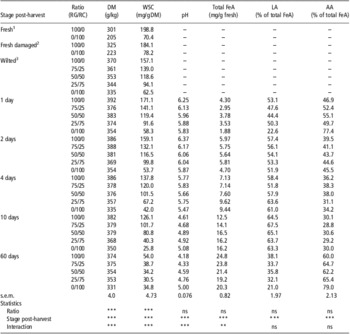
The forages were wilted to reach a DM content of ∼350 g DM/kg to decrease the risk for silage deterioration. At harvest, the DM of grass and red clover was 310 and 205 g DM/kg, respectively, which resulted in a longer drying period for silages with increasing red clover proportions. Despite efforts (hourly checks of DM content by microwave drying), DM contents of the mixtures differed, the highest being 370 g DM/kg for pure ryegrass and the lowest 335 g DM/kg for pure red clover, and the other mixtures were intermediate (Table 1). During ensiling, DM content decreased by about 10% in all silages.
Effect of stage post-harvest (fresh, damaged, wilted and 1, 2, 4, 10 and 60 days after ensiling in lab scale silages) and RG/RC ratio on parameters related to silage quality (DM, WSC, pH, total FeA, LA, and AA) (n = 3)

RG/RC = ryegrass/red clover; DM = dry matter; WSC = water-soluble carbohydrates; FeA = fermentation acids; LA = lactic acid; AA = acetic acid; ns = non-significant.
*0.01 < P < 0.05; **0.001 < P < 0.01; ***P < 0.001.
1Samples taken just before mowing.
2Samples taken after mowing and subsequent damaging using a tractor and a ground roll.
3Samples taken after wilting in a ventilated oven at 30°C until a DM of ∼350 g/kg.
The WSC content, more than double in fresh ryegrass as compared with fresh red clover, decreased slightly during wilting and markedly during ensiling (Table 1). The consumption of these WSC resulted in a drop in pH values in all silages throughout the ensiling process. However, at the end of the ensiling period (60 days), silages with more red clover showed greater pH values. pH values are in line with concentrations of fermentation acids, which increased throughout ensiling. However, lactic acid proportions dropped markedly from 10 to 60 days of ensiling, with a concomitant increase in the acetic acid. Moreover, lactate proportion and content linearly decreased with increasing red clover in the silage, whereas lactate content of pure ryegrass silages did not decrease. Trace amounts of propionic acid and iso-butyric acid were found, whereas concentrations of butyric acid never got above the detection limit (results not shown).
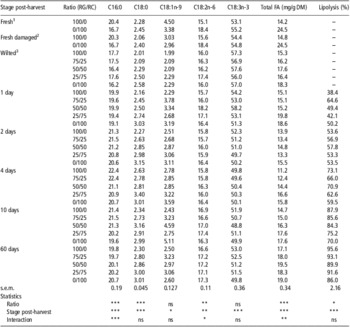
FA content and composition as well as % of lipolysis in PLs of silages are presented in Table 2. Total FA content was much higher in fresh red clover compared with fresh ryegrass (P < 0.001); however, this difference disappeared after wilting and ensiling (P > 0.05). The proportion of C16:0 and C18:1n-9 was higher and C18:2n-6 was lower in fresh ryegrass compared with fresh red clover (P > 0.001). Neither wilting nor ensiling changed the FA composition of the forages, although C18:3n-3 slightly decreased in all mixtures during ensiling (P < 0.001), accompanied by a minor increase in C16:0 and C18:0 (P < 0.001). After 60 days of ensiling, the total FA content slightly increased (P < 0.001).
Effect of stage post-harvest (fresh, damaged, wilted and 1, 2, 4, 10 and 60 days after ensiling in lab scale silages) and RG/RC ratio on FA content and composition (mg/100 g total FA) as well as lipolysis of the polar lipid fraction (n = 3)

RG/RC = ryegrass/red clover; FA = fatty acid; DM = dry matter; ns = non-significant.
*0.01 < P < 0.05; **0.001 < P < 0.01; ***P < 0.001.
1Samples taken just before mowing.
2Samples taken after mowing and subsequent damaging using a tractor and a ground roll.
3Samples taken after wilting in a ventilated oven at 30°C until a DM of ∼350 g/kg.
Lipolysis was very intense in all silages, as 38% or more of all PL present after wilting were hydrolyzed within 1 day of ensiling. Lipolysis increased further throughout the ensiling process (P < 0.001) and was lower in silages with red clover (P < 0.05). At 60 days after ensiling, almost all PLs were hydrolyzed in pure ryegrass silages (95.6%), whereas lipolysis decreased linearly with increasing red clover content in the ensiled mixture (P < 0.001), with pure red clover having the lowest lipolysis (86.0%).
In vitro incubations
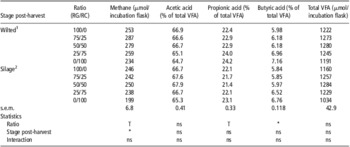
CH4 production was 10% to 15% lower in rumen incubations with silages compared with wilted forages (P < 0.05), regardless of the RG/RC ratio (P > 0.05) (Table 3). Further, increasing red clover proportions in the mixed silages tended to reduce CH4 (P = 0.07) with concomitant increases in propionate proportions (P = 0.08), whereas total VFA productions and acetate proportions did not change (P > 0.05). Butyric acid proportions were slightly higher in incubations with a higher proportion of red clover (P < 0.05).
Effect of stage post-harvest (wilted and 60 days after ensiling) and RG/RC ratio on methane production, VFA production and composition of the rumen fluid after 24 h of in vitro batch incubation (n = 3)

RG/RC = ryegrass/red clover; VFA = volatile fatty acid; ns = non-significant.
T: 0.05 < P < 0.1; *0.01 < P < 0.05.
1Incubation of forages that were wilted in a ventilated oven at 30°C until a DM of ∼350 g/kg.
2Forages were ensiled for 60 days in lab scale silages by vacuum packing in polyethylene bags.
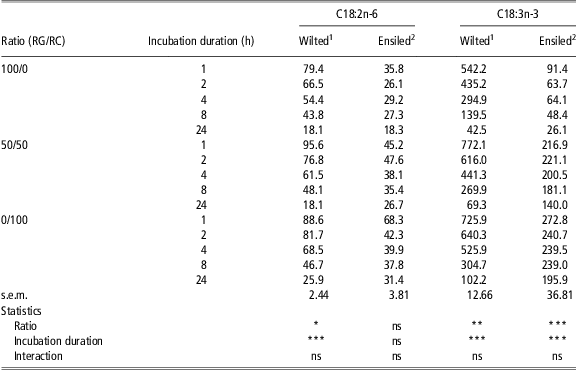
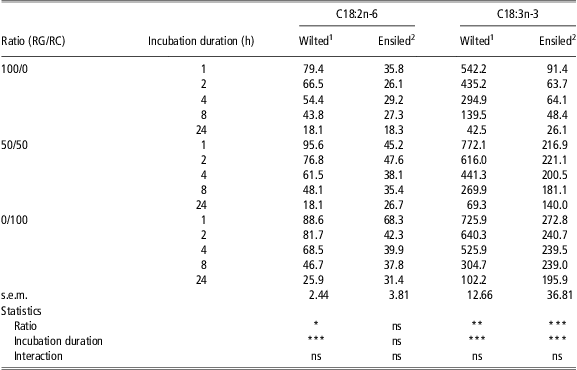
Lipolysis was assessed from the amount of C18:2n-6 and C18:3n-3 in the PL fraction, which decreased during the in vitro rumen incubations (P < 0.001) (Table 4). Generally, the extent of lipolysis from the PL fraction was lower in mixtures with red clover and lowest in pure red clover incubations (P < 0.001): only 28% of C18:3n-3 disappeared from the PL fraction during 24 h incubations with pure red clover silage, whereas this amount increased up to 72% for pure ryegrass silages (Table 4). However, the effect of red clover seemed to be less pronounced for C18:2n-6 (P < 0.05) than for C18:3n-3 (P < 0.001), and in wilted forages (P < 0.01) than in silages (P < 0.001). Indeed, after 24 h incubations of the 50/50 and 0/100 RG/RC mixtures, the amount of C18:3n-3 in the PL fraction was twice as high in silages as compared with wilted forages, despite the higher pre-ruminal lipolysis in the ensiled forages. The latter is reflected in the lower amounts of C18:2n-6 and C18:3n-3 in the PL fraction of silages at the start of the incubation (Table 4).
Effect of stage post-harvest (wilted and 60 days after ensiling) and RG/RC ratio on amount of C18:2n-6 and C18:3n-3 in the polar lipid fraction expressed as ng of FA/incubation flask of 25 ml after batch in vitro incubations of 1, 2, 4, 8 and 24 h (n = 3)
RG/RC = ryegrass/red clover; FA = fatty acid; ns = non-significant.
*0.01 < P < 0.05; **0.001 < P < 0.01; ***P < 0.001.
1Incubation of forages that were wilted in a ventilated oven at 30°C until a DM of ∼350 g/kg.
2Forages were ensiled for 60 days in lab scale silages by vacuum packing in polyethylene bags.
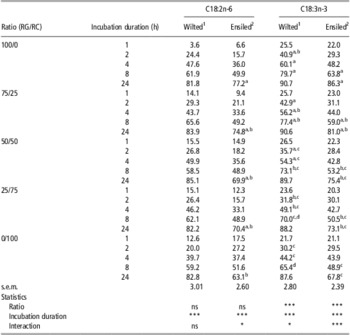
The RG/RC ratio of wilted forages did not affect biohydrogenation of C18:2n-6 (P > 0.05) (Table 5), whereas biohydrogenation of C18:3n-3 was lower with increasing red clover content in the mixtures after 2, 4 and 8 h of incubation (P < 0.001); however, this difference disappeared after 24 h (P > 0.05). For the incubations of the ensiled forages, biohydrogenation of C18:2n-6 as well as C18:3n-3 was lower with increasing red clover content (P < 0.001), although these effects only appeared after 8 and/or 24 h of incubation.
Effect of stage post-harvest (wilted and 60 days after ensiling) and RG/RC ratio on biohydrogenation (%) of C18:2n-6 and C18:3n-3 after batch in vitro incubations of 1, 2, 4, 8 and 24 h (n = 3)

RG/RC = ryegrass/red clover; ns = non-significant.
*0.01 < P < 0.05; ***P < 0.001.
a,b,c,dSignificant differences (P < 0.05) between ratios within incubation time and stage post-harvest (wilted or ensiled).
1Incubation of forages that were wilted in a ventilated oven at 30°C until a DM of ∼350 g/kg.
2Forages were ensiled for 60 days in lab scale silages by vacuum packing in polyethylene bags.
Biohydrogenation generally was lower in silages than in wilted forages, but larger differences were observed with increasing red clover content of the mixture.
Discussion
Silages
Lower lactic acid concentrations and concomitant higher pH values illustrate the difficulty of ensiling red clover, even with inoculum. This is partially because of its low WSC content (2.8 times lower than in ryegrass) and a possible higher buffering capacity of red clover (Buxton and O'Kiely, Reference Buxton and O'Kiely2003). Although silage butyrate concentrations were negligible and pH values were below 5, high acetate concentrations in all 60-day silages suggest that silage chemical characteristics were unstable. Such high levels of acetic acid have not been observed in earlier experiments using the same ensiling technique (Van Ranst et al., Reference Van Ranst, Fievez, De Riek and Van Bockstaele2009a and Reference Van Ranst, Fievez, Vandewalle, De Riek and Van Bockstaele2009b). VFA productions during incubations were corrected for the amount of acetic acid present in the incubated plant material.
The decrease in total FA content without concomitant changes in the FA profile of red clover during wilting could be because of the almost inevitable loss of red clover leaves during handling of the forage. No oxidation of PUFA was observed, as indicated by unchanged PUFA proportions. However, this could be because of the artificial method of wilting, which shortened the wilting process. A short wilting process was reported to reduce losses of PUFA (Dewhurst and King, Reference Dewhurst and King1998). Furthermore, not all authors found a reduction in PUFA content of forages during wilting (Arvidsson et al., Reference Arvidsson, Gustavsson and Martinsson2009). A small reduction in C18:3n-3 proportion in silages has been found earlier (Van Ranst et al., Reference Van Ranst, Fievez, Vandewalle, Van Waes, De Riek and Van Bockstaele2010). An increase in silage FA content was also reported by several authors (Arvidsson et al., Reference Arvidsson, Gustavsson and Martinsson2009; Van Ranst et al., Reference Van Ranst, Fievez, De Riek and Van Bockstaele2009a and Reference Van Ranst, Fievez, Vandewalle, De Riek and Van Bockstaele2009b; Alves et al., Reference Alves, Cabrita, Jeronimo, Bessa and Fonseca2011) and is most likely due to DM losses, leading to a relative increase in FA content when expressed on a DM basis.
The lower extent of lipolysis in pure red clover silages compared with ryegrass silages is in accordance with earlier findings (Van Ranst et al., Reference Van Ranst, Fievez, De Riek and Van Bockstaele2009a and Reference Van Ranst, Fievez, Vandewalle, De Riek and Van Bockstaele2009b). It has been suggested that lower lipolysis in red clover would be because of the presence of a high PPO activity (Lee et al., Reference Lee, Scott, Tweed, Minchin and Davies2008). Monitoring the extent of lipolysis over varying periods of the ensiling process was hypothesized to allow some speculation on the protection mechanism. During the first few days after ensiling, plant lipases are particularly active, followed by bacterial lipases. Hence, a reduction in the extent of lipolysis due to the inhibition of (plant) lipases should be obvious at the beginning of the ensiling process. As differences in the extent of lipolysis between high and low red clover containing silages only occurred after 4 days of ensiling, it seems unlikely that this difference originates from an inhibition of plant lipases. Most probably, the protection will be because of a protection of lipids (e.g. by encapsulation). In this respect, FAs within the red clover chloroplasts, where PPO mainly resides (Lee et al., Reference Lee, Tweed, Cookson and Sullivan2009), might be protected best. Indeed, the linear increase in lipolysis with increasing ryegrass content suggests that ryegrass lipids were unaffected by the red clover incorporation in the silage. Apparently, PPO activity in red clover does not protect lipids of other forages, wilted and ensiled in combination with red clover, which might be because of dislocation of red clover PPO and ryegrass FA.
In vitro incubations
Only minor differences in VFA production and proportions occurred after 24 h of incubation. However, after a short incubation time (up to 4 h) differences did occur (results not shown). VFA production initially was lower with silages compared with wilted forages up until 8 h of incubation and until 2 h of incubation, proportions of acetate were higher and propionate was lower in incubations with wilted compared with ensiled mixtures. Lactic acid in silages, which is quickly fermented (<25 min), mainly results in the formation of propionate (Jalc et al., Reference Jalc, Laukova, Varadyova, Homolka and Koukolova2009; Lima et al., Reference Lima, Lourenço, Diaz, Castro and Fievez2010). The latter is in line with the lower CH4 production, as an increased propionate formation can lead to a lower CH4 excretion (Demeyer and Fievez, Reference Demeyer and Fievez2000) and has been reported before for ensiled forages (Lima et al., Reference Lima, Diaz, Castro and Fievez2011). Conversely, in the in vivo experiment by Van Dorland et al. (Reference Van Dorland, Wettstein, Leuenberger and Kreuzer2007), no difference in the CH4 excretion by dairy cows fed fresh or ensiled forages was found.
Lipolysis in the rumen was lower with increasing red clover content of the incubated mixtures. However, the effect of red clover content was less pronounced for C18:2n-6 than for C18:3n-3, which might be related to differences in location of both FAs in the plant and the protection mechanism of PPO. Most C18:3n-3 is located in the chloroplast as monogalactosyl diacylglycerols and digalactosyl diacylglycerols, whereas C18:2n-6 is more distributed over different lipid classes (Hawke, Reference Hawke1973), which occur in different plant organelles. This supports our former hypothesis that protection of red clover lipids is due to encapsulation of the chloroplast (Van Ranst et al., Reference Van Ranst, Lee and Fievez2011).
More extensive lipolysis and biohydrogenation of C18:3n-3 from wilted than ensiled mixtures with red clover would suggest that protection continued after ensiling. This might be surprising as PPO requires oxygen to induce quinone formation. It is unlikely that excessive amounts of quinones would be formed during wilting, but would only bind to proteins after ensiling. Such situation of high PPO activity rather favors binding of quinones to quinones (Grabber, Reference Grabber2008; Van Ranst et al., Reference Van Ranst, Fievez, Vandewalle, Van Waes, De Riek and Van Bockstaele2010). Nevertheless, a network of quinones with proteins seems essential for a successful encapsulation. Most likely quinones are still formed after ensiling with the small amounts of oxygen, which are still present. This slow formation of quinones has been suggested before to stimulate binding of quinones to proteins (Grabber, Reference Grabber2008; Van Ranst et al., Reference Van Ranst, Fievez, Vandewalle, Van Waes, De Riek and Van Bockstaele2010).
As opposed to earlier findings of Van Ranst et al. (Reference Van Ranst, Fievez, Vandewalle, Van Waes, De Riek and Van Bockstaele2010), intensity of PUFA hydrogenation in incubations with silages was lower or similar to that with wilted forages. This suggests that, in the current experiment, the high pre-ruminal lipolysis in the silage was not the rate limiting step to PUFA biohydrogenation in the rumen.
Conclusions
Increasing proportions of red clover content in mixed silages resulted in lower lipolysis of PL. Furthermore, lipolysis of the PL-fraction and biohydrogenation of their C18:2 and C18:3 were lower after 24 h in vitro batch incubations with mixtures with increasing red clover content.
However, the decrease in lipid degradation and biohydrogenation with increasing red clover content was linear, indicating that lipids from co-ensiled ryegrass were not influenced by the red clover protection mechanism.
Acknowledgments
PhD Grant of G. Van Ranst is funded by the Institute for Agriculture and Fisheries Research (ILVO) – Belgium. Research is partially funded by IWT – Institute for the Promotion of Innovation by Science and Technology in Flanders. The authors highly appreciate the technical assistance of the staff of LANUPRO (UGent) and, more particularly, Sjarai Deschildre and Charlotte Melis and the staff of ILVO – Unit Plant.