Introduction
All of the common personality traits studied seem to be genetically influenced (Torgersen, Reference Torgersen2005a). This also applies to personality dimensions assessed by questionnaires that measure dysfunctional, abnormal personality traits (Jang et al. Reference Jang, Livesley, Vernon and Jackson1996). As common personality traits share around half the variance with personality disorders (PDs) (Costa & McCrae, Reference Costa and McCrae1990; Trull, Reference Trull1992; Soldz et al. Reference Soldz, Budman, Demby and Merry1993), it is likely that PDs measured by interview are also genetically influenced. Previous twin research has identified significant heritabilities of PD and PD traits using a nationwide Norwegian patient twin population (Torgersen et al. Reference Torgersen, Lygren, Øien, Skre, Onstad, Edvardsen, Tambs and Kringlen2000), and a sample of twin children rated by their parents (Coolidge et al. Reference Coolidge, Thede and Jang2001). We have also published results showing a genetic influence on cluster A (Kendler et al. Reference Kendler, Czajkowski, Tambs, Torgersen, Aggen, Neal and Reichborn-Kjennerud2006) and cluster C disorders (Reichborn-Kjenerud et al. Reference Reichborn-Kjennerud, Czaikowski, Neale, Ørstavik, Torgersen, Tambs, Røysamb, Harris and Kendler2007). However, up to now, no genetic study of adult cluster B PDs in the general population has been available.
The initial establishment of PD clusters in DSM-III (APA, 1980) was based more on clinical experience than on systematic research. Even so, the PDs within cluster B, the dramatic cluster, have been shown to correlate in empirical studies (Zimmerman & Coryell, Reference Zimmerman and Coryell1989; Fossati et al. Reference Fossati, Maffei, Bagnoto, Battaglia, Donati, Donimi, Fiorilli, Novella and Prolo2000; Grilo & McGlashan, Reference Grilo and McGlashan2000) and to be highly co-morbid (Fossati et al. Reference Fossati, Maffei, Bagnoto, Battaglia, Donati, Donimi, Fiorilli, Novella and Prolo2000; Zimmerman et al. Reference Zimmerman, Rotschild and Chelminski2005), and the relevant PD traits to load on the same underlying latent factor (Zimmerman & Coryell, Reference Zimmerman and Coryell1990; Moldin et al. Reference Moldin, Rice, Erlenmeyer-Kimling and Squires-Wheeler1994).
One question that has not been systematically addressed is the extent to which these correlations across the dramatic cluster PDs can be explained by common genetic factors versus common environmental factors. Furthermore, is there more common genetic or environmental etiology for some subgroups of dramatic PD than for the rest? Using a recently completed population-based twin study of PDs using personal interviews (Kendler et al. Reference Kendler, Czajkowski, Tambs, Torgersen, Aggen, Neal and Reichborn-Kjennerud2006; Reichborn-Kjenerud et al. Reference Reichborn-Kjennerud, Czaikowski, Neale, Ørstavik, Torgersen, Tambs, Røysamb, Harris and Kendler2007), this study addresses these questions.
Method
Sample
Data for this study came from the Norwegian Institute of Public Health Twin Panel (NIPHTP). The NIPHTP is described in detail elsewhere (Harris et al. Reference Harris, Magnus and Tambs2002). The twins are identified through information contained in the national Medical Birth Registry, established 1 January 1967, which receives mandatory notification of all live- and stillbirths of at least 16 weeks' gestation. The current panel includes information on 15 370 same- and opposite-sex twins born 1967–1979. During that time period, the proportion of pairs that survived to age 3 ranged from 82% to 89%. Two questionnaire studies have been conducted thus far, in 1992 (twins born 1967–1974) and in 1998 (twins born 1967–1979). Altogether, 12 700 twins received the second questionnaire, and 8045 responded after one reminder (response rate 63%), including 3334 complete twin pairs and 1377 single responders.
The present report is derived from an interview study of Axis I and Axis II Mental Disorders that began in 1999. Participants were recruited from the 3153 complete pairs who responded to the second questionnaire and who agreed to participate in the interview study, and 68 pairs who were drawn directly from NIPHTP. A total of 2794 twins (44% of those eligible) were interviewed for the assessment of PDs. Approval was received from the Norwegian Data Inspectorate and the Regional Ethical Committee, and written informed consent was obtained from all participants after complete description of the study. The mean age of participants was 28.2 years (range 19–36). Zygosity was determined using molecular markers for 677 of the 1046 same-sex pairs, the remaining 369 pairs who were same-sex and did not have DNA available for zygosity testing were classified by the means of questionnaire items filled out by all the twins. Discrepancy between classification based on questionnaire and DNA markers was detected in 17 of these 369 pairs (2.51%). As we knew without error the zygosity in the remainder of the pairs, this implies a misclassification rate of 0.67% for the whole sample. The sample consists of: 221 monozygotic male (MZM) pairs, 116 dizygotic male (DZM) pairs, 448 monozygotic female (MZF) pairs, 261 dizygotic female (DZF) pairs, 340 dizygotic opposite-sex (DZO) pairs and 22 single responders.
Measures
A Norwegian version of the Structured Interview for DSM-IV Personality Disorders (SIDP-IV; Pfohl et al. Reference Pfohl, Blum and Zimmerman1995) was used to assess the PDs. This instrument is a comprehensive semi-structured diagnostic interview for the assessment of all DSM-IV Axis II diagnoses. The SIDP was initially developed in 1983, and has been used in a number of studies in many countries including Norway [Torgersen et al. Reference Torgersen, Kringlen and Cramer2001 (SIDP-III-R); Helgeland & Torgersen, Reference Helgeland and Torgersen2004]. The instrument includes non-pejorative questions organized into topical sections (e.g. ‘social relationships’, ‘work style’, ‘emotions’) rather than disorders. This allows for a more natural flow of the interview and increases the likelihood that useful information from related questions is taken into account when rating related criteria within that section. The specific DSM-IV criterion associated with each set of questions is rated according to the following scoring guidelines: 0=not present or limited to rare isolated examples, 1=subthreshold – some evidence of the trait, but it is not sufficiently pervasive to consider the criterion present, 2=present – criterion is clearly present for most of the last 5 years (i.e. present at least 50% of the time during the past 5 years), 3=strongly present – criterion is associated with subjective distress or some impairment in social or occupational functioning, or intimate relationships. The SIDP-IV interview is conducted after the interview in which Axis I disorders are assessed. This helps the interviewer to distinguish long-standing behavior reported by the subject from temporary states due to an episodic psychiatric disorder. The SIDP-IV uses the ‘5-year rule’. This means that the behavior, cognitions and feelings that have predominated for most of the past 5 years are considered to be representative of the individual's long-term personality functioning.
Interviewers were primarily psychology students in the final part of their training or experienced psychiatric nurses, and were trained by professionals (one psychiatrist and two psychologists) with extensive previous experience with the instrument. Interviewers were monitored closely during the whole data collection period, and regular meetings were held with all interviewers present to discuss potential problems. The interviews were carried out between June 1999 and May 2004, and were for the most part conducted face-to-face. For practical reasons, 231 interviews (8.3%) were conducted over the telephone. Each twin in a pair was interviewed by different interviewers. Inter-rater reliability was assessed based on the scoring of 70 audio-taped interviews by two raters. The number of subjects with specific PDs was too low to calculate κ coefficients. Instead, intra-class correlations for the scaled PDs were used, and the correlation for the number of subclinical criteria scored was found to be 0.91 for antisocial (ASPD), 0.93 for borderline (BPD), 0.85 for histrionic (HPD) and 0.86 for narcissistic PD (NPD).
Statistical analysis
Coding of personality disorder
The prevalence rates for fully syndromal DSM-IV cluster B PD diagnoses were 0.4% for BPD, 0.1% for HPD, 0.04% for NPD and 0.3% for ASPD. Despite our large sample size, the prevalence of these categorical diagnoses was too low to produce stable estimates for model-fitting (Neale et al. Reference Neale, Eaves and Kendler1994). To make use of the maximum amount of information in our data, we therefore used a dimensional approach based on subclinical criteria. Our dimensional representation of the PDs was defined as the number of criteria scored one or higher. To avoid empty cells in the twin/co-twin contingency tables, the sum-score was concatenated for each disorder, resulting in three categories for ASPD and BPD, and four for HPD and NPD. Data were therefore analyzed as ordinal, with variances in the underlying liability constrained to unity. Thresholds corresponding to the proportion of individuals in each category were estimated as part of the structural equation modeling.
Using dimensional measures of subclinical criteria assumes that the liability of each underlying PD trait is continuous and normally distributed, that is that the number of endorsed criteria represents different degrees of severity. We evaluated this assumption using a multiple threshold test that examines the extent to which the two twins' responses can be modeled as a bivariate normal density. These models were tested using single liability tests that were performed for each individual criteria within a PD (to evaluate whether the 0–3 scoring followed a single liability dimension), and also for the summary criteria scores for each of the four PDs. All single liability tests were performed using prelis, a module in lisrel (Jöreskog & Sörbom, Reference Jöreskog and Sörbom1993).
Twin analyses
The classical twin model partitions the variance of the observed variable into the effects of three latent variables: additive genetic effects (A), shared environment (C) and non-shared environment factors (E). Additive genetic effects (A) are the linear contributions to the phenotype of independent genetic loci. As DZ twins on average share half their genes, and MZ twins have identical genotypes, additive genetic effects are correlated 0.5 in DZ twins, and 1.0 in MZ twins. Shared environmental factors (C) are those aspects of the environment that both the twins share, such as family environment, social class, school, and place of residence, and are therefore correlated 1.0 across twins, regardless of zygosity. If the premise of equal environments holds, shared environmental influences would increase phenotypic similarity equally in both MZ and DZ twins. Finally, any remaining variance is attributed to environmental influences (E) that are unique to each twin. Defined this way, E also includes measurement error. Two forms of sex-dependent genetic effects can also be explored in twin data. Quantitative effects reflect differing magnitudes of genetic or environmental effects in the two sexes. If data on opposite-sex twins are available, we can also estimate qualitative sex effects, which determine whether the same genetic and environmental factors influence males and females (Neale et al. Reference Neale, Røysamb and Jacobson2006). Such sex effects are suggested if the correlation in opposite-sex DZ twins is lower than that seen in same-sex DZ pairs.
Multivariate models allow us to partition not only the variance of the individual phenotypes but also the covariance between the phenotypes. However, although the choice of model and fitting procedure is fairly straightforward in standard univariate analyses, there are many multivariate models to choose from, as well as many ways to go about fitting them.
We chose an independent pathway model as the full model. The independent pathway model partitions the phenotypic correlation into factors common to all the phenotypes (Ac, Cc and Ec), and effects specific to each phenotype (As, Cs and Es). At least three observed variables are needed to identify the standard independent pathway model. Given that cluster B contains four PDs, additional information was available to explore whether any pair of PDs resemble one another more than could be predicted from the single common factor. One caveat was necessary for this approach. As a result of the limited information available, all the paths to these two PDs from the additional two-PD factor had to be constrained to equality. Therefore, after fitting a standard common factor model with specifics, we systematically added to this model, one at a time, each of the six possible pairings of two cluster B PDs.
Structural equation modeling was used to estimate the relative contribution of three factors underlying the individual variation in liability. The models were fitted by means of maximum likelihood (ML) to the observed raw data. ML analyses of raw ordinal data do not directly provide an overall test of goodness-of-fit, but relative fits of nested submodels against the full model are possible. Our goal here was to obtain the model with the minimum Akaike's Information Criterion (AIC) value, calculated as χ2−2df (Akaike, Reference Akaike1987). This best-fit model should provide a good balance of parsimony and explanatory power.
Full information ML estimation of multivariate categorical twin models is highly computationally demanding. To simplify the analyses, we therefore initially determined whether there was any indication of quantitative or qualitative sex effects in fitting standard univariate twin models to the disorders individually. None of the analyses of the individual PDs indicated any evidence for sex effects and so these were not included in our multivariate models.
Equal environment assumption (EAA)
The EAA is fundamental in twin modeling, and states that DZ twins share as much of their environment as do MZ twins with respect to the target variable. If this assumption is violated, a difference in observed similarity between MZ and DZ twins that is caused by (non-elicited) environmental influence may be wrongly attributed to genetic factors. To test possible effect of violations of the EAA in our sample, a polychotomous logistic regression was fitted, controlling for the correlational structure of our data using independent estimating equations as operationalized in the SAS procedure genmod (SAS Consulting, Department of Statistics, 2002). Two variables that reflected, respectively, similarity of childhood (number of years that the twins were in the same class at school and the years the twins lived in the same residence) and adult environments (frequency of in-person and telephone contact during the past year and the distance between their current residences) were constructed. We then tested whether the dimensional PD score in twin 1 interacted with our measure of environmental similarity in predicting the dimensional PD score in twin 2 (dependent variable), while controlling for main effects of zygosity, sex, age and level of environmental similarity. The interaction term was found to be non-significant for twin contact during childhood and during adulthood in all cluster B PDs (p<0.10).
Results
Prevalences
As mentioned above, given the low prevalence of ‘true’ clinical PD, we decided to apply subclinical criteria and treat each PD as a dimensional trait. Using this method of coding PD, we found that 25.8% had at least one subclinical or clinical criterion of ASPD, and 5.0% had at least three criteria. The corresponding percentages for BPD, HPD and NPD were 48.0% and 3.5%, 52.0% and 2.8%, and 47.2% and 1.8% respectively.
Co-morbidity and cross-correlations
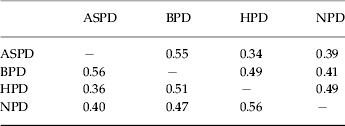
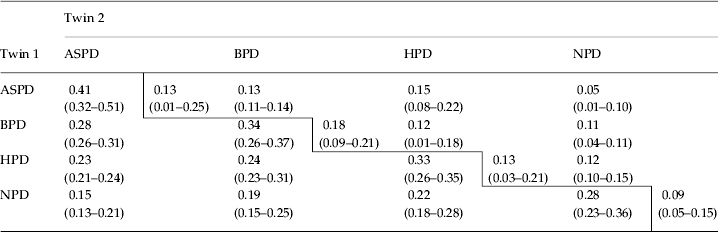
Table 1 depicts within-individual phenotypic polychoric correlations for endorsed criteria found between the various cluster B PDs. The cross-trait within-twin correlations varied between 0.34 and 0.56, and were similar for MZ and DZ twins. The between-twin correlations in MZ pairs (Table 2) are somewhat lower, indicating the importance of non-shared environmental influences on risk for these PDs. Apart from BPD, MZ twin correlations are equal to or greater than double that of DZ twins, suggesting little role for shared environmental influences. The same-trait between-twin correlations in MZ twins are all higher than the cross-trait between-twin correlations, indicating some specificity of genetic transmission. ASPD has the highest cross-twin correlation with BPD, suggesting some shared genetic influences between these two PDs. NPD cross-correlates most strongly with HPD, implying shared genetic influences, although HPD also correlates highly with other cluster B PDs in MZ pairs.
Polychoric within-individual correlations by zygosity for cluster B personality disorder (PD) traits

ASPD, Antisocial personality disorder; BPD, borderline personality disorder; HPD, histrionic personality disorder; NPD, narcissistic personality disorder.
Polychoric twin correlations (and 95% confidence intervals) within and across cluster B personality disorder (PD) traits

ASPD, Antisocial personality disorder; BPD, borderline personality disorder; HPD, histrionic personality disorder; NPD, narcissistic personality disorder.
Monozygotic (MZ) twin correlations below the diagonal. Dizygotic (DZ) twin correlations above the diagonal.
Model fitting
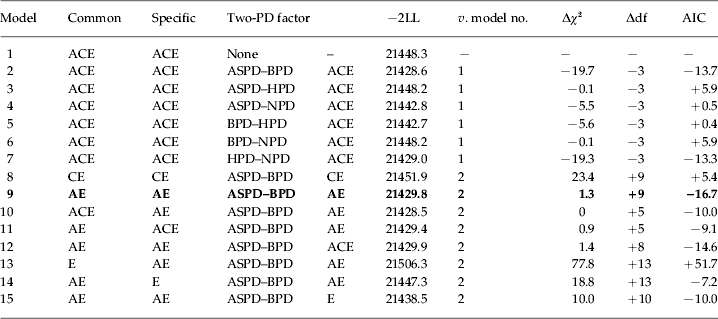
We began our multivariate modeling by fitting an independent pathway model with an additive genetic (A), shared environmental (C) and unique environmental (E) common factor (Table 4, model 1). The next six models added to that basic model a second two-PD factor loading respectively on the following pairs of cluster B PDs: model 2, ASPD–BPD; model 3, ASPD–HPD; model 4, ASPD–NPD; model 5, BPD–HPD; model 6, BPD–NPD; and model 7, HPD–NPD. Because we are adding parameters to model 1, both our degrees of freedom and our measure of fit (−2LL) are declining (so that both our Δdf and Δχ2 are negative). As seen in Table 3, only two of the models (2 and 7) produced an improvement in the AIC compared to model 1, with model 2 fitting modestly better than model 7.
Model fitting for cluster B personality disorder (PD) traits

PD, Personality disorder; LL, log likelihood; df, degrees of freedom; AIC, Akaike's information criterion (Akaike, Reference Akaike1987); A, additive genetic effects; C, shared environmental factors; E, unique environmental factors; ASPD, antisocial personality disorder; BPD, borderline personality disorder; HPD, histrionic personality disorder; NPD, narcissistic personality disorder.
Best-fit model shown in bold.
For models 2–7, we are adding parameters to model 1. Therefore, both our degrees of freedom and the value of −2LL are declining and our Δdf and Δχ2 are expected to be negative. For models 8–15, we are eliminating parameters from model 2, so we would expect both our Δdf and Δχ2 to be positive.
We next, therefore, attempted to simplify model 2, first by eliminating all genetic effects (model 8) and then by eliminating all shared environmental effects (model 9). (We are now eliminating parameters from model 2, so both our Δdf and Δχ2 are positive.) Compared to model 2, model 9 fit much better. To ensure that we did not miss a specific source of shared environment, we tried to add back, one at a time, shared environment for the common factor (model 10), for individual specific PDs (model 11) and for the two-PD factor (model 12). None of these models produced an improvement in fit over model 9.
Finally, we tried to simplify model 9 further by eliminating genetic effects from the common factor (model 8), from the individual specific PDs (model 14) and for the two-PD factor (model 15). None of these models produced an AIC superior to that found for model 9, which we therefore declared to be our best-fit model.
Parameter estimates
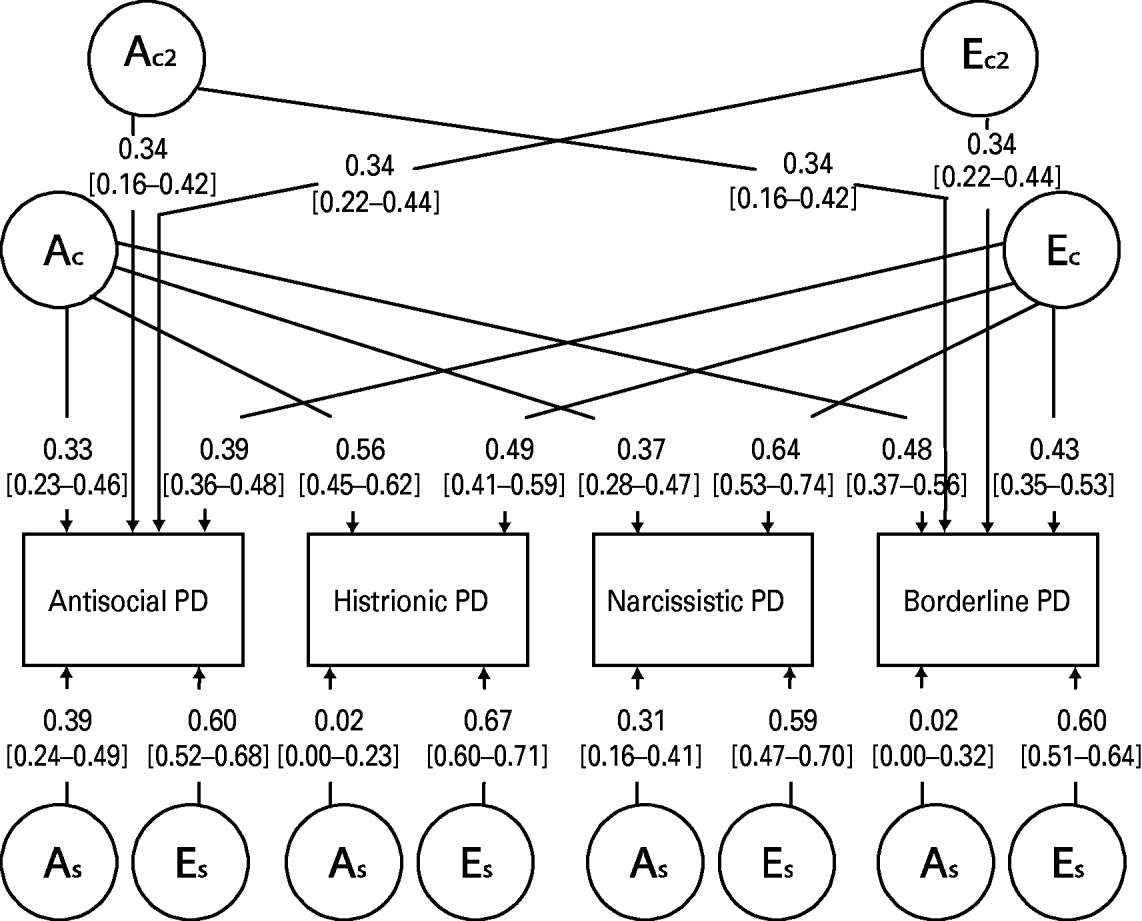
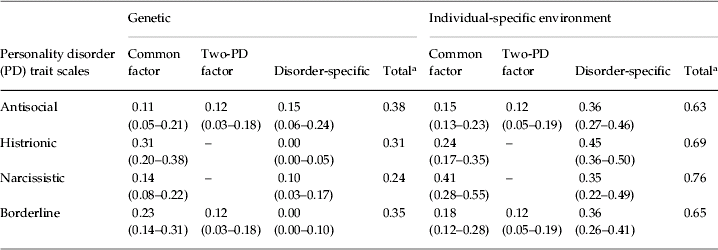
Parameter estimates for the best-fit model 9 are seen in Fig. 1 and Table 4. Some of the results are particularly noteworthy. First, the level of total heritability for the cluster B PDs was generally modest, estimated at 0.38 for ASPD, 0.31 for HPD, 0.24 for NPD and 0.35 for BPD. Second, the genetic common factor contributed substantially to all four PDs, with the strongest effect on HPD and the weakest on ASPD. Third, the importance of PD-specific genetic effects differ very widely across the four PDs, making substantial contributions to total variance for ASPD and NPD and very small or absent effects for HPD and BPD. Fourth, the common unique environmental factor made fairly significant contributions to all four PDs, suggesting that certain life experiences not shared with co-twins influence risk to all four cluster B PDs. Fifth, as expected, substantial unique environmental loadings were seen that were specific to each PD. These loadings probably derived from environmental experiences that specifically influenced liability to one particular PD, as well as from measurement error.
Standardized parameter estimates from model 9 in Table 3. A stands for additive genetic effects, C for shared environmental and E for unique environmental factors. The subscripts C, C2 and S stand for, respectively, common across all four cluster B personality disorder (PD) dimensions, confined in their effect to antisocial (ASPD) and borderline PD (BPD) dimensions, and specific to the individual PD dimensions.

Parameter estimates for the final model (9) in Table 3

a Estimates will not always sum to unity due to rounding errors.
Discussion
To our knowledge, this is the first study of cluster B PDs based on a large, population-based sample of twins. Our aims were to investigate to what extent cluster B PDs are influenced by genetic factors, to explore the genetic and environmental sources of the co-morbidity within the cluster, and to look for genetically and/or environmentally determined subclusters within cluster B.
We confirmed previous observations of a high common variance shared by the four cluster B PDs (Zimmerman & Coryell, Reference Zimmerman and Coryell1989, Reference Zimmerman and Coryell1990; Moldin et al. Reference Moldin, Rice, Erlenmeyer-Kimling and Squires-Wheeler1994; Fossati et al. Reference Fossati, Maffei, Bagnoto, Battaglia, Donati, Donimi, Fiorilli, Novella and Prolo2000; Grilo & McGlashan, Reference Grilo and McGlashan2000; Zimmerman et al. Reference Zimmerman, Rotschild and Chelminski2005). The pattern of genetic and the pattern of environmental effects in cluster B are very similar, as is usually observed in multivariate studies of personality (Livesley et al. Reference Livesley, Jang and Vernon1998). We also found additional covariance between ASPD and BPD, as observed in previous studies (Zimmerman & Coryell, Reference Zimmerman and Coryell1989; Moldin et al. Reference Moldin, Rice, Erlenmeyer-Kimling and Squires-Wheeler1994; Fossati et al. Reference Fossati, Maffei, Bagnoto, Battaglia, Donati, Donimi, Fiorilli, Novella and Prolo2000).
We observed a moderate genetic effect on the cluster B PDs. The genetic effect on ASPD was very close to the 0.41 effect that appeared in a meta-analysis of all the published twin, family and adoption studies of ASPD (Rhee & Waldman, Reference Rhee and Waldman2002). As to the other PDs, the genetic effects were far lower than in a previous study of PDs (Torgersen et al. Reference Torgersen, Lygren, Øien, Skre, Onstad, Edvardsen, Tambs and Kringlen2000) in a clinical population. They were also lower than in a study of PD traits among children (Coolidge, Reference Coolidge, Thede and Jang2001) and among personality traits generally assessed by questionnaires (Torgersen, Reference Torgersen2005a). It may be that genetic variation in PD is higher among children, and higher among adults from clinical populations. However, another explanation for the lower heritabilities found in the present study may be related to interviewer effects. In the previous twin study of adult PDs, the same person usually interviewed both twins. In the Coolidge (Reference Coolidge, Thede and Jang2001) study, parents filled out the questionnaire for both of their twins. In the present study, the twins were interviewed by two different interviewers. Interviewer effects could have resulted in a reduced level of twin resemblance. Our studies of cluster A (Kendler et al. Reference Kendler, Czajkowski, Tambs, Torgersen, Aggen, Neal and Reichborn-Kjennerud2006) and cluster B PDs (Reichborn-Kjennerud et al. Reference Reichborn-Kjennerud, Czaikowski, Neale, Ørstavik, Torgersen, Tambs, Røysamb, Harris and Kendler2007) showed comparable heritabilities for PDs (0.21 for paranoid, 0.28 for schizoid 0.26 for schizotypal, 0.35 for avoidant, 0.31 for dependent, and 0.27 for obsessive-compulsive PD).
No shared environmental effect was found. The lack of effect for shared environment is a common observation in twin studies of personality as well as of personality disorders (Torgersen, Reference Torgersen2005a). Even a sample of 50 000 twins and relatives did not disclose an effect of shared family environment for neuroticism (Lake et al. Reference Lake, Eaves, Maes, Heath and Martin2000), and neuroticism is an important aspect of PDs (Saulsman & Page, Reference Saulsman and Page2004, Reference Saulsman and Page2005).
Univariate analyses suggest that the best model did not include sex effects, despite the uneven distribution of the cluster B PDs between the sexes (Torgersen et al. Reference Torgersen, Kringlen and Cramer2001). These results are consistent with Lake et al. (Reference Lake, Eaves, Maes, Heath and Martin2000), who found that the relative influence of genetic and environmental factors on variation in neuroticism did not vary across sex, despite large sex differences in mean level scores.
The common genetic factor for cluster B loaded most strongly on HPD, followed by BPD. The disorder-specific genetic variance, by contrast, was strongest for ASPD and NPD, and very low for both BPD and HPD. These results suggest that HPD and BPD best represent the overall genetic liability to cluster B, whereas ASPD has the most genetic variance unique to that PD. Despite these different profiles, we found evidence that BPD and ASPD shared genetic and environmental risk factors above and beyond those due to the genetic and environmental factors common to all four cluster B PDs. This is particularly surprising, given that ASPD is considerably more common in males (Torgersen et al. Reference Torgersen2005b), and some studies of clinical, but not non-clinical samples, suggest that BPD is more common in females (Morey et al. Reference Morey, Alexander, Boggs, Oldham, Skodol and Bender2005). As has been suggested previously for sociopathy and hysteria (Cloninger et al. Reference Cloninger, Reich and Guze1975), a common set of familial factors might be modified by sex so that they tend to produce BPD symptoms in females and ASPD symptoms in males. Indeed, a factor-analytic study of PD criteria by Nestadt et al. (Reference Nestadt, Eaton, Romanoski, Garrison, Folstein and McHugh1994) suggested that ASPD and BPD had in common high scores on a Scrupulous factor, characterized first and foremost by impulsivity, norm breaking and drug abuse.
In summary, cluster B stands out as an inter-related cluster resting on genetic as well as environmental sources. To what extent the common genetic and environmental variance is due to criteria overlap is not easy to say. In any case, the basic genetic sources of the cluster B disorders warrant that they are grouped together. At the same time, the complicated pattern of common, dual and specific heredity speaks to the value of retaining the diversity of cluster B.
Limitations
There are a number of limitations to this study. First, the prevalence of each specific PD was rather low compared to previous community studies (Torgersen et al. Reference Torgersen, Kringlen and Cramer2001). Hence we used dimensional representations of the PDs to get sufficient statistical power. As PDs have a dimensional, continuous character, there is good reason to apply such a procedure (Torgersen, Reference Torgersen2005b). Nevertheless, there is a possibility that the genetics of categorical diagnoses differ from the dimensional PD traits, but our single liability tests indicated that the number of endorsed traits reflect different degrees of severity on a single PD dimension. Second, the attrition rate may have created a sample that is not representative for the country at large. However, our preliminary analyses of attrition did not disclose a change in the composition of mental disorder symptoms (Harris et al., unpublished observations). Third, there is always some uncertainty around representativeness. Norway may not be representative for Europe, and Europe certainly not of the world. Fourth, the statistical power is weak to detect gender effects and shared environmental effects. However, as earlier mentioned, the study of Lake et al. (Reference Lake, Eaves, Maes, Heath and Martin2000) of neuroticism had very high statistical power without detecting either of the two. In summary, we believe that our study demonstrates the lower boundary of the genetic effects on cluster B PDs, and supports a partially genetic explanation of the co-morbidity among the disorders.
Acknowledgments
This work was supported by the Borderline Disorder Research Foundation and grant MH-068643 from the National Institutes of Health. The twin program of research at the Norwegian Institute of Public Health is supported by grants from the Norwegian Research Council, the Norwegian Foundation for Health and Rehabilitation, and the European Commission under the program ‘Quality of Life and Management of the Living Resources’ of the 5th Framework Program (no. QLG2-CT-2002-01254). We are very grateful to the twins for their participation.
Declaration of Interest
None.