Introduction
Major depression is increasingly recognized as a common but treatable health problem (Blazer, Reference Blazer2003). Depression is particularly insidious in older adults because it results in excess suffering, loss of independence, and even suicidal ideation and completion (Vanderhorst and McLaren, Reference Vanderhorst and McLaren2005). Depression among older adults remains a problem in part because it is unclear how best to intervene.
One avenue of intervention research has targeted social networks and social support. Decades of research has shown that individuals with more social ties have better health outcomes and lower mortality rates across many illnesses and diseases, including cardiovascular disease (Berkman, Reference Berkman1995), human immunodeficiency virus (Kaplan et al., Reference Kaplan, Patterson, Kerner, Atkinson, Heaton and Grant1997), and cancer (Sultan et al., Reference Sultan, Fisher, Voils, Kinney, Sandler and Provenzale2004). In older adults with depression, high levels of support have been linked to less severe symptoms, less functional decline, less time to remission, and greater medication adherence (George et al., Reference George, Blazer, Hughes and Fowler1989; Voils et al., Reference Voils, Steffens, Flint and Bosworth2005). Such findings have led to calls for social support interventions to improve health outcomes (Antonucci, Reference Antonucci and Schaie2001; Watanabe et al., Reference Watanabe, Okumura, Chiu and Wakai2004). However, in order to maximize the effectiveness of interventions, we must have a clear understanding of social relationships among people with depression.
Our current understanding of social relationships in older adults with depression is limited by the scope and methodology of previous studies. First, although many studies have examined social relations among older adults with depression, they have used community samples rather than clinically depressed samples (Krause, Reference Krause1999). Given the low to modest base rate of major depression in community-dwelling elders, the importance of social relationships may be underestimated. Second, many studies have assessed only one aspect of social relations, such as marital status or assistance with activities of daily living (Wittink et al., Reference Wittink, Oslin, Knott, Coyne, Gallo and Zubritsky2005). It is known that there are several dimensions to social relations, including social networks and social support (Antonucci, Reference Antonucci and Schaie2001). Social networks refer to the web of social relationships surrounding a person and the characteristics of those relationships (e.g. network size or density, frequency or duration of contact) (Brissette et al., Reference Brissette, Cohen, Seeman, Cohen, Underwood and Gottlieb2000). In contrast, social support refers to the content and quality of social relations. The distinction between characteristics of social networks and various forms of social support is important because some aspects of social relationships are more strongly related to health than others. For example, perceived support is more strongly associated with health, including depression outcomes, than is the frequency of interaction (George et al., Reference George, Blazer, Hughes and Fowler1989; Bosworth et al., Reference Bosworth, Hays, George and Steffens2002). Moreover, some aspects of social relationships may be more stable or more amenable to intervention than others. For example, Brissette et al. (Reference Brissette, Cohen, Seeman, Cohen, Underwood and Gottlieb2000) suggest that it is easier to change the extent of social integration than perceptions of support.
Another limitation of previous studies is that social networks and social support were often assessed at a single point in time, which assumes that these constructs are stable over time (Morgan et al., Reference Morgan, Neal and Carder1996). According to this logic, one would take a snapshot of social support at any point in time and intervene based on that value. Although social networks and social support may remain fairly stable over the adult life course until very old age in the general population (Carstensen et al., Reference Carstensen, Isaacowitz and Charles1999), this may not be the case for older adults with depression. Recurrence rates of depression in this population are high, estimated at 50–90% (Reynolds et al., Reference Reynolds2006). As depressed older adults’ physical and mental health status changes, so might their social networks and the extent of social support. Although social networks are mobilized in times of crisis (Hogan and Spencer, Reference Hogan and Spencer1993), over extended periods of time, caregiver burden may increase (Ogilvie et al., Reference Ogilvie, Morant and Goodwin2005), or depressed individuals may become aversive (Coyne, Reference Coyne1976), leading network members to withdraw support. Moreover, people with depression may isolate themselves from others, and distorted negativistic thinking may cause depressed individuals to perceive less support than is offered (Newsom, Reference Newsom1999). Knowing whether social networks and social support are stable among older adults with depression would help inform interventions by illuminating whether the focus should be on increasing the amount or quality of interactions.
A final limitation of previous studies is that they have not made clear whether social support interventions could be implemented across all older adults with depression or whether they could be tailored. This is because the statistical methods employed only permitted examination of group means and did not consider the fact that there may be substantial within-person variation in social networks and social support (Morgan et al., Reference Morgan, Neal and Carder1996). Krause (Reference Krause1999) found within-person variation in social support from baseline to three-year follow-up in a large sample of nondepressed older adults. However, little is known about individual differences in intra-individual trajectories of social networks or social support in older adults with depression.
To address these limitations, we performed secondary analyses on data from a large observational study of older adults with depression. Participants received individualized treatment plans at baseline and then were followed for up to five years. Measures of social network size, frequency of interaction, instrumental support, and subjective support were administered at baseline and yearly. Although average depression scores generally decreased, presumably due to treatment, many patients cycled in and out of remission during the five years. This provided an opportunity to examine whether social networks and social support remained stable during the course of these people's lives. We used latent growth curve modeling (Duncan et al., Reference Duncan, Duncan, Strycker, Li and Alpert1999) to examine baseline status and trajectories of social networks and social support at the group and individual levels. Specifically, we investigated whether group (average) levels of social networks and social support changed over time; whether there were individual differences in the direction and rate of change; and whether demographic or clinical characteristics predicted the rate of change.
Method
Design and participants
Data were obtained from the National Institutes of Health Mental Health Clinical Research Center for the Study of Depression in Later Life at Duke University, a longitudinal naturalistic study of depression in older adults. Study participants were outpatients aged 59 or older with a Center for Epidemiologic Studies Depression Scale (Radloff, Reference Radloff1977) score of 16 or above or a diagnosis of major depression. They were recruited by clinic referral. Exclusion criteria included: other neurological or psychiatric illness; current alcohol or drug dependence; clinically diagnosed primary neurological illness (e.g. Alzheimer's); medication or medical illness that affects cognitive function; and physical disability that precluded cognitive testing. Enrollment began in 1994, and data collection is ongoing; 403 older adults with depression have enrolled.
At baseline, participants provided written informed consent and completed a battery of self-report measures, including demographic, clinical, and psychosocial characteristics. In addition, depression status was assessed via a clinical interview (Davidson et al., Reference Davidson, Turnbull, Strickland, Miller and Graves1986). Participants return for neuropsychological testing and psychosocial interviews each year (M = 368 days, SD = 26 days) and a medication management appointment every three months. The protocol was approved by the Duke University Medical Center Institutional Review Board.
Data for the current study included demographic and clinical characteristics assessed at baseline and up to six assessments (baseline and five-yearly assessments) of social networks and social support, which were collected from 1994 to 2003. The sample size for the current analyses, N = 339, is based on the number of participants who had at least one assessment of social networks and social support. As indicated in Table 1, study participants were 69 years of age on average. The majority of individuals were female, and roughly half were married. The average number of lifetime depressive episodes reported at baseline was almost five. The sample was 86% white, with too few minorities to include race in the analyses.
Baseline demographic and clinical characteristics of older adults with depression (N = 339)

aData were missing for one older adult. bData from 20 older adults were excluded: 14 missing values and 6 outliers who responded “95 or more.” cMADRS = Montgomery Montsberg Depression Rating Scale.
Measures
Baseline demographic characteristics included age, sex, years of education completed, and marital status (married/not married). Baseline clinical characteristics included lifetime number of depressive episodes and depression status, which was indicated by the Montgomery Åsberg Depression Rating Scale (MADRS) (Davidson et al., Reference Davidson, Turnbull, Strickland, Miller and Graves1986). The MADRS was designed to assess the severity of depression among patients diagnosed with a depressive illness and to be sensitive to change due to treatment. The MADRS was administered by an interviewer, who rated patients on 10 items (e.g. reduced sleep, apparent sadness) using a scale from 0 to 6, with higher numbers corresponding to greater severity of depression. Internal consistency for the baseline MADRS assessment was 0.83.
Social networks and social support were assessed with the Duke Social Support Index (DSSI) (Landerman et al., Reference Landerman, George, Campbell and Blazer1989), which has four subscales:
Social network size – assessed by four items (e.g. “Other than persons living with you, how many of your brothers and sisters live within one hour's travel of your home?”).
Social interaction – assessed by four items (e.g. “Other than at work, how many times during the past week did you spend some time with someone who does not live with you, that is, you went to see them or they came to visit you, or you went out together?”); response options were not at all, once, twice, three times, four times, five times, six times, and seven times or more, coded from 0 to 7.
Instrumental social support – assessed by twelve items (e.g. “Do your family and friends ever help out when you are sick?”); response options were yes (1) and no (0).
Subjective social support – assessed by ten items (e.g. “When you are talking with your family and friends, do you feel you are being listened to?”); response options were hardly ever (coded as 1), some of the time (2), and most of the time (3).
Summary scores were computed for each domain by summing all relevant items, with higher numbers corresponding to larger networks and more social support. The range of internal consistency estimates across the six subjective social support assessments (baseline and five yearly assessments) was 0.84 to 0.89. Internal consistency was not computed for the other subscales because the items should not be highly intercorrelated (e.g. number of siblings who live within one hour and how much time one spends talking with other people).
analysis
Latent growth curve modeling (Duncan et al., Reference Duncan, Duncan, Strycker, Li and Alpert1999) using AMOS 5.0 was used to examine trajectories of social networks and social support. Latent growth curves provide information about the shape of change (linear vs. nonlinear), the magnitude of change (little vs. great), the rate of change (gradual vs. quick), and the direction of change (positive vs. negative). Specification of a latent growth curve model for a linear trajectory includes two latent variables – an intercept and a slope – and for each, two parameters – the mean and the variance. The mean of the intercept factor represents average initial status, whereas the mean of the slope factor represents average linear growth over time. The variance of the intercept factor represents individual differences in initial status, whereas the variance of the slope factor represents individual differences in linear growth over time.
Separate latent growth curve models were estimated for each social relation subscale. The models were scaled so that the intercept represented baseline scores, and the slope represented linear change per year (see Figure 1). We attempted to model a third factor representing quadratic change; however, the mean and variance of this factor were not significant, indicating no leveling off of scores. The correlation between the intercept and slope factors was estimated in each model. The correlation indicates the extent to which initial status in social support is associated with rate of change over time. For example, we could determine whether participants with lower social support at baseline experience greater increases in social support over time.
Latent growth curve model

Initially, we fit unconditional growth models (i.e. with no other variables in the model) for each social relations subscale. Then, for each subscale, we fit conditional growth models, in which demographic (sex, age, and marital status) and clinical characteristics (lifetime number of depressive episodes and baseline depression status) were added simultaneously as predictors of the intercept and slope factors.
For each model, we report three indexes of model fit: Bentler's Comparative Fit Index (CFI) (Bentler, Reference Bentler1990), the root mean square error of approximation (RMSEA) (Steiger and Lind, Reference Steiger and Lind1980), and χ2. CFI is an incremental fit index that reflects the proportionate improvement in fit of an hypothesized model over a model in which the observed variables are uncorrelated. CFI ranges from 0 to 1; the closer the value to 1, the better the fit. Hu and Bentler (Reference Hu and Bentler1999) suggested that values of 0.95 or above represent superior fit. RMSEA represents the amount of discrepancy per degree of freedom, and thus takes into account model complexity; the closer the value to zero, the better the fit. Browne and Cudeck (Reference Browne, Cudeck, Bollen and Long1993) suggested that a value of 0.05 or less represents close fit, and values of 0.06 to 0.08 represent reasonable fit. To test the hypothesis that the specified model fits the observed covariances, χ2 is used; a non-significant value indicates that the model fits the data. Because χ2 is affected by sample size, the number of variables, and omitted variables, researchers typically consider other measures of model fit.
On average, 17% of subjects had six DSSI assessments, 15% had five, 11% had four, 14% had three, 18% had two, and 25% had one. The missing data option in AMOS was used. Rather than imputing values for missing data points, AMOS provides full information maximum likelihood (FIML) estimates for the vector of means and the covariance matrix. The FIML approach (Wothke, Reference Wothke, Little, Schnabel and and Baumert2000) requires that data are missing at random or completely at random. Most of the missing data related to patients who had enrolled in the study later and therefore could not have had all follow-up assessments. We examined differences between patients who had different numbers of follow-up assessments on demographic and clinical factors. Using a significance criterion of p < 0.001 due to multiple comparisons, the only significant difference was that patients who had only four waves of data were older (M = 72.22, SD = 6.917) than patients who had all waves of data (M = 66.72, SD = 6.028), p = 0.001. Thus, we feel that it is realistic to assume our data are missing at random.
Results
Unconditional growth models
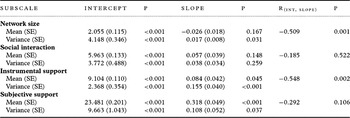
network size
As shown in Table 2, the mean score at baseline was 2.06 (observed range: 0–10). The mean of the slope factor was not significant, indicating that average network size did not change significantly over the course of five years (−0.03 points per year, or −0.15 points over five years). The variances of the intercept and slope factors were significant, indicating significant individual differences in baseline scores and the rate of change over time. The intercept and slope factors were significantly negatively correlated, suggesting that older adults who had larger networks at baseline experienced less decline in network size over the five years.
Unconditional growth models of Duke Social Support Index Subscales

Notes: Network size: χ2(16) = 43.735, p < 0.001, CFI = 0.978, RMSEA = 0.072 (90% CI: 0.047–0.097).
Social interaction: χ2(16) = 17.318, p = 0.37, CFI = 0.996, RMSEA = 0.016 (90% CI: 0.000–0.054).
Instrumental support: χ2(16) = 26.415, p < 0.048, CFI = 0.937, RMSEA = 0.044 (90% CI: 0.004–0.073).
Subjective support: χ2(16) = 53.416, p < 0.001, CFI = 0.943, RMSEA = 0.083 (90% CI: 0.059–0.108).
social interaction
The mean score at baseline was 5.96 (possible range: 0–28; observed range: 0–13). The mean of the slope factor was not significant, indicating that social interaction was stable from baseline through the five-year follow-up (0.06 points per year, or 0.30 points over five years). The variance of the intercept factor was significant, indicating significant individual differences in baseline scores. The variance of the slope factor was not significant, suggesting limited variability in the rate of change. Because there was no variance in the slope factor, the intercept and slope factors were not significantly correlated, indicating that baseline scores were not associated with change over time.
instrumental support
The mean score at baseline was 9.10 (possible range: 0–12; observed range: 2–11). The mean of the slope factor was significant, indicating a significant increase in instrumental support over the five years (0.08 points per year, or 0.40 points over five years). The variances of the intercept and slope factors were also significant, indicating significant individual differences in baseline scores and the rate of change. The intercept and slope factors were significantly negatively correlated, such that older adults with less instrumental support at baseline experienced a greater increase in support over time.
subjective support
The mean score at baseline was 23.48 (possible range: 0–30; observed range: 10–28). The mean of the slope factor was significant, indicating a significant increase in subjective support over five years (0.32 points per year, or 1.6 points over five years). The variances of the intercept and slope factors were also significant, suggesting significant individual differences in baseline scores and the rate of change. The intercept and slope were not significantly correlated, suggesting baseline scores were not associated with the rate of increase.
Conditional Growth Models
We next turned to determining the predictors of initial status and intra-individual change. Baseline depression status, lifetime number of depressive episodes, age, sex, and marital status were entered into the models simultaneously as predictors of the intercept and slope factors. In all cases, model fit decreased significantly, as indicated by the χ2 difference test (p < 0.001). As indicated in Table 3, the fit was still adequate or marginal for network size, social interaction, and subjective support, but was no longer acceptable for instrumental support. Results showed some significant associations between baseline networks and support and demographic and clinical characteristics. Specifically, as age increased, baseline social network size decreased. As baseline depression scores increased, social networks increased significantly and instrumental support increased marginally, while social interaction and subjective support decreased significantly. Also, married adults had more social interaction, instrumental support, and subjective support at baseline. No demographic or clinical variables predicted change over time in any aspect of social relations.
Conditional growth models: demographic and clinical predictors of Duke Social Support Index Subscales

Notes: Std = standardized coefficient.
Network size: χ2(46) = 110.241, p < 0.001, CFI = 0.950, RMSEA = 0.064 (90% CI: 0.049–0.080).
Social interaction: χ2(46) = 95.965, p = < 0.001, CFI = 0.99, RMSEA = 0.057 (90% CI: 0.041–0.073).
Instrumental support: χ2(46) = 104.141, p < 0.001, CFI = 0.755, RMSEA = 0.061 (90% CI: 0.046–0.077).
Subjective support: χ2(46) = 139.625, p < 0.001, CFI = 0.872, RMSEA = 0.078 (90% CI: 0.063–0.093).
Discussion
This study was the first to examine five-year trajectories of social network, social interaction, and social support among depressed older adults to determine how and to what extent social relationships might change over time. Despite various compelling reasons why social networks, interaction, and support might decrease over time, we found that, on average, older adults undergoing treatment for depression reported constancy in the size of their social networks and the frequency of social interaction over five years. Moreover, these individuals reported an increase in subjective and instrumental social support during this period. Of note, this occurred despite the fact that many participants cycled in and out of depression remission.
We also found that social support did not change in the same direction or at the same rate for all individuals. We attempted to identify demographic and clinical variables that explained these differences. The likelihood that we would detect significant associations between social relations and demographic or clinical predictors was low given little variance in the slopes of network size and social interaction. Although there was considerably more variation in the slopes of subjective and instrumental support, the variation was not explained by the demographic and clinical predictors we investigated. Other variables not assessed in this study may prove important, such as health status. We attempted to model depression over the five years, but there was so much intertemporal variation in individual trajectories that neither a linear nor quadratic model could account for the data.
We examined whether baseline demographic and clinical characteristics were associated with baseline social relations subscale scores. The finding that age was negatively associated with baseline social network size is consistent with socioemotional selectivity theory, which posits that individuals seek fewer social partners but more meaningful interactions as they perceive time left in life as limited (Carstensen et al., Reference Carstensen, Isaacowitz and Charles1999). The finding that married people had more social interaction, instrumental support, and subjective support at baseline is unsurprising, as the marital relationship typically is characterized by more closeness than other relationships (Stroebe et al., Reference Stroebe, Stroebe, Abakoumkin and Shut1996). Marital status could have changed over the five years, but this is likely to have occurred among only a few adults and would have affected the results minimally. We also found that adults with greater baseline depression scores had larger social networks and marginally greater instrumental support, but less social interaction and subjective support. This pattern would be expected among individuals who suffer from a debilitating chronic illness like depression and is consistent with other studies examining social support and depression outcomes (George et al., Reference George, Blazer, Hughes and Fowler1989; Bosworth et al., Reference Bosworth, Hays, George and Steffens2002).
Our findings can be compared to those of Krause (Reference Krause1999), who examined the stability of social support in nondepressed older adults. Whereas Krause found that average contact with friends and kin decreased significantly, we found that frequency of social interaction remained stable. However, Krause's findings and our own converge when considering average subjective support (what Krause referred to as emotional support) and instrumental support (referred to as tangible support), which increased significantly over time in both studies. Moreover, like Krause, we found significant individual variation in the rate of change in social support over time. Several differences between our study and Krause's study should be noted. First, our participants were clinically depressed at enrollment, whereas his were not; we had yearly assessments over five years, whereas he had two assessments separated by three years; and different social support measures were used. Nonetheless, an informal comparison of findings from the two studies suggests that older adults with depression, on average, avoid the decline in social contact experienced by their nondepressed counterparts. Future research is needed to perform a direct comparison between depressed and nondepressed older adults’ trajectories of social support.
Our results must be interpreted in light of several limitations. First, older adults’ perceptions of the amount and quality of social support received may not correspond to network members’ estimates of support offered; however, self-reported perceived support has been associated with future depression outcomes (George et al., Reference George, Blazer, Hughes and Fowler1989). Second, although increases in instrumental and subjective support were statistically significant, it is difficult to interpret the practical or clinical importance of the effect size. Third, the DSSI does not assess who provides the support or whom the network comprises, making it impossible to discern which network members may have provided more support. Moreover, the subscales may not cover the entire dimension for each construct. Finally, these findings may not generalize to younger depressed adults. As people age, their needs increase, and the support provided to individuals in our sample may have been related to other health needs, transportation needs, functional disability, or financial needs.
Our procedure for handling missing data introduces some limitations as well. First, it does not distinguish whether data were missing because older adults dropped out/died or because they enrolled in the study later and therefore could not have provided six waves of data. Most of the missing data were due to the latter reason. Because of this, the mean and covariance estimates were more informed by patients who enrolled in the study earlier than later. Patients who enrolled later did not differ from those who enrolled earlier with the exception of patients with four waves of data being older than patients with six waves of data. These results suggest that we did not introduce significant bias into the results by assuming that the trajectories of social support were similar for people who enrolled earlier than later, at least according to the variables available to us.
Several strengths make this a unique contribution to the literature. The data were from an observational study rather than a randomized controlled trial, providing a sample that ranged in illness severity and treatment types. This design also permitted naturalistic observation of depressed older adults receiving medical treatment as they deal with their illness. Additional strengths include the large sample size, number of assessments, and length of follow-up, which allowed us to model initial status and long-term trajectories at the group level and to examine individual differences in these parameters. A final strength is the assessment of social networks and two types of social support, which allowed us to investigate patterns associated with different aspects of social relationships.
Taken at face value, our results might suggest that interventions should focus on increasing social network size and frequency of interaction (Antonucci, Reference Antonucci and Schaie2001). However, multiple studies have indicated that the quality rather than quantity of interaction better predicts health outcomes, so interventions should be directed accordingly. Our results also suggest that some older adults may already receive the maximal amount of support, and therefore increasing support may only work for a portion of individuals.
Conflict of interest
None.
Description of authors’ roles
C. Voils formulated the research question, conducted statistical analyses, interpreted the results, and wrote the paper. J. Allaire helped formulate the research question, supervised statistical analysis and interpretation of the results, and assisted with writing the paper. M. Olsen supervised statistical analysis and interpretation of the results and assisted with writing the paper. R. Hoyle supervised statistical analysis and interpretation of the results and assisted with writing the paper. D. Steffens provided the data and assisted with writing the paper. H. Bosworth supervised formulation of the research question and assisted with writing the paper.
Acknowledgments
This study was supported by NIMH grants P50 MH-60451, R01 MH-54846, and K24 MH-70027 awarded to David Steffens, and Career Development Award MRP 04–216-1 granted to Corrine Voils from the Health Services Research and Development Service of the Department of Veterans Affairs. A portion of these findings was presented in a paper session at the 27th Annual Meeting of the Society of Behavioral Medicine held in March, 2006 in San Francisco, California. The views in this article are those of the authors and do not necessarily represent the views of the Department of Veterans Affairs.