


Japan was the first non-Western society to industrialize from around 1890. Did Japan industrialize following the same path as Western Europe? The Industrial Revolution in Western Europe was preceded by a period of stable high day wages (Clark Reference Clark2008). More speculatively, GDP per capita estimates for Britain show a gradual economic growth since the thirteenth century (Broadberry et al. Reference Broadberry, Campbell, Klein, Overton and van Leeuwen2015). This was possible, despite stable real day wages, due to an increased length of the work year via an industrious revolution (Humphries and Weisdorf Reference Humphries and Weisdorf2019). These factors have often been used to explain the earlier industrialization in Western Europe (Voigtländer and Voth Reference Voigtländer and Voth2006; De Vries Reference De Vries2008; Allen Reference Allen2009). Whether Japan also shared these pre-modern factors remains a matter of speculation due to the lack of similar quantitative evidence.
This paper uses a new source, 1,738 servant contracts, to estimate annual wages, incomes, and the work year in rural Japan, 1610–1890. I document extremely low rural wages that complement and extend past wage evidence from urban Japan, 1348–1593 and 1741–1913 (Bassino and Ma Reference Bassino and Ma2006; Saito and Takashima Reference Saito and Takashima2020). The new rural wage series showed some fluctuations, but it always stayed low, between 2–3 bare-bone baskets. When annual wages are converted to day wages, the wage level was consistently less than half of that in England. It was also generally lower than wages from Italy, India, and China. Together with past urban wage estimates that found similar wage levels, the new evidence puts it beyond doubt that Japan was on a low-wage path preceding industrialization. Altogether, the wages show Japan had a steady long-run low wage equilibrium generally ranging between 2–4 baskets from 1400– 1900. This places Japan at the opposite extreme of England, which had steady high wages generally ranging between 5–7 baskets and suggests a divergence in peasant wages by the medieval period.
This study is the first to show evidence of a long work-year in the critical period preceding industrialization, 1670–1870. Importantly, I use direct observations among servant contracts, unlike the indirect methodology used for England by Clark and Van Der Werf (Reference Clark and Van Der Werf1998) and Humphries and Weisdorf (Reference Humphries and Weisdorf2019). These are the first such estimates for an East Asian context, and they show the Japanese worked 325 days a year by the late seventeenth–nineteenth centuries. The Japanese worked much longer than most people in pre-industrial Europe, with the possible exception of England as it approached 1800 (Humphries and Weisdorf Reference Humphries and Weisdorf2019). An early “industrious” revolution happened in Japan long before that in Western Europe.
An important implication of this paper is that Japan was not a delayed version of the West. Instead, it was on an alternative “labor-intensive path” to industrialization (Hayami Reference Hayami2015), utilizing a cheap workforce over a long work-year, by 1680 if not as early as 1400. This may appear at odds with the earlier literature on Japan’s divergence, but I show it is consistent with the available evidence. The narrative by Hanley (Reference Hanley1997) used qualitative evidence to argue living standards in Japan were similar to those in Western Europe up to 1800, in the same vein as Pomeranz (Reference Pomeranz2009) for the case of China. I show that Japanese rural households were richer than implied by annual wages because they also commonly earned (implicit) land rental incomes due to a more equal distribution of land (Reference KumonKumon 2019). Combined with the longer Japanese work year, the annual income of the median peasant in Japan was much closer to the median peasant in England. However, this does not suggest the lack of divergence because we are comparing wages to wages plus land rent. If we are to compare like with like, we must compare either wages or GDP per capita. A second narrative is based on GDP per capita estimates by Bassino et al. (Reference Bassino, Stephen Broadberry, Gupta and Takashima2019), which argues Japan was also experiencing pre-modern growth. Despite this, Japan slowly diverged due to a slower growth rate. I show that growth was not shared in all sectors and agricultural GDP per capita fluctuated similarly to farm wages. In turn, my farm wage evidence does not reject the narrative of gradual growth, as GDP per capita includes growth in manufacturing and services. However, it adds large constraints. We now know that any such gradual growth must have coincided with the lack of consistent growth in either rural or urban wages. My estimates of the work-year also show growth could not have been driven by a gradually increasing work year after 1680, as has been argued for England (Humphries and Weisdorf Reference Humphries and Weisdorf2019).
These findings have large implications for why industrialization occurs. The Japanese experienced an industrious revolution long before England but did not experience an Industrial Revolution. Although many historians believe the industrious revolution was an important pre-condition for industrialization (De Vries Reference De Vries2008; Humphries and Weisdorf Reference Humphries and Weisdorf2019), it failed to bring industrialization to Japan. On the other hand, labor was extremely cheap in Japan, unlike England, where labor was expensive. Despite a clear wage divergence between these societies, Japan was also the first Asian country to begin industrializing in the 1890s from a low-wage base. An implication is that having very different wage and work structures to Western Europe (Allen Reference Allen2001; Pomeranz Reference Pomeranz2009), while important in itself, fails to explain why some societies industrialized while others did not.
DATA
This paper estimates the male (implicit) wage of peasants in rural Japan, 1610–1890. The main data source are the servant (hōkōnin) contracts from rural Japan, 1610–1890. These servants were laborers on long-term contracts who lived and worked in their employer’s household, much like their counterparts in early modern Europe. In exchange for their labor, servants received payment in kind for subsistence, most notably in the form of food and lodging, in addition to a wage payment. These servants were common and one of the main means of transferring labor across households to address mismatches between land owned or rented and household labor. The number of servants gradually declined as day laborers increased in addition to large landowning households renting out lands that could not be farmed by household labor, instead of hiring servants. The available evidence from some regions suggests servants resided in approximately 30 percent of households in the mid-seventeenth century, with a decline to 10 percent by 1800 (Mori Reference Mori1956; Mizoguchi Reference Mizoguchi1981). By 1919, servants numbered 232,636 compared to 304,015 day laborers, although they were a minority of the 14 million people working in agriculture (Nōshōmu-shō Nōmu-kyoku 1921). Given that servants were not the majority of laborers within the rural economy, how helpful is this source for thinking about the implicit wages (or marginal products) of the majority of peasants who farmed their own plots?
Economic theory suggests two conditions are required for servant wages to reflect the wages of the rural masses. First, the local labor market must be competitive so that servants are paid the value of their marginal product. This could be violated if employers had monopsony power allowing them to pay wages below the marginal product of laborers. However, we know that most employers lacked market power because they only employed a few servants as required by household needs. Moreover, servants could also choose from a wide variety of employers, mostly within a day’s walk from their home village (Mizoguchi Reference Mizoguchi1981; Fukazu Reference Fukazu1991). Markets were not entirely segmented by domain either, as implied by contemporary laws, and some laborers traveled large distances, at times crossing domain boundaries, and such opportunities also improved employee bargaining power (Asano Reference Asano1986; Drixler Reference Drixler2016a). Households faced significant barriers to migration, but individuals commonly slipped in and out of villages (Vaporis Reference Vaporis1995). However, perfect labor market integration, whereby wages are equated across regions, is not a required assumption, and I show later that wages differed across regions. It is only required that local labor markets are competitive. Perhaps one exception to this assumption is the seventeenth century for which we know little about servant distribution, although some village population registers show employment was also not concentrated in this century.Footnote 1 Given a competitive labor market, the wage will be a fair reflection of the marginal product of these servants.
Second, the servant must have similar productivity to the non-servant population. This means servants cannot be selected due to special properties such as low labor productivity, which will bias the wage estimates. This assumption is also likely to hold because servants were normal family members whose labor was temporarily sold to other households. These were often, but not limited to, the younger sons of the household who were expendable upon reaching adulthood because they were not in line to inherit the household lands. Therefore, servants had similar labor productivity to other family members and other rural peasants who never became servants. One potential issue is that a small minority of servants were children, but these few cases are dropped.Footnote 2 If these two assumptions broadly hold, these servants had marginal products representative of other rural peasants, and the wage reflected this value. Therefore, the wages of servants also represent the wages of the many peasants who never entered the labor market at this time. From here on, I assume these assumptions hold when analyzing the results, but if these assumptions are violated, the wages can also be interpreted as lower-bound estimates of rural wages.
Fortunately, many contracts have survived and often contain detailed information on the labor conditions such as the year, length of service, location of employment, servant’s home village, name, and wage. They also occasionally include the age of the servant, the number of days off, and the amount of clothing to be given to the servant. The extremely rich nature of this source allows me to reconstruct not only the wages but also the work year in the period 1610–1870.
The advantage of this source over earlier wage estimates based on day laborers by Saito (Reference Saito1975) and Bassino and Ma (Reference Bassino and Ma2006) are summarized in Table 1. First, the use of urban day wages for Asian societies has been criticized because urban day laborers were not as common in Asia relative to Western European societies (Deng and O’Brien Reference Deng and O’Brien2016; Parthasarathi Reference Parthasarathi2011). Estimates from the Kai region in central Japan in 1789 suggest they represented perhaps 4 percent of the population (Bassino, Ma, and Saito Reference Bassino, Ma and Saito2005). Thus, it is unclear whether the rural masses had similar wage levels. Second, there are ambiguities related to whether unrecorded in-kind payments were supplied to laborers. In particular, food during work hours is known to have been supplied in some cases. Third, the effect of seasonality has made it unclear whether these wages were typical. Fourth, the past series have been single series from a single employer, so we are unsure of their precision. Fifth, the number of work-days is unknown, so the literature has relied on arbitrary assumptions of workdays to estimate living standards. Each of these issues can prove critical and could sufficiently muddy the waters surrounding the interpretation of their findings.
COMPARISON OF THIS PAPER TO OTHER WAGE STUDIES

Source: See the text.
The wage data from annual servant contracts are highly robust to the issues previously mentioned. First, servants were common within villages across Japan, making their wages representative of the marginal product of the peasant masses. Second, the subsistence of the servant was always the responsibility of the employer and can be accounted for. Third, there is no seasonality effect because these are annual wages. Fourth, the large sample allows me to construct confidence intervals, so the precision of the estimates is well known. Fifth, these are annual wages, so there is no need to assume the number of days of work. Of course, this, in turn, means I cannot directly observe day wages, but I can estimate them once I know the length of the work year. Further, I can also estimate the work year, allowing me to also construct day wages. Therefore, these estimates will more precisely capture the annual wage incomes of the rural masses.
However, servant wages are not without their problems. First, the wage was mostly paid in advance, as is stated in many contracts. The advance pay was risky for employers and therefore servants had to specify guarantors liable to return the money should the servant run away. The advance pay was unlike the case of English servants who received their wages during or after employment. One reason for the advance pay in Japan was the asymmetries in the law that failed to protect employees if they were not paid (Ramseyer Reference Ramseyer1995). Receiving the wage in advance was a solution to this asymmetry. Another reason was the urgent need for money. Some contracts state that the household head needed money to pay the annual harvest tax, and therefore, sent out a household member to work as a servant.Footnote 3 As the wages were paid lump sum in advance, the laborers are paid less than had they received wages in each month. I account for the advancement of wages because I am measuring the annual value of farm labor without such deductions.
Second, the contracts are generally silent about the type of work, and it is unclear whether these laborers were unskilled. However, this is implied from the rural setting of these contracts. Employers required assistance in their livelihoods that were mostly agricultural work or housework, which required minimal skills. I intentionally avoid urban areas where servants were effectively apprentices who accepted lower wages in return for human capital. Therefore, the wage estimates can be interpreted as the rural unskilled wage.
Third, the contracts vary on details on in-kind payments for the servants themselves. The in-kind payment was a big benefit of servant-hood. In some cases, children would become servants for free in order to benefit from the need to feed one less mouth. However, only a minority of contracts include details of the in-kind payment related to clothing. Most households probably followed an unwritten rule. Rather than attempt an arbitrary adjustment by time or region, I follow Humphries and Weisdorf (Reference Humphries and Weisdorf2019) in assuming workers received one basket for the servant in addition to a wage. This is practical since the minimal needs of the servants were meant to be supplied by the employer.Footnote 4 While it is likely that in-kind payments varied over time resulting in small distortions, the variations likely followed wage fluctuations meaning my estimates will still accurately represent the trends.
In addition to direct wage payments, I also use payments from two other types of contracts. First were permanent sales of labor, or hereditary servants (often known as fudai genin), which occurred in the seventeenth century but eventually disappeared due to a ban by the lords. Some of the hereditary servants were seized and inherited from war (Nelson Reference Nelson2004), while others entered a state of hereditary servanthood when they failed to return loans secured with labor as collateral. Hereditary servants were valued by the discounted value of their work. Due to the ability of hereditary servants to run away, such assets were also discounted heavily for this risk. Second were loans where labor was taken as collateral. These contracts were common up to the early eighteenth century but then decreased in importance. In this case, the laborer was returned once the loan was returned. The loan often required zero interest because the wage of the laborer was implicitly equated to the interest payments. Both sources provide valuable information in the seventeenth century, when wage contracts were less common. I can control for these differing types of contracts via control variables, and much of the results hold when I drop these types of contracts in a robustness test.
I have collected a sample of 1,738 observations of rural male servant wages, which will be referred to as the servant wage dataset and available on Kumon (Reference Kumon2021). A portion of these were digitized from original servant contracts that were collected at various archives (see Online Appendix G). Many of these have survived because employers happened to accumulate large collections of paperwork, which were eventually passed onto archives. In some cases, this allows me to observe the variation in wages paid by the same family over centuries. I supplement these wage contracts with data from papers and books that have made information from servant contracts available for use.
The data is richest from 1750–1869, where there are more than 50 observations per decade (see Figure 1). The seventeenth century has poor coverage due to lower source survival. The observations are also low from the 1880s onward, so I supplement my data set with official wage statistics from the Imperial Statistics of Japan, which list the average wage for servants from 1884–1932. Geographically, 35 percent of observations are from the Kantō region surrounding Tokyo. Another quarter is from Harima province (present-day Hyōgo prefecture), where an extremely large collection was made available by Uemura (Reference Uemura1976). The remaining observations span much of Japan but with more limited observations.Footnote 5 The type of contract transitions over time toward wage contracts, as documented in the wider literature (Ramseyer Reference Ramseyer1995). I relied heavily on loan or sales contracts in the seventeenth century as they were the typical means of employing servants at the time.
THE NUMBER AND TYPE OF OBSERVATIONS PER DECADE
Notes: Bars represent numbers of observations (left axis) and lines indicate contract type (right axis).
Source: Servant wage dataset.

Price Baskets
I construct a basket of subsistence goods to make the wages comparable across societies and time. This follows the “welfare ratios” approach pioneered by Allen (Reference Allen2001), whereby the basket is allowed to vary by society while fulfilling certain criteria such as calorie content. For example, food in the bare-bones basket must have 2,100 kcals of energy content per person per day.Footnote 6 Using this approach, I express wages as the number of purchasable subsistence baskets for one person-year. This approach has a number of weaknesses. First, the baskets of the different societies are not identical due to differing availability and consumption of food products during the pre-industrial era when global trade was limited. Second is the arbitrary nature of the basket. A large set of potential baskets exists, given the lack of comprehensive consumption surveys that may point us toward one representative basket. One partial solution is to make multiple baskets of goods that can capture extremes and show whether the results are robust to basket manipulation.
I follow Bassino and Ma (Reference Bassino and Ma2006) in an earlier study on Japan by constructing both a respectability basket and a bare-bones basket using the prices for each good, when available, in each year (see Table 2). They capture the two extremes, whereby the respectability basket is for the well-off peasant and the bare-bones basket is for a frugal peasant struggling at low income. The main difference between the baskets is the type of grain consumed, fish, and sake consumption. Rice was considered a superior good at the time and is 36 percent of expenditure for the respectability basket whereas it is 14 percent in the bare-bones basket. Interestingly, even if we believe peasants did not eat rice, the price of barley and wheat was 70–80 percent of rice, while buckwheat may have been slightly cheaper at 50–60 percent of the price so that living expenses only decreased by 16 percent. Due to the arbitrary nature of the basket, one could argue that peasants exclusively ate the cheapest grains, such as millet or buckwheat. However, available agricultural statistics suggest otherwise. In the case of Japan in 1877, rice was 57.6 percent of all grain produced by volume, whereas wheat and barley was 31.6 percent and only 10.8 percent were other grains, such as buckwheat and millet (Oki and Goto Reference Oki and Goto2013). The poorest peasants would obviously eat the cheapest grains, which lacked market value. However, they also had little price incentive to produce large volumes of such cheap grains. Therefore, I do not include excessive amounts of the cheapest grains in the bare-bones basket to make it plausible.
THE CONSUMPTION BASKET PER PERSON PER YEAR, 1750–1759

Notes: Most of the above follows (Bassino and Ma Reference Bassino and Ma2006). I assume 180 litres/koku, 150 kg/koku for rice, and 129 kg/koku for soybeans. I assume prices relative to rice as follows: beans 0.63, buckwheat and other grain 0.6, and 1.46 for fish. A full rice wage basket costs 60.62 monme for this decade.
Source: The price dataset.
I use a similar basket to Bassino and Ma (Reference Bassino and Ma2006) but update it in a number of ways. First, I add observed prices for barley, soybeans, edible oil, and linen to varying degrees for the period 1720–1880 from various sources detailed in Online Appendix A. Unfortunately, the price of three goods remain unavailable (beans, fish, sake, and buckwheat) before 1880, so I follow the pre-industrial wage literature by fixing prices relative to rice prices using shares from the Meiji period. All prices except rice are missing before 1720, so I also approximate the prices of these goods by fixing the prices of these goods relative to rice using relative prices from 1720–1853. Some caution is required for interpretation, but I can get a sense of the validity of this assumption by looking at the prices of goods relative to rice (see Figure 2). It is reassuring that there is no clear trend in relative prices before the opening of Japan to trade in the 1850s, after which price structures radically changed. More detail on the sources is available in Online Appendix A. From here on, I refer to this price data as the price dataset.
PRICE OF INDIVIDUAL GOODS RELATIVE TO RICE BY DECADE
Source: The price dataset (see Online Appendix A).

Second, I make one small adjustment to the basket by changing annual linen consumption per person to 2 tan, which amounts to 2 pieces of clothing. This is comparable to the cloth consumption in European baskets of 5 meters of linen that also amounts to 2 pieces of clothing.Footnote 7 It is also consistent with the standard practice of clothing consumption among servants at this time. Many servant contracts stated two pieces of clothing, one for summer and the other for winter, would be provided per year. This level of clothing consumption is therefore also a realistic addition to the basket.
One final issue is the location and currency of the prices. Ideally, I would have prices for all goods in each region, but prices are only available in Osaka, so I use Osaka silver prices.Footnote 8 This is a shortcoming shared within the literature as rural prices series are rare. For the purposes of interpretation, I assume rice markets were well integrated, as shown by other studies (Bassino Reference Bassino2007; Dobado-González, García-Hiernaux, and Guerrero Reference Dobado-González, García-Hiernaux and Guerrero2015), which implies locational choice is not a major factor. Indeed, rice prices in 15 cities across Japan for the period 1875–1884, when railways were still extremely limited, had a coefficient of variation averaging 0.11, which is extremely low. Moreover, available rice price series for the preceding period, including domain government prices and rural market prices, were at very similar levels throughout (see Online Appendix A). A related concern may be that farmers valued wages at farm-gate prices rather than retail prices. To address this concern, I also suggest a farm-gate price adjustment to the bare-bones basket when presenting the results.
METHODOLOGY
I use a regression approach to construct a wage estimate following Clark (Reference Clark2005). An advantage of this method is that I also estimate a confidence interval for the average wage. The specification is
 $$Total\,Wag{e_{i,t}} = \exp ({\beta _0} + \sum\nolimits_{d = 1}^D {{\beta _d}half\,decad{e_d} + {\beta _2}loa{n_i} + {\beta _3}{Z_{i,t}}} ) + {e_{i,t}}.$$
I use a Poisson regression, which allows for a more robust prediction of wages relative to taking logs of the dependent variable (Silva and Tenreyo 2006). Most importantly, this specification avoids bias due to Jensen’s inequality.Footnote 9 The dependent variable is the total wage received for the entire period of service. The variable of interest is β d , which estimates the average wage by time period. Estimates are generally made by half-decade during normal years where nominal wages fluctuated little. The exceptions are during years of currency devaluations and the Meiji restoration, which led to large fluctuations. For these periods, I deviate from half-decade intervals. In periods with a low sample size preceding 1750 and 1870, I also use time-period dummies that span longer periods. I create a dummy for loan and hereditary servant type contracts, which will automatically account for the implied interest rate of the loan.Footnote 10 Z i,t controls for region separately before/after 1750 and the duration of contract using dummy variables.Footnote 11 I use the regression to predict the nominal wage in each decade for a one-year wage contract with region dummies weighted by population.
I use the nominal wage instead of the real wage as my dependent variable because the nominal wage was far more stable during half-decade intervals. This means the nominal wage in any year should be representative of any year within the half-decade interval. I can see this by looking at the nominal wage of servants employed by one household (the Kondō household in Harima province) over 80 years, for whom I have a large sample (see Figure 3). The sample size remains very small at the annual level resulting in some fluctuations, but the average nominal wage changed slowly and steadily. The nominal wage was also rigid during famine years, shaded in gray, whereas real wages clearly fell. This was perhaps due to the establishment of local norms and nominal wage rigidity (Kaur Reference Kaur2019). Statistically, this will mean the nominal wage has less variance, so it can also be estimated with greater precision.
WAGES OF SERVANTS EMPLOYED IN A VILLAGE NEAR HIMEJI
Notes: The shaded areas are periods of famine. The smoothed line is generated using a local polynomial estimation of degree 3. The data is from Harima province, Tarōdayū village.
Source: Uemura (Reference Uemura1976).

A further advantage of this approach is that once nominal wages are estimated, I can back out real wages in each year by using the annual basket price. When doing this, I must also correct the nominal wage to account for the implicit interest rate paid for the wage being an advance. As I lack the data for whether this is true in all cases, I assume this is true. This may lead to a slight upward bias in my estimates. I correct for the advance using the following formula to back out the true wage rate.
 $$W = \sum\limits_{t = 1}^T {{1 \over {{{(1 + r)}^t}}}w} $$
Here, W is the annual wage, r is the monthly interest rate, and w is the monthly wage. Using this, the monthly wage rate is as follows.
 $$w = {{W(1 - \beta )} \over {\beta (1 - {\beta ^T})}}$$
Here, β is the discount rate. The annual wage would be the wage received for one year of work. This would be 354 days or 384 days in leap years with the old Japanese calendar, which was based on the lunisolar calendar, but I standardize this to the 365 day year for comparability purposes. The typical annual interest rate for one-year loans that appear in contracts was 20 percent, with part of it accounting for a risk premium. Similar numbers also emerge from other tests using available data (see Online Appendix C). I, therefore, use this 20 percent rate to calculate the comparable nominal day wage. The deduction could be sizeable as people working one-year contracts would receive 91 percent of what they would receive had they been paid each day.
RESULTS
Figure 4 plots the main wage series as the number of bare-bones baskets purchasable with the annual wage earned by servants from 1600–1870.Footnote 12 The new wage estimates are consistent with the pessimistic outlook of Japan in poverty. The wages were generally low and fluctuated between 2–3 bare-bones baskets. A male landless laborer would not have been able to feed a family of four at the best of times. As these wages are at the annual level, there is no room for more days of work or after-hour work to be concealing higher wage incomes, as argued by Bassino, Ma, and Saito (Reference Bassino, Ma and Saito2005). Moreover, the bare-bones basket is a basket designed for the poor. If a respectability basket of goods is used, the implied wage level is mostly below two baskets suggesting even greater poverty (see Online Appendix D). Wages were consistently low in Japan back to 1600.
MALE ANNUAL FARM WAGES
Notes: The annual wage is plotted with a 11-year moving average. The regional dummies are weighted by population in 1798. Shaded areas indicate major episodes of famine or warfare.
Sources: Servant wage dataset and price dataset.

The longer time frame of this study reveals important Malthusian wage fluctuations that were missed in past studies. Population increased rapidly after 1600 due to a civil war lasting over one and a half centuries coming to an end (see the right axis of Figure 4). Due to the lack of population surveys for 1600, estimates for the population at this time vary between 12 to 22 million, but I use the 17 million figure following Bassino et al. (Reference Bassino, Stephen Broadberry, Gupta and Takashima2019) and Nakabayashi et al. (Reference Nakabayashi, Fukao, Takashima and Nakamura2020). The next observations are from 1721, where the best estimates derived from the population census suggest a vast increase to 31 million (Kitō Reference Kitō1996; Farris Reference Farris1995). The simultaneous decline in wages is consistent with the Malthusian narrative. The fact that wages largely stabilized by the 1660s suggest the population had largely stabilized by then, at which point families could sustain less than two people.Footnote 13 Families would not have been sustainable on male wages alone. Narratives of the period suggest a period of poverty and attempt to control the population through bans on marriages, partible inheritance, or infanticide (Drixler Reference Drixler2013). This is consistent with both the wage evidence and a Malthusian concept of equilibrium. The low equilibrium wage level itself is interesting. Such low wages can be observed over the short run in other societies as a result of crises, but this was a long-run equilibrium lasting a century in a peaceful society. I will later show that during this period, the estimates place Japan as the society with the lowest observed wages in non-shock years in history.
The low wages persisted to the 1730s, after which wages began a steep climb over the next 80 years. Over three generations, wages almost doubled, allowing male wages to feed just over 1 more person, which fits with other findings in the earlier literature (Saito Reference Saito1975). This evidence is consistent with the hypothesis by Smith (Reference Smith1988) that Japan experienced pre-modern rural-centered growth from the eighteenth century. If this was a Malthusian society, why did wages subsequently increase?
These findings remain consistent with the Malthusian view if there was both a shift toward lower birth rates and technological growth resulting in a shift in the Malthusian equilibrium. This kind of shift has also been argued for Europe and referred to as the European marriage pattern (Voigtländer and Voth Reference Voigtländer and Voth2013).
Fertility patterns in Japan changed, partially due to infanticide and abortions in combination with other factors, which kept the population stable up to 1800. Infanticide had begun in many but not all regions by the 1660s partially as a response to labor abundance, but it became a major concern by the mid-eighteenth century as wages began to increase. One estimate from Eastern Japan suggests up to 40 percent of infants were missing due to infanticide or abortion (Drixler Reference Drixler2013). This culture persisted up to the early twentieth century (Drixler Reference Drixler2016b). This can be considered a decrease in birth rates (or an increase in death rates), resulting in a slow shift toward higher wages. Population did eventually begin to increase in the nineteenth century, partially due to declining infanticide rates, and this may explain the modest decline in wages toward the mid-nineteenth century.
Simultaneously, there was increasing agricultural production due to increased acreage and increased productivity. Agricultural acreage increased due to land improvement projects that became feasible under a peaceful and stable society (Yamasaki Reference Yamasaki2018). Land acreage increased by 20 percent between 1721–1804 and a further 16 percent by 1872 (Bassino et al. Reference Bassino, Stephen Broadberry, Gupta and Takashima2019). The productivity on these lands also improved due to new agricultural implements. For example, new tools such as the ganzume for weeding, the bitchū hoe, and senbakoki for threshing are known to have been invented during the mid-late Edo period (Verschuer Reference Verschuer and Cobcroft2016). Fertilizer also changed. Originally, farmers used local green manure collected from the commons made of vegetation, human/livestock excrement, and ash. This gradually changed to dried fish-type fertilizers purchased from merchants partially due to the introduction of cash crops and intensified uses of land. My wage estimates suggest a large share of the productivity increase occurred between 1740–1820. The increased agricultural production was not eaten away by the increased population, partially due to increased infanticide, which allowed wages to increase.
These general trends were punctuated by various shocks that put dents in the wage level largely due to variation in prices. This was partly due to famines, the greatest of which occurred in the 1640s, 1730s, 1780s, and 1830s. Such times resulted in a significant temporary decline in wages and starvation among the poorest. As food markets tended to fail at such times due to interventions by the lords, these real wages significantly overestimate purchasing power in the worst affected regions. The other major events were wars, such as those that marked the end of the Tokugawa period. This instability led to a decline in real wages that was comparable to a great famine before recovery from the 1870s. Even at the best of times, peasants never managed to escape the risk of starvation.
One concern with this narrative is potential measurement error in the estimates. To partially address this, I plot the 95 percent confidence interval of the time period dummies and divide this by average prices in Figure 5. The confidence intervals of the main estimate are mostly small, and taking any values within this range leaves most of my conclusions unchanged. I additionally show that taking simple averages of one-year wage contracts also show similar results in Online Appendix D. Wages were most certainly close to two bare-bones baskets by the late seventeenth century and remained there for a century before seeing an increase up to the early nineteenth century. One remaining concern is whether wages really declined in the early seventeenth century. However, two sources of secondary evidence corroborate this view. First, unskilled day wages from the sixteenth century suggest high wages (Saito and Takashima Reference Saito and Takashima2020). Second, hereditary servants were common in the sixteenth–mid-seventeenth centuries but slowly disappeared (Smith Reference Smith1959; Nelson Reference Nelson2004). This is consistent with a decline in marginal products that would make the cost of having the servant raise a family, which occasionally happened, prohibitively high and reduce the reproduction of the next generation of hereditary servants.
ALTERNATIVE SPECIFICATIONS RELATIVE TO MAIN ESTIMATE
Notes: The main estimates are in thick lines and alternative estimates in thin lines. For the main estimate, 95 percent confidence intervals are plotted.
Sources: Servant wage dataset and price dataset.

A second concern is that farmers would have valued foods at farm-gate prices that were cheaper, and the use of retail prices will significantly undervalue wages. Available statistics from the early twentieth century suggest markups may have been one-third of farm-gate prices.Footnote 14 If I use this to discount foods other than fish and oils, which are unlikely to have been produced by most households, I find a 20 percent decrease in the price of the bare-bones basket. This would mean a real wage of 3 baskets becomes 3.5 baskets. While significant, this is still a very low wage that is barely sufficient to sustain a family.
I also address concerns for the specification by conducting other plausible estimates of wages and plot them against my main results seen by the thinner lines (see Figure 5). The four concerns I address are as follows. First, use of the region-time dummy that splits the period pre/post 1750. This coincides with the timing of increasing wages. I, therefore, place alternative splits at 1740, 1760, and 1770. Second, a small minority of servant contracts specified periods that were not round years, so wage seasonality could bias my results. I, therefore, estimate wages using only those contracts specifying round years. Third, longer-term contracts were rare during the later periods and were often given to children who may not always be identified. To account for this, I drop contracts that are longer than 3 years. Fourth, a concern is that the dummy variable for loan or sales contracts may not be able to fully control for differences with wage contracts. Therefore, I additionally drop all loans or sales contracts. In almost all cases, the alternative estimates are similar and fall within the 95 percent confidence interval of my main estimate. The estimates are unlikely to be the product of measurement error.
How do these estimates fit into the broader picture? I augment my findings using two sources. First are the unskilled urban day wage estimates from medieval Japan by Saito and Takashima (Reference Saito and Takashima2020), where I only use the period 1400–1550, for which the underlying evidence is strongest. Although these are urban wages, they are largely comparable to farm wages in the seventeenth–nineteenth centuries and remain good indicators for general wage levels (see Online Appendix D). To convert day wages into annual wages, I assume medieval laborers worked 325 days a year, which was the standard in 1800 when wages were also low. Second, I use monthly or annual servant wages listed in the annual statistics of the Japanese empire (nihon teikoku tōkei nenkan) from 1881–1932.
I plot the long-run wage series from 1400–1932 in Figure 6. Wages from the three different sources are plotted independently, and it is reassuring that my estimates coincide with the official statistics from the 1880s. These estimates show that the low-wage economy can be traced back to the medieval period. Low wages were not unique to the Tokugawa regime, 1600–1868, but were clearly a longer-run phenomenon. Wages did see some fluctuation with relatively high wages during the long civil war between the mid-fifteenth century to 1600. This was likely caused by Malthusian forces as the war put downward pressure on the population as armies roamed the lands and spread disease and destruction. The wage being above 3 subsistence baskets in the 1550s is reassuring as it is similar in level to the relatively high wages I estimate for 1610. It was only after the Industrial Revolution that wages consistently remained above 4 baskets of goods and rural Japan escaped the low-wage trap it had been stuck in for at least half a millennium.
ANNUAL WAGES OVER THE VERY LONG RUN
Sources: Servant wage dataset, price dataset, and Saito and Takashima (Reference Saito and Takashima2020).

Regional Variations
It is also possible to measure region-specific wages in the case of the Kantō region around Edo (or current day Tokyo), and the provinces around Osaka, which I term the Greater Kinai region, for which the sample size is sufficiently large.Footnote 15 The wages of these regions are of interest because they contained the three biggest cities of the time, Edo, Osaka, and Kyoto. They were also regions with high population densities and were the hubs of the East and West of Japan. How different were region-specific wages to the national level wage estimates?
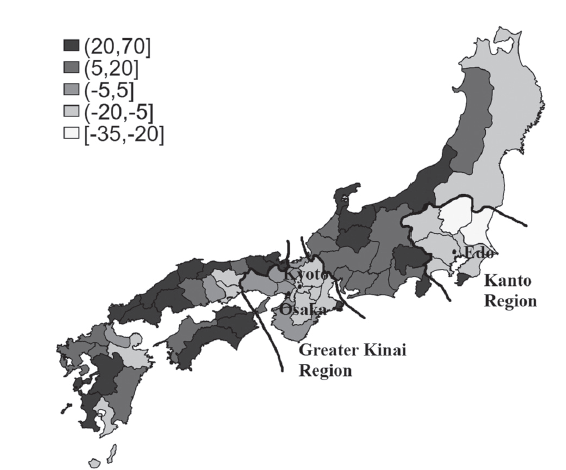
Due to the more limited sample size, I estimate the results from the 1720s onward by decade and plot the results in Figure 7. The estimates reveal an interesting divergence that occurred from the 1790s whereby the Kantō region began to have much higher wages than the Greater Kinai region. The Kantō region farm wage could afford just over 1 more basket at its peak. This is also consistent with the regional dummy variables, which indicated the Kantō region had significantly higher nominal wages relative to other regions. This is not due to estimation error as the 95 percent confidence intervals do not overlap, and simple averages of one-year wage contracts also show the same result (see Online Appendix D). This is also not due to price differences by region as Edo rice prices were only between 2–6 percent higher on average.Footnote 16 One potential explanation is differences in in-kind payment via clothing by region for the particular households in the dataset, but this could only explain less than 0.2 bare-bone basket worth of the difference. It is also difficult to imagine this was driven by skill differences because historical accounts have often considered (with little direct evidence) the Kinai proper to have been the most advanced (Saito Reference Saito1978). What explains these differences?
FARM WAGES BY REGION
Note: The shaded region indicates decades with major famines.
Sources: Servant wage dataset and price dataset.

One explanation for this is the great decline in population that occurred within the Kantō region between 1721–1828. Over these hundred years, the population declined in the Kantō region by 15 percent, while the Greater Kinai region saw only a modest decline of 5 percent. The lower population led to labor scarcity and, therefore, higher wages. This can be attributed to at least three factors. First, higher levels of infanticide down the Pacific Coast of Eastern Japan led to a lower population, as shown by Drixler (Reference Drixler2013). It could be the case that infanticide was more intense in this region. Second, the urban graveyard effect meant big cities had negative population growth and hence tended to absorb population from their periphery. Edo was the biggest city at the time, with 1.2 million people, while Osaka and Kyoto combined had less than 0.8 million people. Therefore, the effect was likely larger in the region around Edo. Third, there must have been limitations to long-distance migration as a means for wage convergence. Households found it very difficult to migrate at this time due to laws at the time limiting migration to individuals. Moreover, villages valued trust because villagers were held jointly responsible for paying taxes. Strangers could not hope to settle without the use of networks. Such migration frictions likely increased with distance. This problem was compounded with lower population growth in the periphery of the Kantō region, where the northeast also had depopulation. Therefore, migration mostly occurred from population-dense provinces to the north and west. I observe such cases from the neighboring provinces of Echigo to the north or Shinano to the west within the dataset. Despite the existence of such migrants, they were insufficient to restock local populations. The regional wages also show Malthusian forces were at work within Japan.
The Length of the Work Year
Annual wages of servants were low but could this be due to a short work year? A long literature has attempted to answer this question for European countries, but the evidence has remained limited for pre-industrial East Asia (Clark and Van Der Werf Reference Clark and Van Der Werf1998; Voth Reference Voth2001; Humphries and Weisdorf Reference Humphries and Weisdorf2019). I can investigate this using a small subset of these wage contracts (83 observations), which include stipulations on the number of days of rest with which I can estimate the length of the work year. Most of these contracts would state the number of days of rest per month, resulting in large clusters of observations between 2–4 days of rest per month. Unfortunately, it is unclear if servants additionally rested during major festivals, and these are not added in my estimates. If they additionally got these holidays, they would have perhaps rested for an additional 3 days for a new year, 3 days to honor the spirit of their ancestors during the bon holidays, and 5 days for the gosekku, coming to a total of 11 additional days.
As a robustness exercise, I also estimate the work year using the method pioneered by Clark and Van Der Werf (Reference Clark and Van Der Werf1998). They divide the annual wage by the day wage to get an estimate of the work year.
 $$Work\, Year\, = \, {{Annual\, Wage} \over {Day\, Wage\, - \, Risk\, Premium}}$$
The day wage is often considered to include a risk premium, as such laborers were not guaranteed jobs on any given day. As we do not observe this risk premium component, the standard approach is to assume it is very small or to focus on the trends rather than levels. I can partially resolve this issue in the case of Japan by using the implied day wage from Hiwari servants who were part-time servants. Such contracts often specified 15 days a month of work with the remaining days worked at home. These workers would face significantly less risk due to the longer span of the contract. Due to such factors, the wage premium was likely very small. Additionally, there will not be seasonality issues due to their working every month of the year. To avoid issues of regional/employer bias, I use observations from the same employer in two villages located in Harima province in western Japan, 1780–1820, and Kai province in central Japan, 1800–1840, to get one estimate of the working year in each. I also estimate the work year in the Kantō region as a whole for the periods 1780–1820 and 1820–1840. Additionally, I plot other estimates of the work year based on village surveys, as compiled by Furukawa (Reference Furukawa1986), Abe (Reference Abe1998), and Saito (Reference Saito1998) that test for robustness.
The results unambiguously show these farm workers were highly industrious, with the longest known average work year recorded in pre-industrial history (see Figure 9). They worked for 310–330 days a year, with an average of 325 days, which is significantly more than the standard in modern society, where people commonly work less than 250 days. This is longer than in eighteenth-century England, according to Clark and Van Der Werf (Reference Clark and Van Der Werf1998), who estimate 280–300 days of work, or the 250–280 days seen between the sixteenth–seventeenth centuries. However, there is some debate on the work year in England, with the highest estimates suggesting 350 days of work in the 1840s (Voth Reference Voth2001; Humphries and Weisdorf Reference Humphries and Weisdorf2019). The high labor hours itself also likely contributed to lower day wage rates as it shifted the labor supply curve to the right. Japanese servants were paid low annual wages despite a long work year.
ESTIMATES OF THE WORK YEAR IN JAPAN
Notes: I take the average of the work year from observations in each decade. Observations from contracts and the annual wage/day wage method almost overlap in the 1820s and 1830s so they are difficult to see.
Sources: Servant wage dataset, Furukawa (Reference Furukawa1986), Clark and Van Der Werf (Reference Clark and Van Der Werf1998), Abe (Reference Abe1998), and Saito (Reference Saito1998).

This seems unlikely to be due to measurement error of servant work years as alternative estimates based on dividing the annual wage by day wages suggest similarly long work years (shown as other Japanese estimates in Figure 9). It is also not due to servants having exceptionally long work years. Other surveys of the work year in these villages also suggest an average of 322 days of work per year. However, there was certainly some regional variation, and the estimates suggest Eastern Japan had a shorter work year than Western Japan by perhaps 10 days. This is consistent with higher wages in the region surrounding Edo, which may have allowed laborers to work less.
It is interesting that the Japanese saw an increase in individual labor supply at an early stage in history without seeing an Industrial Revolution until much later. Unfortunately, the finding does not show the origins of the long work year, which can help us understand why the Japanese worked for so long. However, one hypothesis is that the hard-working ethics of the Japanese was the result of desperation and poverty rather than demand for new goods, as hypothesized by De Vries (Reference De Vries2008). Hayami (Reference Hayami2015) was an early proponent of this view, arguing the population explosion in the seventeenth century led to the development of new labor-intensive agriculture that saves on capital and intensifies on labor, which Hayami originally coined as an “industrious revolution” before the work by Jan De Vries. This contrasts with an Industrial Revolution where labor-saving technologies dominate. Hayami cites the example of the decreasing use of oxen and horses in one region of central Japan as they were substituted with manpower, although this substitution between livestock and manpower does not hold everywhere (Saito Reference Saito2004).
On the other hand, these findings can partially explain why the Japanese were getting paid so little per day of work. The long work year must have increased labor supply and therefore decreased the price of labor. Japan was on a labor-intensive path of development where labor was abundant and cheap due to both high population pressures and long work hours.
RECONCILING THE MANY DIVERGENCES
How do these new findings fit into the ongoing debate of the divergence between Japan and Europe? There are currently at least three distinct views. First, Hanley (Reference Hanley1997) uses qualitative evidence on living standards to suggest living standards were similar between Japan and Northwest Europe. This view places a divergence during the Industrial Revolution in Northwest Europe. Second, the GDP per capita estimates by Bassino et al. (Reference Bassino, Stephen Broadberry, Gupta and Takashima2019) show a slow divergence between Japan and England due to slower growth in Japan. Importantly, both societies were similar in experiencing pre-modern growth. Third, urban wage estimates suggest a steady divergence since the medieval period (Bassino and Ma Reference Bassino and Ma2006; Saito and Takashima Reference Saito and Takashima2020), although the evidence can also be consistent with the second hypothesis.
I first look at how the Japanese wages compare with other contemporary societies. I compare Japanese wages with those from Beijing, Bengal, England, and Milan from other papers (Allen Reference Allen2001; Clark Reference Clark2007; Allen et al. Reference Allen, Bassino, Ma, Moll-Murata and Luiten van Zanden2011; De Zwart and Lucassen Reference De Zwart and Lucassen2020). These countries were chosen as they represent distinct regions and the data was available. The wages from England are farm wages making them more comparable with the Japanese farm wages. The wages from Bengal, Beijing, and Milan are city wages, which may result in a slight over-estimate due to higher rents in cities, although there is no sign of this in the case of Bengal. I will compare day wages as the work year clearly differed across countries. In order to make Japanese annual wages into day wages, I assume 325 days of work.
To make the wages comparable, I use a bare-bone basket that may be more representative for the poor masses. Unfortunately, the literature has large variations in baskets, making them incomparable. I, therefore, update these baskets so that they fulfill a number of common conditions while hewing as closely as possible to the original baskets in the respective papers. The food must contain 2,100 kcals, at least 50 g of proteins, and 5 kgs of meat or fish. The main consumed grain must be a cheap secondary grain, but the 300 kcals worth of the primary grain is also consumed. In the case of England, the secondary grain would be oatmeal, while the primary grain is bread. This prevents the basket from becoming an unrealistically strict diet. Other than the food, the basket contains 2.6 kg of candles/lamp oil, 5 m of linen, and a 5 percent cost increase to account for rent. The details of each basket are given in Online Appendix E.
I plot the resulting long-run day wage series using 20-year averages in Figure 10. The new series is consistent with the earlier wage evidence suggesting a very early divergence. Japan and England represent the opposite ends of the wage distribution. The English were consistently richer since the medieval period, earning 5 baskets before the black death and a subsequent new equilibrium at 7 baskets. Therefore, English peasants were always earning more than double the Japanese wage. The day wages show a very early divergence between these two countries. Although not compared here due to the use of a different basket, rural French wages from a recent paper by Ridolfi (Reference Ridolfi2019) were close to English wages and must have also been significantly higher than Japanese wages. Despite such extreme differences, it is interesting that both England and Japan industrialized at a relatively early stage. Japan began industrializing by 1900, only a 100-year lag and 40 or so years after opening trade to the world. This shows wages alone do not play a decisive role in industrialization.
INTERNATIONAL COMPARISONS OF WAGE
Notes: All units are in number of one person’s worth of basket purchasable. I use the bare-bones basket for Japan to make it comparable to the estimates for China.
Sources: GPIH website wages as originally used by originally used by Clark (Reference Clark2007), Allen et al. (Reference Allen, Bassino, Ma, Moll-Murata and Luiten van Zanden2011), and de Zwart and Lucassen (2020).

Next, I turn to Milan, which is often considered as a central region of the little divergence. The wages here were comparable to English wages in the seventeenth century before beginning a decline in the eighteenth century, as argued by Malanima (Reference Malanima2013). Wages were as low as two baskets in some periods, such as 1793–1818 and 1847–1860. However, this was driven by political events such as the Napoleonic wars and the wars for independence. During the peaceful periods, households could afford 4 bare-bone baskets suggesting a higher equilibrium wage. Furthermore, the silver wages of a comparable laborer in nearby Florence were more than double in 1860, which brings some doubt to Milan being representative of Northern Italian wages. Overall, wages in Milan were slightly higher than in Japan during years of stability.
Beijing and Bengal (Northeast India) also have middling wages. Beijing wages appear very high in the early eighteenth century, even comparable to rural England. This is different from the findings in Allen et al. (Reference Allen, Bassino, Ma, Moll-Murata and Luiten van Zanden2011) because I am using English farm wages rather than London wages, which were inflated due to rents and contractor margins unaccounted for in the wage series (Stephenson Reference Stephenson2018). Wages then saw a steady decline up to the 1850s before seeing a recovery. Chinese wages were comparable or lower than Japanese wages from the 1840s–50s. However, this coincides with the opium wars, 1839–42 and 1856–60, and the Taiping rebellion, 1850–64, which suggests this was a temporary shock and long-run wages appear higher than in Japan. Bengal wages generally seem to average 4 baskets of goods. However, there were also some fluctuations, most notably in the 1770s due to famine and in the 1840s, which may be measurement error as suggested by the large standard error in that decade.
These findings show an early and stable divergence, which may initially appear to be inconsistent with other narratives. However, a careful analysis reveals the actual evidence is highly consistent with my finding. First, I look at the argument that Japanese living standards were comparable to those in England. The premise by Hanley (Reference Hanley1997) (and Pomeranz (Reference Pomeranz2009) in the case of China) is that equal living standards imply the lack of divergence, but this is methodologically flawed. Suppose two societies with decreasing return to labor as in Figure 11. One is labor scarce due to low population density resulting in high wages (society 1), while the other is labor abundant due to high population resulting in low wages (society 2). These societies have clearly diverged in wages and GDP per capita. Despite this divergence, if society 1 is highly unequal and typical households earn only wages while society 2 is highly equal with typical households earning GDP per capita, due to additional capital and land rental incomes, living standards will be very similar.
WAGES AND GDP PER CAPITA IN TWO SOCIETIES THAT HAVE DIVERGED
Source: Author’s illustration.

Society 2 is similar to Japan as the land was relatively equally distributed, meaning total incomes also included a supplemental (implicit) land rental income. In a companion paper, Kumon (Reference Kumon2021) shows that land was relatively equally distributed in Japan, and up to 84 percent of Japanense households owned some land.Footnote 17 In contrast, most English peasants were landless (Lindert Reference Lindert1987). Moreover, land rental incomes were large despite heavy taxes. They also increased over time due to the lords finding it risky to increase land taxes, due to potential rebellion, so that land taxation remained fixed while yields increased (Brown Reference Brown1987). Thus, increased yields were pocketed by the peasants as land rents and higher wages. A rough estimate of the distribution of incomes in Japan given such land rents is possible by splitting households into the lower (the bottom 40 percent), middle (middle 40 percent), and upper class (the top 20 percent) (see Online Appendix F for details). Only a small share of this land was owned by lower classes, who on average owned only 18 percent of the average land cultivated per household, while the middle and upper classes owned 80 percent and 305 percent, respectively.
Table 3 shows the estimated incomes of these peasants for each day of work, and these can be compared to the day wages shown earlier. The lower classes earned incomes that were only marginally higher than wages, while the middle class could afford 0.5–1.4 more baskets and the upper class could afford 1.9–5.5 more baskets, which gave them significantly higher incomes and shows the importance of accounting for land rental incomes. If I compare the annual income of the median peasant in Japan and England in 1800, assuming the median English peasant was landless (Lindert Reference Lindert1987), the Japanese are still poorer, but the incomes are more comparable. The wage laborer in England would earn 7 baskets per day but worked perhaps 280 days per year, meaning an average annual income that allows the consumption of 5.4 baskets per day over the year. The median Japanese peasant earned an income of 4.8 baskets per day but worked 325 days per year allowing a daily consumption of 4.3 baskets over the year. Further, the shorter pre-industrial heights of the Japanese (155 cm) relative to the English (165 cm), Dutch (164 cm), or French (164 cm) (Steckel Reference Steckel2001) may have been beneficial in reducing food expenditures as they required 250–300 fewer calories (FAO/WHO/ UNU 2004). This, in turn, would have significantly reduced food expenditures per person in Japan. Given these findings, it is unsurprising that a qualitative study of living standards could not find large differences between Japan and Western Europe preceding industrialization (Hanley Reference Hanley1997).
INCOMES IN BARE-BONE BASKETS FOR VARIOUS CLASSES IN JAPAN

Sources: Kumon (Reference Kumon2021) and estimates of land incomes detailed in Online Appendix F.
The second alternative narrative is by Bassino et al. (Reference Bassino, Stephen Broadberry, Gupta and Takashima2019) and recently updated by Nakabayashi et al. (Reference Nakabayashi, Fukao, Takashima and Nakamura2020), which is based on GDP per capita estimates shown in Figure 12. They place the beginnings of divergence in the medieval period. Japan was growing since this time but at a slower pace than England. However, the agricultural GDP per capita estimates are highly consistent with my farm wage estimates. Agricultural production per person was highly stable, with some fluctuations from ancient times to 1874. Moreover, both series identify the episodes of decline from 1600–1720 and growth from 1720–1800. This is reassuring as the agricultural production estimates are based on other evidence such as cultivation acreage and land productivity. The agricultural production itself suggests no growth and is highly consistent with the findings of a stable wage.
ESTIMATES OF GDP PER CAPITA AND AGRICULTURAL OUTPUT PER CAPITA
Note: The number of baskets before 1700 are all converted by assuming 1.48 koku of rice could buy a bare-bone baskets.
Source: Nakabayashi et al. (Reference Nakabayashi, Fukao, Takashima and Nakamura2020).

Therefore, much of the evidence raised in this literature is consistent with the idea that Japan had a stable divergence since medieval times. Although the narrative of slow growth in GDP per capita cannot be rejected by the evidence from this paper, as it also includes urban growth, the wage series evidence does raise concerns and place constraints on the narrative. First, the wages series confirms the evidence on a stagnant agricultural sector GDP per capita, so a steady growth must have been driven by the non-agricultural sector. The evidence for non-agricultural output is limited to estimates of population and urbanization, so measurement error is a concern (Saito and Takashima Reference Saito and Takashima2016). Second is the timing of non-agricultural growth. The GDP per capita series suggests the non-agricultural share of GDP grew rapidly from 26 to 37 percent between 1600–1721, which coincides with the period when farm wages and incomes were in steep decline. If demand for non-agricultural goods rests on the amount of income available beyond subsistence, then rural demand could not have spurred this structural transformation. It appears more likely that any growth was concentrated in the period, 1721–1800. Third, changes in the length of the work year have been used to explain how growth and day wages had different trajectories in England (Humphries and Weisdorf Reference Humphries and Weisdorf2019). This could not have been the case for rural Japan from the late seventeenth century onward.
CONCLUSION
This article has been the first to construct annual farm wage estimates for Japan, 1610–1870. The results show landless laborers in Japan were the poorest people recorded in history. There were some fluctuations in their wages, but wages never rose far above 3 bare-bones baskets. Some supplementary but weaker evidence also shows these low wages stretch back to at least 1400 (Saito and Takashima Reference Saito and Takashima2020). Therefore, Japan was stuck in a low-wage trap for at least half a millennium. In contrast, farm wages in England were at least double that in Japan over this span. One cause of this was Malthusian forces because wages were negatively correlated with population both across space and time.
I also showed the Japanese were incredibly hard-working, putting in over 325 days a year from the late seventeenth century. Unlike in England, there is no evidence for an upward trend in Japan as it approached industrialization. The long work year may have been partially caused by low wages and desperation. However, it may have, in turn, contributed to even lower day wages due to an increased labor supply. People survived in such conditions due to supplemental land rental incomes from widespread land ownership. Despite such supplemental incomes, the median peasant’s income would still have been slightly lower than the English level. The implications of these wage series is an early divergence between Japan and England that remained steady up to 1800. Explanations for divergence that rely on factors such as the black death cannot fully explain the divergence (Voigtländer and Voth Reference Voigtländer and Voth2006). Instead, we must seek answers to factors that long precede the black death.
The main implication of this paper is that a sophisticated society such as Japan could be sustained on low wages over the long run. However, this also did not prevent Japan from industrializing from the 1890s. Therefore, Japan may have developed on an alternative labor-intensive path of economic development that could also accommodate swift industrialization. Whether Japan was alone on this path or whether it was accompanied by its East Asian neighbors remains a question for future research.



