Introduction
The two-spotted spider mite Tetranychus urticae Koch (Acari: Tetranychidae) is widely distributed across the globe and can severely infest approximately 3,808 plant species, including fruit trees, vegetables, and cotton (Migeon et al., Reference Migeon, Nouguier and Dorkeld2010). As a highly destructive, polyphagous pest (Liesering, Reference Liesering1960; Campbell et al., Reference Campbell, Grayson and Marini1990; Migeon et al., Reference Migeon, Nouguier and Dorkeld2010), its small size, rapid reproduction, and short generational cycle however make the control of this pest particularly challenging on more than150 agricultural crops (Van Leeuwen et al., Reference Van Leeuwen, Vontas, Tsagkarakou, Dermauw and Tirry2010; Gonzalez-Gonzalez et al., Reference Gonzalez-Gonzalez, Blasco, Cubero and Chueca2021). Early detection of T. urticae is therefore crucial for preventing its large-scale proliferation and spread. Early surveillance enables effective control when pest populations remain low. Consequently, plant damage and control costs are significantly reduced compared to late-stage interventions, effectively avoiding the excessive pesticide (Sun et al., Reference Sun, Zhi and Tian2014). Currently, methods for monitoring T. urticae rely on labour-intensive visual inspection, including observing damage signs on leaves, webbing in the field, and counting numbers by magnifying glasses or microscopes. These approaches rely heavily on human experience, resulting in low efficiency and limited accuracy in early surveillance. Therefore, it is crucial to develop an efficient, non-destructive method to assess the infestation levels of spider mites on plants.
Image processing technologies demonstrate significant potential in the automatic diagnosis of diseases, addressing the limitations of traditional methods with limited expertise in the agricultural systems (Semeraro et al., Reference Semeraro, Mastroleo, Pomes, Luvisi, Gissi and Aretano2019; Najdenovska et al., Reference Najdenovska, Dutoit, Tran, Plummer, Wallbridge, Camps and Raileanu2021; Ao et al., Reference Ao, Yang and Ding2023). To date, researchers have developed numerous diagnostic methods and models based on image processing to achieve remarkable outcomes. However, during the early stage of spider mite infestation, the chlorosis symptoms are often subtle or even absent, making it challenging for the methods relying on visible light images to achieve effective detection.
Spectral technology has been used for detecting plant diseases due to its non-destructive, rapid, and accurate characteristics (Thenkabail et al., Reference Thenkabail, Lyon and Huete2018; Kuswidiyanto et al., Reference Kuswidiyanto, Kim, Fu, Kim and Han2023). Compared with RGB and multispectral imaging, hyperspectral imaging (HSI) generates a three-dimensional (3D) data cube by capturing both two-dimensional (2D) spatial information and one-dimensional continuous spectral information within the wavelength range of 400–2500 nm. This comprehensive data structure enables the detection of not only surface changes in plants but also internal physiological and compositional alterations caused by biotic stresses, such as diseases, pests, and weeds. (Susič et al., Reference Susič, Žibrat, Širca, Strajnar, Razinger, Knapič, Vončina, Urek and Gerič Stare2018; Hennessy et al., Reference Hennessy, Clarke and Lewis2020; Li et al., Reference Li, Luo, Wang and Wang2020). Considering the changes in plant appearance and internal structures caused by pest mite damage, it is feasible to conduct early monitoring by identifying the different spectral characteristics, particularly in the visible and near-infrared (NIR) wavelength regions before and after pest infestation (Gu et al., Reference Gu, Sheng, Zhang, Lu, Zhang, Zheng, Hu and Zhou2019; Gao et al., Reference Gao, Khot, Naidu and Zhang2020; Zhang et al., Reference Zhang, Vinatzer and Li2024). However, the excessive multiband data of hyperspectral images inherently increases processing complexity. To address this issue, Guan et al. (Reference Guan, Zhao, Feng, Xu, Wang and Song2023) applied principal component analysis (PCA) to preprocess hyperspectral images and used a three-layer 2D convolutional network to extract features before classifications. For instance, Wu et al. (Reference Wu, Fang, Jiang, Cui, Li, Ou, Diao and Zhang2023) utilised the 3D convolutional neural network (CNN) to classify hyperspectral images of strawberry grey mould disease. However, the application of deep learning for pest detection based on HSI data remains limited, partly because insufficient sample size challenging to build robust models (Lan et al., Reference Lan, Zhang, Hoffmann and Lopez2013; Mandrapa et al., Reference Mandrapa, Spohrer, Wuttke, Ruttensperger, Dieckhoff and Muller2024).
To address the above challenges, we integrated HSI and deep convolutional neural networks (DCNNs) to evaluate the severity of T. urticae infestation. We carried out the following tasks: (1) analysed the spectral characteristics of leaves damaged by spider mite; (2) evaluated the classification performance of extracted spectral features for assessing infestation severity under small-sample datasets; and (3) investigated a deep learning based joint spatial-spectral attention (SSA) neural network for determining the optimal model under different infestation levels. While the specific magnitude and spectral expression of physiological damage caused by spider mites can vary across plant species, the foundational biological mechanisms – specifically chlorophyll degradation and the destruction of cellular structures – remain fundamentally consistent (Bensoussan et al., Reference Bensoussan, Santamaria, Zhurov, Diaz, Grbić and Grbić2016). This study aims to provide support for the classification and grading of spider mite damage levels on susceptible greenhouse vegetable crops, particularly bean plants.
Materials and methods
Sample collection and data acquisition
Hyperspectral image acquisition for spider mite infestation was conducted in the Predatory Mite Research Group of the Institute of Plant Protection, Chinese Academy of Agricultural Sciences, Beijing, China. Two-week-old host bean plants (Phaseolus vulgaris L.) and T. urticae were cultivated and maintained under the conditions of 25 ± 1℃, 70 ± 5% relative humidity and L14:D10 photoperiod. Fifteen host plant seedlings with uniform appearance and growth conditions were selected, among which 10 plants were designated as the treatment group. The exact count of 200 T. urticae was rigorously verified using a stereomicroscope, and they were individually transferred onto the leaves using a fine brush to ensure accurate initial infestation levels, while the remaining five plants served as the healthy control group. For each plant, the first two emerged leaves (the primary leaves) were selected for continuous observation and imaging throughout the study period. These selection criteria ensured that all monitored leaves were at the exact same developmental stage and physiological age, thereby providing a highly uniform background spectral signature. After infestation, all plants were cultivated under same conditions for 7 consecutive days. Hyperspectral data were measured twice a day, at 7:00 AM and 7:00 PM, under consistent measurement environments (i.e. a completely dark room, uniform halogen lighting, and a fixed camera-to-sample distance). Based on infestation days of the pest mite on plants, the treated groups were categorised into three levels of ‘Mild’, ‘Middle’, and ‘Severe’, with further subdivisions as follows: ‘Mild’ into ‘Mild 1’ and ‘Mild 2’; ‘Middle’ into ‘Middle 1’ and ‘Middle 2’; and ‘Severe’ into ‘Severe 1’, ‘Severe 2’, and ‘Severe 3’. The infestation levels were classified by integrating macroscopic visual symptoms, such as leaf colour and contour alterations, with their distinct spectral signatures. These categories were assigned sequence numbers from 1 to 7, with the healthy control group designated as No. 8 for reference.
The optical detection equipment utilised in this study consisted of the portable HSI spectrometer Hc-6010 (custom-developed and manufactured by the Changchun Institute of Optics, Fine Mechanics and Physics, Chinese Academy of Sciences, Changchun, China). The hyperspectral camera was configured to operate in the visible-to-NIR range (400–1,000 nm) captured spectral resolution of 300 bands. Four 50-W halogen lamps (manufactured by OSRAM, Germany) were installed on both sides along the x-axis with four on each side to illuminate the scanning line. The acquired hyperspectral images had a resolution of 480 × 1200 pixels, with each scan measuring three to five leaves. The movable platform set-up was illustrated in fig. 1. The system’s spatial coordinate system is defined by the physical scanning process. The x-axis represents the spatial width covered by the spectrometer’s slit, which remains fixed in its orientation. The y-axis represents the scanning direction (motion axis), where the image length is generated as the camera translates linearly over the samples. A hyperspectral camera was mounted centrally at the top, while a conveyor belt and motor were installed along the x- and y-axes to facilitate camera movement. The y-axis represented the distance between samples, and the lens-to-sample distance was fixed at 300 mm to ensure optimal focus and resolution. The total length of the x-axis was 500 mm, and during the experiments, the camera moved 300 mm at a speed of 150 mm/s to capture line-scan images. For visualisation, composite RGB images were generated by selecting the 120th, 65th, and 45th channels as the R, G, and B channels, respectively. Representative RGB images synthesised from the hyperspectral data are shown in fig. 2. The acquired HSI data were analysed using the spectral library in Python 3.10. Several specialised libraries were employed to facilitate the workflow: Spectral Python was used for hyperspectral image reading and visualisation; NumPy and Pandas were utilised for numerical operations and data structuring; Scikit-learn was applied for data normalisation and classical machine learning tasks; and PyTorch was used for the development and training of the deep learning models.
The overview of hyperspectral measurement system with camera and plant.

Time-series pseudo-RGB images (channels 120, 65, 45) of bean leaves under progressive T. urticae infestation, ranging from healthy (left) to severe (right). The white square represents the standard reflectance panel for calibration.

Hyperspectral image data preprocessing
The hyperspectral image data were put through the preprocessing pipeline, as shown in fig. 3. A weighted mean square error (WMSE) algorithm was employed to eliminate outliers in the spectral dimension (Hu et al., Reference Hu, Jin, Wang, Zhang, Kwong and Kuo2017). Since the noise-free hyperspectral image was unknown, the mean square error (MSE) for each spectral band of the original hyperspectral image was considered. A weight wi was assigned to the MSE of each spectral band. The overall MSE of the entire hyperspectral image can thus be represented as the WMSE, as shown in Equation (1).
 \begin{equation}WMSE = \frac{1}{c}\mathop \sum \limits_k^c {\left( {{I^k} - {\bar{I}^k}} \right)^2}{\text{ }},\end{equation}
Spectral curves illustrating the sequential preprocessing pipeline for a representative sample group. The subplots (from left to right) display the original spectra, outlier rejection based on WMSE, multivariate scatter correction (MSC), Savitzky–Golay filtering, and the final preprocessed mean spectrum with variance bounds (red dashed lines).

In the equation, C represents the number of channels in the hyperspectral image, while  ${I^k}$ and
 ${\bar I^k}$ denote the greyscale value of the kth spectral band of the hyperspectral image and the mean greyscale value of that band, respectively. Subsequently, for each pixel’s spectral data, a query is performed: if the pixel value falls within the range of
 ${I^k}$ ± WMSE.
By placing the calibrated standard reflectance panel around the target, both the target’s hyperspectral image and the hyperspectral image of the standard reflectance panel can be collected (Rabatel et al., Reference Rabatel, Al Makdessi, Ecarnot and Roumet2017). Utilising Equation (2) in conjunction with the known calibrated spectra allowed for the normalisation of the hyperspectral image, which can partially correct for radiometric errors and transform the image greyscale values between 0 and 1.
 \begin{equation}R = \frac{{({I_o} - {I_b})}}{{{I_w} - {I_b}}},\end{equation}
In this context,  ${I_{\text{O}}}$ represents the unprocessed hyperspectral image data,
 ${I_b}$ denotes the dark noise from the imaging chip of the spectrometer, which is typically collected by covering the lens, and
 ${I_w}$ refers to the hyperspectral image data of the area where the standard reflectance panel is located.
Multivariate scatter correction (MSC) operates based on a spectral matrix from a set of samples. As a scatter correction technique, MSC was applied to minimise the influence of light scattering caused by leaf surface irregularities and light path variations, thereby enhancing the spectral features related to the physiological state of the plants. The specific algorithmic process for calculation is as follows Equation (3) (Roessner et al., Reference Roessner, Segl, Heiden and Kaufmann2001). The average of all spectral data was obtained and referred to as the ideal spectrum.
 \begin{equation}{\bar I^k} = \frac{1}{c}\mathop \sum \limits_{i = 1}^m \mathop \sum \limits_{j = 1}^n {I_{ij}}\end{equation}
We performed a univariate linear regression of each sample’s spectrum against the average spectrum to solve the least squares problem, obtaining the baseline shift and offset for each sample, as shown in Equation (4).
 \begin{equation}{I^k} = {A_k}{\bar I^k} + {B_k}\end{equation}
Subsequently, the spectrum of each sample was corrected by subtracting the obtained baseline offset and dividing by the intercept, as shown in Equation (5).
 \begin{equation}{\hat I^k} = \frac{{{I^k} - {B_k}}}{{{A_k}}}\end{equation}
After correcting the edge bands of the hyperspectral image, significant noise was present due to the low signal-to-noise ratio of the sensor. The original 300 spectral channels were trimmed by 25 channels from both the start and end of the spectrum, leaving 250 channels for analysis. Savitzky–Golay filtering was then used for denoising data (Ruffin et al., Reference Ruffin, King and Younan2008; Ning et al., Reference Ning, Tan, Li, Jiao and Wen-Hao2020).
Hyperspectral image data dimensionality reduction
The processing of hyperspectral image data was challenged by the large volume of data storage and the increased computational complexity. By focusing on small samples, we considered dimensionality reduction for hyperspectral images in small sample scenarios, which can effectively improve the classification accuracy of hyperspectral images. According to electromagnetic wave theory, the absorption features indicated physical things, such as for water, chlorophyll, certain gases, and minerals (Mahlein et al., Reference Mahlein, Kuska, Behmann, Polder and Walter2018). To highlight certain features of the spectral band calculations, the plant indices are listed in table 1.
The formulae and calculation details of vegetation indices used for plant analysis

Traditional indices use only 3–10 specific spectral bands (wavelengths), wasting the rest and yielding illumination-sensitive, unquantified proxies that may blur useful gradients (Shirzadifar et al., Reference Shirzadifar, Bajwa, Nowatzki and Shojaeiarani2020). To address these limitations and learn the intrinsic low-dimensional features from the full hyperspectral data, we therefore chose super-pixel PCA method (SPCA; fig. 4). Unlike traditional empirical methods that rely on selecting specific discrete wavelengths, SPCA transforms the highly correlated high-dimensional spectral data (400–1,000 nm) into a reduced set of orthogonal principal components. This transformation effectively fuses and retains the most informative variance across the entire spectrum. Consequently, it inherently captures critical physiological changes, such as chlorophyll degradation in the red-edge (680–760 nm) and cellular damage in the NIR (700–1000 nm) regions, without losing hidden features to manual band selection. Furthermore, since SPCA relies on spatial segmentation, we compared the performance of different super-pixel algorithms, including Felzenszwalb, SLIC, Quickshift and Compact Watershed (fig. 5). Considering the overall performance, SLIC was selected as the optimal algorithm for this study. The specific implementation details of the SLIC-based spatial partitioning are provided in table 2.
Schematic of super PCA-based dimensionality reduction for hyperspectral images (HSIs).

Felzenszwalb’s method, SLIC, Quickshift, Compact Watershed super-pixel segmentation spatial dimension results.

SLIC-based super-pixel Segmentation for hyperspectral data

Deep neural network for early detection of T. urticae on the leaf
The CNN model and residual neural network were used in data classification tasks. When directly applying the network to small-sample hyperspectral image classification, the network may fail to converge due to the vanishing gradient caused by the deepening of the network.
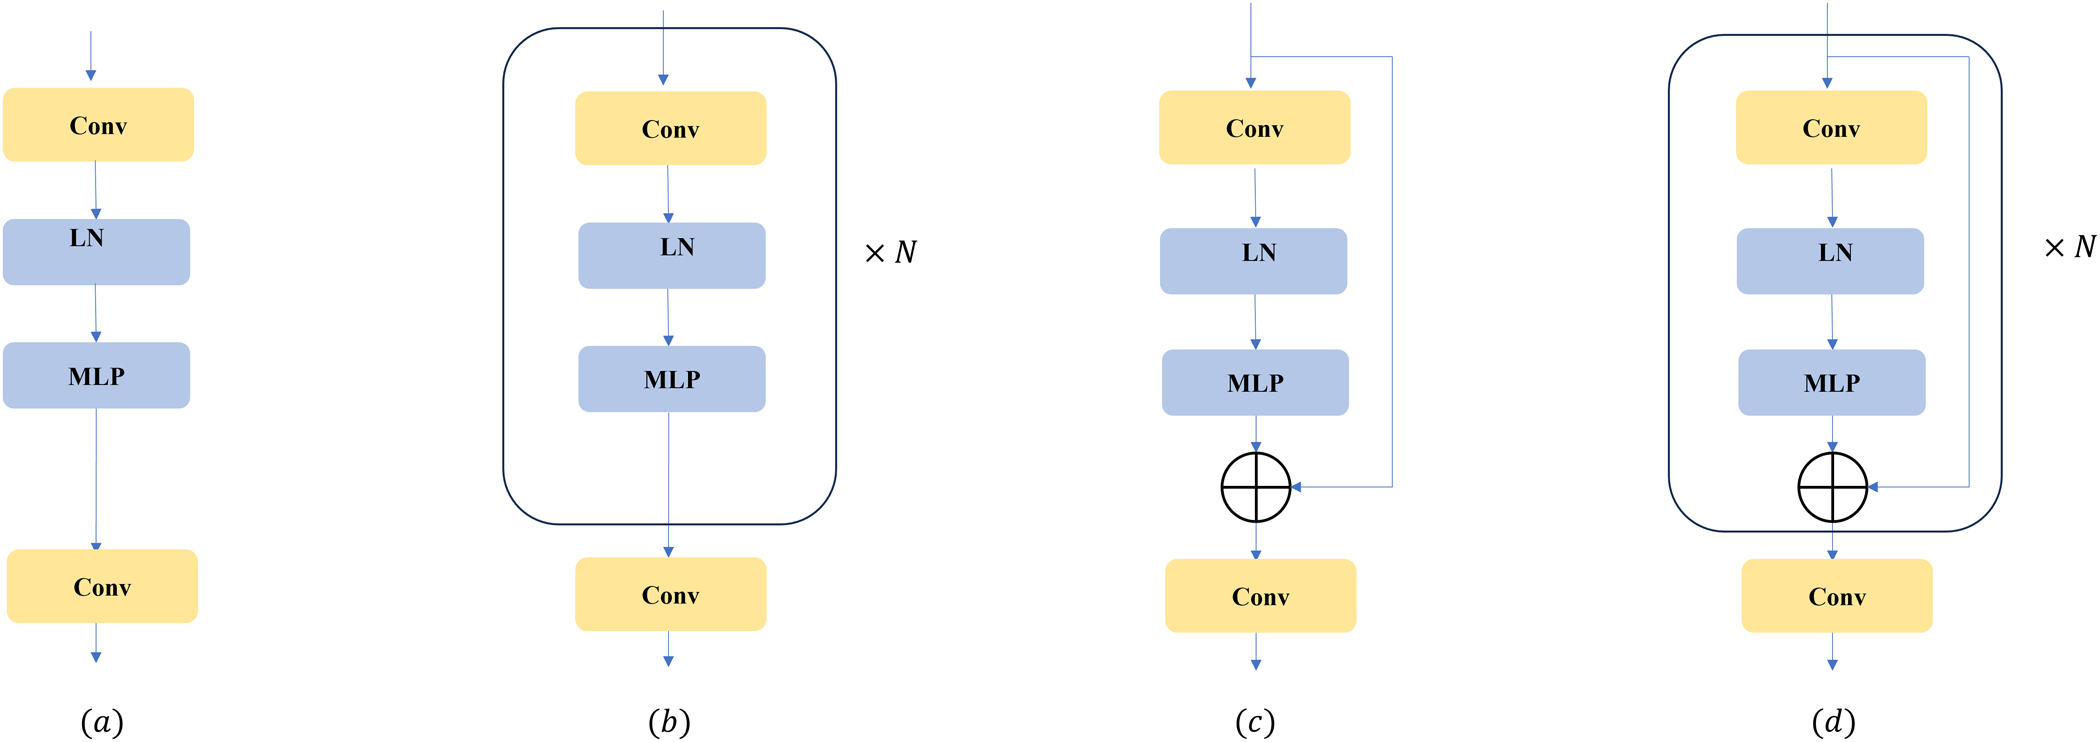
In this study, the spatial dimension of hyperspectral images cannot be overlooked. The pest detection model took image patches as input and generates predicted labels for these patches. Given the ith pixel to be classified, its neighbouring pixels may differ in terms of illumination, viewpoint, and category. Considering such spatial variations, a spectral-spatial attention mechanism in a DCNN (DCNN + SSA) was designed. The overall framework of the proposed DCNN + SSA classification method was illustrated in fig. 6. This model has two key features, including the improvement of the discriminative power of the learned features and the integration of attention modules in both spatial and spectral dimensions (Mahlein et al., Reference Mahlein, Steiner, Hillnhütter, Dehne and Oerke2012; Pandey et al., Reference Pandey, Singh, Khan and Semwal2022; Bao et al., Reference Bao, Zhou, Bhuiyan, Adhikari, Tuxworth, Ford and Gao2024). The detailed architecture of the network, specifically highlighting the SSA modules, is presented in fig. 7. During the pest detecting process, infested areas typically exhibited distinct texture and colour characteristics, so the spatial attention aided the model in identifying and differentiating pest-affected regions from healthy leaves. The specific structure of the DCNN + SSA network can be expressed mathematically through the following functional computation:
 \begin{equation}{C^i} = f\left( {\sum\nolimits_j {\left( {{W^{i*}}} \right) + {b^i}} } \right),\end{equation}
Outline of the proposed spatial-spectral attention super PCA-based HSI classification framework.

Outline of the proposed spatial-spectral attention super PCA-based HSI classification.

In this context,  ${C^i}$ represents the ith channel of the convolutional feature map,
 ${W^i}$ denotes the ith convolutional kernel,
 ${b^i}$ is the bias term for the ith feature map, and
 ${X^j}$ refers to the jth input feature.
Loss function can be expressed as following:
 \begin{align}
{\text{L = }}& {\mathcal{L}^{{\text{spectral}}}} + {\mathcal{L}^{{\text{spatial}}}} \nonumber \\
&{\text{ = }} - \frac{1}{m}\sum\nolimits_{i = 1}^m {[{y_i}log(\hat y_i^{{\text{spectral}}}) + (1 - {y_i})\log (1 - \hat y_i^{{\text{spectral}}})]}, \nonumber \\
& \quad - \frac{1}{m}\sum\nolimits_{i = 1}^m {[{y_i}log(\hat y_i^{{\text{spatial}}}) + (1 - {y_i})\log (1 - \hat y_i^{{\text{spatial}}})]}
\end{align}
Model deployment and training
Due to PyTorch’s dynamic debugging, visualisation capabilities, and efficient GPU acceleration, all neural network models in this study were developed based on this Python open-source machine learning framework. The hyperspectral data from groups 1 to 8 were preprocessed, and after applying PCA and SPCA, they were labelled to train the DCNN and DCNN + SSA models, with the number of epochs set to 100. To enhance the model’s generalisation ability, the data were divided into several patches, each with a size of 100 × 100 × 30 for the hyperspectral images.
K-fold cross-validation was used as a commonly adopted evaluation strategy to test the model’s robustness and generalisation ability. When applying K-fold cross-validation, evaluation results were obtained from different subsets of the dataset, and reported by averaging all evaluation outcomes. Monte Carlo sampling was used to sample from patches, with a total dataset size of 1000 image patches. Among these, 800 patches were allocated to the training set, 100 patches to the validation set, and 100 patches to the test set. The hardware platform for model training was as follows: CPU: Intel i7-14700KF, GPU: NVIDIA RTX-4090 24GB, with 48GB system memory.
Evaluate method
Overall accuracy (OA) and Kappa coefficient were commonly used metrics to evaluate the performance of classification models, when Kappa coefficient provided a more reliable evaluation than simple OA in such cases (Li et al., Reference Li, Hong, Ni, Li, Wang, Zheng and Lin2014; Wang et al., Reference Wang, Das, Pang and Liang2021). In this study, class imbalance existed, as healthy pixels significantly exceeded the pest-infected pixels in the hyperspectral images of early-infected leaves. As a result, OA may give inflated results, and the classifier may still achieve a high OA even if it did not effectively recognise the rare class. The formula was as follows:
 \begin{equation}\mathrm{OA} =
\frac{\text{pixels classified correctly}}{\text{total pixels}}
=
\frac{\sum_{i=1}^{C} {\text{TP}}_i}{\sum_{i=1}^{C} {\text{Total}}_i}\end{equation}
The Kappa coefficient was used to measure the agreement between classification results and random classification results. The formula is as follows:.
 \begin{equation}{{\kappa }} = \frac{{{P_o} - {P_e}}}{{1 - {P_e}}}\end{equation}
 ${P_{o}}$ is the observed agreement (the proportion of actual classifications that match the predicted classifications), which is the same as the OA.
 ${P_e}$ is the expected agreement, which represents the probability of random agreement between categories under the assumption of completely random classification. Kappa coefficient takes into account the effect of random agreement, providing a more accurate assessment of the classifier’s performance, particularly in cases of class imbalance, where it reduces the overestimation produced by OA.
Results
Spectral characteristics of the bean leaves
Hyperspectral images of the host plant leaves at different infestation levels of the spider mites were acquired (fig. 1) and visualised (fig. 2). To ensure the reliability and effectiveness of the analysis, a series of data processing and feature engineering steps were executed, including spectral band trimming, feature selection, and super-pixel optimisation (figs. 3–7). Building on this processed data, analysis of the leaves revealed the clear spectral absorption characteristics reflectance in the visible light region (400–700 nm) gradually decreased, while the reflectance in the NIR region (700–1000 nm) significantly increased along with the increased pest mite damage (fig. 8). This phenomenon is driven by two distinct factors. Biologically, severe infestation leads to the collapse of internal leaf spongy mesophyll structures, which lowers NIR reflectance. Furthermore, from a sensor-related perspective, this trend is intensified by the intrinsic decrease in quantum efficiency of the Hc-6010 spectrometer’s silicon-based charge-couple device detector at the limit of its 400–1,000 nm operating range.
Spectral characteristics of leaves at front and back sides.

The spectral correlation matrix and spatial correlation matrix indicated that along with the longer infestation time, the spectral correlation of the leaf became smoother, with key spectral features disappearing (fig. 9). The spatial correlation of the leaf decreased, and the texture features and details became blurred, with strong correlation only remaining at the edges of the leaf.
Pseudocolour image of locally mite-infested leaves, spectral correlation, and spatial correlation.

SPCA + DCNN + SSA model training and analysis
The training loss of all six models decreased steadily with increasing epochs (fig. 10), indicating progressive parameter optimisation. The training and validation accuracies of the DCNN, DCNN + SSA, and PCA + DCNN models exhibited considerable fluctuations across epochs. In contrast, the SPCA + DCNN, PCA + DCNN + SSA, and SPCA + DCNN + SSA models showed smoother accuracy curves and more stable convergence characteristics. For all models incorporating SPCA, both training and validation accuracies increased consistently throughout training. Among these models, the SPCA + DCNN + SSA model achieved the highest and most stable accuracy (table 3), with both curves approaching 100% during the final epochs. These results demonstrated that combining SPCA with attention mechanisms enhanced model stability and convergence.
Training and validation performance of the experimental models. Each sub-figure (a–f) includes both loss and accuracy plots for: (a) DCNN, (b) DCNN + SSA, (c) PCA + DCNN, (d) SPCA + DCNN, (e) PCA + DCNN + SSA, and (f) SPCA + DCNN + SSA. Within each plot, the blue and orange lines represent the training and validation results, respectively, across 100 epochs.

Comparison of different algorithms of infection detection of pest mite infestation on leaves

Inversion of the pest mite infection degree
By utilising the spectral, texture, and spatial information of plant leaves, the severity of spider mite infestation can be visualised in an intuitive manner, typically represented by colour coding of different severity levels (fig. 11). This visualisation transformed from image data to the distribution of infestation severity through several steps. Specifically, spectral and texture features were extracted from the hyperspectral images of the leaves, followed by feature fusion and deep learning classification using SPCA and DCNN + SSA architectures. The final identification was displayed through pseudocolour mapping, with red areas of severe infestation and green areas of intact tissues. This method can effectively demonstrate the distribution of pest infested area on leaf for quickly diagnose by visualisation.
Visualisation of spider mite infestation severity based on spatial-spectral-texture information. The sub-figures represent the results from (a) Original hyperspectral single-channel image (b) Leaf image after PCA clustering (c) DCNN prediction visualisation without using super PCA (d) DCNN prediction visualisation using Super PCA (e) DCNN + SSA prediction visualisation using super PCA, and (f) SPCA + DCNN + SSA.

In terms of the classification and detection, the identification of hyperspectral images of plant leaves with spider mites showed significant effectiveness (table 2) to clearly distinguish the healthy and infested areas of the leaves, as visually confirmed by the pixel-wise segmentation (fig. 11). However, when used PCA alone, the non-supervised clustering method can only extract the leaf’s outline but failed to identify the various severity of the spider mite damage. When only used PCA/SPCA based DCNN prediction, the smoothy images can exhibit relatively severe damage but not subtle infected regions on the leaves. To improve accuracy, a strategy combining SPCA and DCNN was introduced. After SPCA processing, the prediction performance of DCNN was significantly enhanced, especially in terms of the fine local texture inversion of lightly infested leaves. However, for severely infected leaves, although improved, there remained a certain lack of accuracy, which may result from algorithm limitations or data characteristics.
The original PCA model only reduced the spectral dimension that was not suitable for direct classification (table 2). All five DCNN models based on different features achieved high classification accuracy, with OA greater than 80% and Kappa coefficients greater than 80% for classifying different levels of pest infestation. In the DCNN models constructed using single features, the spectral wavelengths selected by the PCA and SPCA methods yielded good classification results. Specifically, the average OA and Kappa reached 96.01% and 98.97% for PCA, and 94.98% and 98.23% for SPCA, respectively. For identifying specific categories, the results of SPCA + DCNN + SSA showed that the spectral wavelengths and texture features selected by SPCA, when integrated, can more accurately reflect effective information on different levels of mite damage on the leaves. This combined algorithm was able to differentiate infected and healthy leaf patches, with the distribution of the red areas clearly reflecting the pest mite infestation. The addition of SSA enhanced the ability to locate infected areas and identify boundaries, especially under complex backgrounds.
To further investigate the class-specific performance of each deep learning model, the detailed classification was presented in the confusion matrices (fig. 12). For the baseline DCNN model, the average per-class accuracy was approximately 88%, with notable misclassification errors (around 4.0%) occurring between adjacent severity levels, such as Healthy-0 being confused with Mild-1. Similarly, the PCA + DCNN model exhibited reduced accuracy in middle stages. The introduction of the SSA module in the PCA + DCNN + SSA model significantly reduced confusion, raising the lowest class accuracy (Middle-1) to 95.2%. Most importantly, the final proposed SPCA + DCNN + SSA model achieved the highest accuracy for every single class, with the accuracy for Healthy-0 reaching 98.6% and the accuracy for the highly challenging Middle-1 class reaching 98.7%. The misclassification rate was drastically reduced across all categories, with nearly all remaining errors being confined to highly adjacent severity stages (e.g. Severe-2 misclassified as Severe-3 at only 0.9%). The combined SPCA and SSA strategy was found to provide superior robustness and discriminative power across mite infestation severity on the leaves.
Confusion matrices comparing the classification accuracy of four models: DCNN, PCA + DCNN, PCA + DCNN + SSA, and SPCA + DCNN + SSA.

Discussion
The traditional detection of spider mites on crops is challenging due to their small sizes, causing labour-intensive and inefficient pest surveillance. HSI thus has the great potential to differentiate subtle physiological changes of plants, providing an effective non-destructive diagnostic tool (Ekramirad et al., Reference Ekramirad, Khaled, Doyle, Loeb, Donohue, Villanueva and Adedeji2021; Yan et al., Reference Yan, Xu, Lin, Duan, Gao, Zhang and Lv2021). When spider mites infest on the plant, the physiological parameters could be changed significantly, including chlorophyll, water, and cellular structure (Semeraro et al., Reference Semeraro, Mastroleo, Pomes, Luvisi, Gissi and Aretano2019). T. urticae pierces mesophyll cells to feed, decreasing the chlorophyll content of the leaves and altering the leaf’s physical and chemical properties (Fraulo et al., Reference Fraulo, Cohen and Liburd2009). This physiological change provides the basis for hyperspectral detection. Healthy plants typically reflect less light in the visible range (400–700 nm) due to the high absorption of these wavelengths by photosynthetic pigments (Carter, Reference Carter1993; Sims and Gamon, Reference Sims and Gamon2002). The Red edge (680–760 nm) and NIR (700–1000 nm) regions are known to be sensitive to chlorophyll concentrations and cellular structure, making them key bands for identifying leaf changes caused by T. urticae feeding. We also observed a significant increase in reflectance at the red edge (680–760 nm) and NIR (700–1000 nm) regions after infestation with mite (fig. 8), confirming the degradation of chlorophyll concentration and the damage to internal cellular structure (Vanegas et al., Reference Vanegas, Bratanov, Powell, Weiss and Gonzalez2018; Jiang et al., Reference Jiang, Johansen, Stanschewski, Wellman, Mousa, Fiene, Asiry, Tester and McCabe2022). This consistency between the observed spectral characteristics and the established physiological damage mechanisms underscores the fundamental feasibility of using hyperspectral technology for pest diagnosis (Slaton et al., Reference Slaton, Raymond Hunt and Smith2001). Future studies will focus on identifying discrete optimal spectral bands to explain the physiological plant–mite interactions and further improve model interpretability.
While simple spectral indices are widely used for plant stress detection, their performance often suffers from a lack of quantitative accuracy and redundant information (Uddin et al., Reference Uddin, Mamun and Hossain2021). As demonstrated in fig. 13, the effectiveness of the 16 selected vegetation indices was highly inconsistent across different severity levels. This limitation stems from the fact that these indices typically utilise only a few spectral channels, thereby wasting the information contained in the hundreds of other channels available in hyperspectral data (Pesaresi et al., Reference Pesaresi, Mancini, Quattrini and Casavecchia2024). Furthermore, traditional pixel-wise methods struggle to accurately segment the tiny, localised, and textural damage spots characteristic of mite infestation (Uddin et al., Reference Uddin, Mamun and Hossain2021). To effectively capture these high-level spatial features, we first employed a super-pixel segmentation strategy. The performance of the Felzenszwalb, SLIC, Quickshift, and Compact Watershed algorithms were evaluated based on boundary accuracy and computational complexity (Felzenszwalb and Huttenlocher, Reference Felzenszwalb and Huttenlocher2004; Vedaldi and Soatto, Reference Vedaldi and Soatto2008; Şakaci and Ertürk, Reference Şakaci and Ertürk2018). In our study, the SLIC method was selected as the optimal algorithm because it generated uniform and compact super-pixels (fig. 5) that maintained the integrity of the leaf region and facilitated the separation of the leaf and background, while also exhibiting favourable computational complexity and spectral loss (table 2). This crucial preprocessing step transformed the raw data into meaningful spatial units, laying the structural foundation for subsequent feature selection.
The spectral indices of the plant leaves in the first group of samples.

Recently, various deep learning systems have been proposed for plant leaf damage detection, integrating methods such as image-level and pixel-level classification, convolutional block attention modules, and multilayer feature fusion networks to enhance the accuracy of prediction and severity grading for diverse crops (Alirezazadeh et al., Reference Alirezazadeh, Schirrmann and Stolzenburg2023; Sunil et al., Reference Sunil, Jaidhar and Nagamma2023; Gautam et al., Reference Gautam, Ranjan, Dahiya and Kumar2024; Polly and Devi, Reference Polly and Devi2024). These works successfully established the capability of DCNNs to capture complex feature relationships (Chen et al., Reference Chen, Jiang, Li, Jia and Ghamisi2016; Li et al., Reference Li, Zhang and Shen2017; Mou et al., Reference Mou, Ghamisi and Zhu2018; Zhong et al., Reference Zhong, Li, Luo and Chapman2018). For instance, Li et al. (Reference Li, Zhang and Shen2017) and Chen et al. (Reference Chen, Jiang, Li, Jia and Ghamisi2016) employed CNNs and 3D CNNs, respectively, to extract features from raw HSI cubes, while Zhong et al. (Reference Zhong, Li, Luo and Chapman2018) utilised a spectral-spatial residual network. These studies successfully established the capability of DCNNs to capture complex feature relationships. Different from the abovementioned methods, the spectral-spatial deep learning-based methods not only consider the spectral signatures but also exploit the spatial information from HSI classification (Sun et al., Reference Sun, Zheng, Lu and Wu2020). We introduced an innovative architecture combining DCNNs with the SSA module, which in our study achieved the highest OA and Kappa coefficient, confirming its superior performance over all comparative methods. The superior performance was primarily attributed to the feature optimisation capability of the integrated SSA module. Unlike traditional frameworks that processed spectral and spatial features separately, the DCNN + SSA architecture utilised the attention mechanism to achieve dynamic fusion and simultaneous optimisation of both feature domains (Li et al., Reference Li, Zhao, Li, Du, Xi and Hu2018). The attention mechanism was inspired by the human visual system to capture key areas from images for classification (Haut et al., Reference Haut, Paoletti, Plaza, Plaza and Li2019; Wang et al., Reference Wang, Liu, Chanussot and Li2019). The spatial attention submodule was instrumental in locating the tiny, localised, and textural damage spots characteristic of mite infestation. It assigned higher weights to these affected regions, effectively enhancing the model’s sensitivity to local texture features and suppressing background noise as demonstrated by the clear boundaries. Concurrently, the spectral attention submodule operated by adaptively weighting the importance of different spectral channels. This mechanism allowed the model to dynamically prioritise the most discriminative bands such as those in the red-edge and NIR regions, which were highly sensitive to physiological stress. The integrated action of the SSA mechanism significantly enhanced feature discriminability. In summary, the combination of SPCA-selected features and the DCNN architecture optimised by the SSA module was confirmed to effectively distinguish between the subtle physical and physiological changes induced by different levels of T. urticae infestation. This validated the effectiveness of the attention-guided feature fusion strategy for high-precision, pixel-wise severity grading.
In addition, the study visualised the extent of leaf damage through significance detection, detail extraction, and region segmentation. Significance detection highlighted the spectral and texture anomalies in the affected leaf areas. Detail extraction captured changes in leaf texture and venation structure, further reflecting the impact of leaf damage on the physiology and morphology. Region segmentation combined spectral and spatial information, dividing the leaf into healthy and different damage severity regions, which were intuitively represented by colour coding. This HSI-based classification method not only demonstrated the dynamic changes in both spectral and spatial dimensions of leaf features but also provided an accurate quantitative tool for damage grading.
However, the current system relied on laboratory-based hyperspectral sensors, which are not easily deployed in field environments, thus limiting the immediate generalisability of the model (Gonzalez-Gonzalez et al., Reference Gonzalez-Gonzalez, Blasco, Cubero and Chueca2021). Nevertheless, by accurately mapping pre-symptomatic physiological stress (e.g. localised chlorophyll degradation), the proposed pixel-wise grading framework holds concrete implications for greenhouse facility agriculture. This early-warning capability enables growers to pinpoint early infestation hotspots and implement targeted treatments, thereby significantly reducing routine excessive pesticide applications. Therefore, future research will prioritise to develop the compact and cost-effective hyperspectral sensors for unmanned aerial vehicles or proximal field instrumentation, making real-time data collection feasible. Furthermore, development of the benchmark dataset to encompass a broader range of environmental conditions and plant species will enhance model robustness and transferability. This will allow to identify the most discriminative spectral feature for each pest and host plant and establish a damage-scaling framework for plant protection.
Conclusions
HSI was proven to be an effective tool at the microscopic level to assess the impact of spider mite on crops with variable symptoms. Combining HSI with supervised deep learning classification could adapt to pixel representations of symptoms with varying sizes and partitioning attributes. Our study confirmed the impact of 2D feature parameters extracted from hyperspectral images spectral and texture information on estimating the severity of spider mite infestation on host plant. Certain structural features in the visible spectrum, particularly spectral and spatial correlations, also showed highly associated with infestation severity by spider mites. Using combined input features and prediction models of SPCA, DCNN, and SSA could significantly improve the estimation accuracy of the spider mite infestation on plants.
Acknowledgements
This work was supported by the Changchun Science and Technology Development Plan Project (Grant No. 22SH03); the Jilin Province and Chinese Academy of Sciences Science and Technology Cooperation High Tech Special Fund Project (Grant Nos. 2023SYHZ0020, 2022SYHZ0008, 2023SYHZ0047); the Jilin Province Science and Technology Development Plan Project (Grant Nos. 20220201060GX, 20230204095YY, 20230508038RC, 20230201045GX); the Scientific and Technological Innovation Project of Black Land Protection and Utilization (Grant No. XDA28050201); and the National Natural Science Foundation of China (NSFC) (Grant No. 42377037). We also appreciate the support from Central Public-interest Scientific Institution Basal Research Fund (No. S2025XM38).
Author contributions
Conceptualization, H.X., and B.Z.; methodology, H.X.; software, H.X.; validation, H.X., and Y, J.; investigation, H.X., and S.J.; writing – original draft preparation, H.X.; writing – review and editing, B.Z., and and Y, J.; visualization, H.X.; supervision, B.Z., and X.T.; funding acquisition, B.Z., and X.T. All authors have read and agreed to the published version of the manuscript.
Competing interest
The authors declare no conflict of interest.
Data availability statement
The data presented in this study are available in the article.