1. Introduction
The formation of regular patterns close to the onset of a hydrodynamic instability in spatially extended flows is well documented for generic cases. The most prominent examples are convection rolls in Rayleigh–Bénard flow (Busse Reference Busse1978; Bodenschatz, Pesch & Ahlers Reference Bodenschatz, Pesch and Ahlers2000) heated from below and cooled from above, Taylor vortices in Taylor–Couette flow (Andereck, Liu & Swinney Reference Andereck, Liu and Swinney1986) between two rotating concentric cylinders and inclined turbulent stripe patterns in plane-shear flows driven by a pressure gradient or wall movement (Barkley & Tuckerman Reference Barkley and Tuckerman2005; Duguet & Schlatter Reference Duguet and Schlatter2013). Specifically linearly unstable systems, such as Rayleigh–Bénard convection, with a sharp transition threshold to the convective flow state allow a perturbative expansion about the first unstable mode at onset. The expansion leads to an amplitude equation which is simpler than the original fluid equations and describes the formation of simple patterns as a function of the system parameters (Cross & Hohenberg Reference Cross and Hohenberg1993; Hoyle Reference Hoyle2006). The derivation of nonlinear phase diffusion equations allows the modelling of increasingly complex patterns, such as spirals or defects (Hoyle Reference Hoyle2006), which have also been detected in experiments, e.g. by Croquette (Reference Croquette1989) and Morris et al. (Reference Morris, Bodenschatz, Cannell and Ahlers1991). Defects are imperfections in the patterns such as dislocations (Cross & Greenside Reference Cross and Greenside2009). In large-aspect-ratio cells, this results in a state of slowly evolving spirals and defects which is known as spiral defect chaos (SDC). In such SDC regimes, all symmetries of the governing equations have been spontaneously broken (Busse Reference Busse2003). For example, the azimuthal symmetry of the roll patterns is broken in an extended cylindrical cell. When the temperature difference across the fluid layer is further increased, the fluid motion crosses over from the weakly nonlinear to the turbulence regime.
The dimensionless Rayleigh number
 $\mathit{Ra}=g{\it\alpha}{\rm\Delta}TH^{3}/({\it\nu}{\it\kappa})$
describes the thermal driving. It contains the acceleration due to gravity,
 $g$
, the thermal expansion coefficient at constant pressure,
 ${\it\alpha}$
, the outer sustained temperature difference across the layer,
 ${\rm\Delta}T$
, and the height of the layer (or convection cell),
 $H$
. The kinematic viscosity of the fluid
 ${\it\nu}$
and the thermal diffusivity
 ${\it\kappa}$
of the temperature field form the second important dimensionless parameter which relates dissipation in the working fluid to thermal diffusion, the Prandtl number
 $\mathit{Pr}={\it\nu}/{\it\kappa}$
. Turbulence is characterized by an irregular, stochastic and three-dimensional fluid motion. Does this, however, imply that the patterns for velocity and temperature, which are documented in the SDC regime at lower Rayleigh number, disappear? If not, how can these patterns be extracted? How robust are they with respect to variations of the Prandtl number? And finally, how robust are they with respect to an additional sidewall forcing which is added to the momentum equation? These are the questions which we want to address in the present work.
Our investigation is based on three-dimensional direct numerical simulations (DNS) in very large-aspect-ratio cells, which are comparable to laboratory experiments in pattern formation (Bodenschatz et al.
Reference Bodenschatz, Pesch and Ahlers2000). We conducted a series of DNS of the Boussinesq equations in cylindrical cells with an aspect ratio of
 ${\it\Gamma}=D/H=50$
with
 $D$
being the diameter of the cell. Our investigation extends previous numerical studies of turbulent Rayleigh–Bénard convection by Hartlep, Tilgner & Busse (Reference Hartlep, Tilgner and Busse2005), von Hardenberg et al. (Reference von Hardenberg, Parodi, Passoni, Provenzale and Spiegel2008) and Bailon-Cuba, Emran & Schumacher (Reference Bailon-Cuba, Emran and Schumacher2010) to very large aspect ratios
 ${\it\Gamma}$
(see also Chillà & Schumacher Reference Chillà and Schumacher2012). We show that patterns very similar to SDC continue to exist into the soft turbulence regime, up to Rayleigh numbers
 $\mathit{Ra}=500\,000$
, which were accessible here. The patterns are covered by an increasing amplitude of velocity fluctuations and become visible only after time averaging over a sequence of flow snapshots. We then determine turbulent viscosities,
 ${\it\nu}_{\ast }$
, and diffusivities,
 ${\it\kappa}_{\ast }$
, for the time-averaged roll patterns and define turbulent Rayleigh and Prandtl numbers for the mean flow patterns. That means we make the replacements
 $$\begin{eqnarray}\mathit{Ra}\rightarrow \mathit{Ra}_{\ast }=\frac{g{\it\alpha}{\rm\Delta}TH^{3}}{{\it\nu}_{\ast }{\it\kappa}_{\ast }}\ll \mathit{Ra}\quad \text{and}\quad \mathit{Pr}\rightarrow \mathit{Pr}_{\ast }=\frac{{\it\nu}_{\ast }}{{\it\kappa}_{\ast }}\sim \mathit{O}(1).\end{eqnarray}$$
These turbulent Rayleigh numbers are significantly smaller than the original ones and fall consistently back into a range that corresponds with the original SDC regime. The turbulent Prandtl numbers decrease as well and remain smaller than one. The value of
 $\mathit{Pr}_{\ast }$
depends weakly on
 $\mathit{Pr}$
. It increases with increasing
 $\mathit{Pr}$
.
2. Numerical model
We perform DNS of the three-dimensional Boussinesq equations which are given by
 $$\begin{eqnarray}\displaystyle & \displaystyle \frac{\partial u_{i}}{\partial t}+u_{j}\frac{\partial u_{i}}{\partial x_{j}}=-\frac{1}{{\it\rho}_{0}}\frac{\partial p}{\partial x_{i}}+{\it\nu}\frac{\partial ^{2}u_{i}}{\partial x_{j}^{2}}+{\it\alpha}g(T-T_{0}){\it\delta}_{3i}+f_{i}, & \displaystyle\end{eqnarray}$$
 $$\begin{eqnarray}\displaystyle & \displaystyle \frac{\partial u_{j}}{\partial x_{j}}=0, & \displaystyle\end{eqnarray}$$
 $$\begin{eqnarray}\displaystyle & \displaystyle \frac{\partial T}{\partial t}+u_{j}\frac{\partial T}{\partial x_{j}}={\it\kappa}\frac{\partial ^{2}T}{\partial x_{j}^{2}}, & \displaystyle\end{eqnarray}$$
 $p(x_{k},t)$
is the pressure,
 $u_{i}(x_{k},t)$
the velocity field,
 ${\it\rho}_{0}$
the constant mass density, and
 $T(x_{k},t)$
the temperature field. The temperature
 $T_{0}$
is a reference temperature. Summation is applied over index
 $j$
in (2.1)–(2.3), where
 $i,j,k=1,2,3$
. The last term on the right-hand side of (2.1), which is denoted by
 $f_{i}(x_{k},t)$
, stands for an additional volume forcing. It is applied close to the sidewalls of the convection cell and designed such that it enforces the azimuthal symmetry in the vicinity of the sidewalls. This additional forcing is applied for two runs only, which are discussed in § 3.3.
The velocity field has a no-slip boundary condition on all walls. The temperature boundary condition is isothermal at the top and bottom plates and adiabatic at the sidewall. The problem is formulated in cylindrical coordinates
 $(r,{\it\phi},z)$
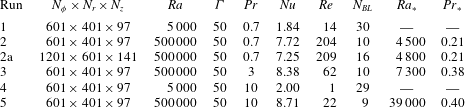
and solved by a second-order finite difference scheme (Verzicco & Camussi Reference Verzicco and Camussi2003). In table 1, we list the simulation parameters and grid resolutions for each DNS run. The azimuthal spacing (
 ${\it\Delta}_{{\it\phi}}$
) is uniform, the radial (
 ${\it\Delta}_{r}$
) and axial (
 ${\it\Delta}_{z}$
) grid sizes are non-uniform. The radial mesh gets finer towards the sidewall. It is obtained by a geometric scaling relation which clusters the grid points less than Tchebychev collocation points when the sidewall is approached,
 $r\rightarrow D/2$
. This also means that azimuthal grid spacing
 $r{\it\Delta}_{{\it\phi}}$
increases for increasing
 $r$
. The grid resolution in a cylindrical cell with very large aspect ratio presents a challenge for the simulations, in particular in terms of the azimuthal resolution. Following Grötzbach (Reference Grötzbach1983), we tested our DNS grid by calculating the global maximum of the geometric mean,
 $\tilde{{\it\Delta}}=\max ((r{\it\Delta}_{{\it\phi}}{\it\Delta}_{r}{\it\Delta}_{z})^{1/3})$
. The criterion states that
 $\tilde{{\it\Delta}}\leqslant {\rm\pi}{\it\eta}_{K}$
, where
 ${\it\eta}_{K}$
is the Kolmogorov dissipation length (see also Emran & Schumacher Reference Emran and Schumacher2008 and Shishkina et al.
Reference Shishkina, Stevens, Grossmann and Lohse2010). The ratio
 $\tilde{{\it\Delta}}/{\it\eta}_{K}$
is 2.7 for run 2 in table 1 and 1.7 for comparison run 2a at a higher resolution. Turbulent heat and momentum transfer, defined below, are also compared in table 1.
Parameters of the different simulations. The column
 $N_{BL}$
displays the number of grid points inside the thermal boundary layer. The last two columns display the turbulent Rayleigh and Prandtl numbers, respectively, analysed for selected runs. Run 2a is conducted at a higher grid resolution than run 2.

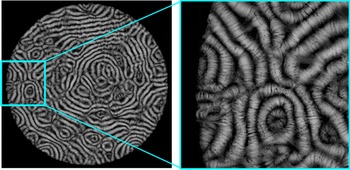
Streamlines of the velocity field (view from the top) and contours of the temperature field in a Rayleigh–Bénard convection cell. (a) Instantaneous velocity field pattern at
 $\mathit{Ra}=5000$
and (b) magnification, both taken from run 1 in table 1. (c) Corresponding temperature field in mid-plane. (d,e) Instantaneous streamline plot and its magnification at
 $\mathit{Ra}=500\,000$
. (f) Corresponding temperature field in mid-plane. (g,h) Streamline plot of the time-averaged velocity field at
 $\mathit{Ra}=500\,000$
and magnification. (i) Corresponding time-averaged temperature field in mid-plane. The time average in (g)–(i) is taken over
 ${\it\tau}=200T_{f}$
. Panels (d)–(i) are for run 2 from table 1. All data are for
 $\mathit{Pr}=0.7$
. The yellow boxes in (b) and (h) highlight defects in the patterns.

All runs start with the diffusive equilibrium state which is perturbed randomly. Length scales are normalized in units of
 $H$
, velocities in units of the free-fall velocity
 $U_{f}=\sqrt{g{\it\alpha}{\rm\Delta}TH}$
, time in units of the free-fall time
 $T_{f}=H/U_{f}$
and temperatures in units of
 ${\rm\Delta}T$
. The turbulent heat and momentum transport are measured by the Nusselt and Reynolds numbers, respectively. They are given by
 $$\begin{eqnarray}\mathit{Nu}=1+\sqrt{\mathit{Ra }\mathit{ Pr}}\langle \tilde{u} _{z}\tilde{T}\rangle _{V,t},\quad \mathit{Re}=\sqrt{\frac{\mathit{Ra }}{\mathit{Pr}}\langle \tilde{u} _{i}^{2}\rangle _{V,t}}.\end{eqnarray}$$
The notation
 $\langle \cdot \rangle _{V,t}$
stands for an ensemble average taken as a volume–time average in the DNS case. From here on, we will omit the tilde for dimensionless quantities.
3. Results
3.1. Observations
Figure 1 shows a sequence of three-dimensional streamline plots viewed from the top for
 $\mathit{Pr}=0.7$
and
 ${\it\Gamma}=50$
. Figure 1(a) and a magnification in figure 1(b) are for
 $\mathit{Ra}=5000$
. For this Rayleigh number value almost no difference was found between an instantaneous snapshot and the time average, which is taken over 100
 $T_{f}$
and not shown in the figure. The corresponding temperature pattern is displayed in figure 1(c). Figure 1(d) and its magnification (figure 1
e) display an instantaneous streamline plot at
 $\mathit{Ra}=500\,000$
. Both figures reflect the large amplitude of turbulent fluctuations. The fluctuating nature of the temperature field is also obvious in figure 1(f). The snapshots appear at a first glance almost featureless. Figures 1(g)–1(i) show the time averages, which are obtained for a duration of
 $200T_{f}$
. The temperature plots (figures 1
f and 1
i) recapture patterns which have been discussed in Hartlep et al. (Reference Hartlep, Tilgner and Busse2005) for similar Rayleigh and Prandtl numbers in rectangular slabs with
 ${\it\Gamma}=10$
. This holds particularly in the centre of the convection cell. The magnified view of figure 1(g) shown in figure 1(h) confirms the well-known result that the mean flow rolls end up perpendicular to the sidewall, which underlines that the grid resolution is sufficient.
The time-averaged plots (figures 1
g–1
i) recapture patterns that are similar to SDC, i.e. to those which are observed in figures 1(a)–1(c) for a Rayleigh number that is two orders of magnitude smaller. A time average taken over
 ${\it\tau}$
has to be long enough such that the turbulent fluctuations in the velocity field are suppressed
 $({\it\tau}\gg T_{f})$
. However, if the averaging procedure proceeds over a very long time interval then these patterns will be washed out for all Rayleigh numbers discussed here. We can decompose the velocity and temperature fields into a time-averaged field and remaining turbulent fluctuations as
 $$\begin{eqnarray}u_{i}(x_{j},t)=\langle u_{i}(x_{j})\rangle _{t}+u_{i}^{\prime }(x_{j},t)\quad \text{and}\quad T(x_{j},t)=\langle T(x_{j})\rangle _{t}+T^{\prime }(x_{j},t),\end{eqnarray}$$
where
 $\langle \cdot \rangle _{t}$
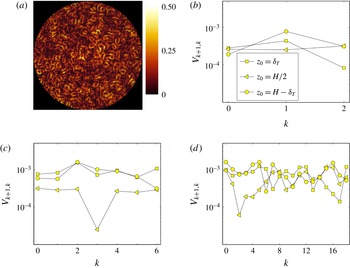
denotes a time average. In figure 2, we analyse the slow drift of the large-scale flow pattern. The total integration time interval,
 $T=M{\it\tau}$
, is divided into
 $M$
equidistant subintervals
 $\mathscr{I}_{k}$
with
 $k=0,M-1$
. These averaging intervals are taken from
 $k{\it\tau}$
to
 $(k+1){\it\tau}$
with
 ${\it\tau}\gg T_{f}$
. Figure 2(a) shows the magnitude of the difference between two successive mean flow patterns taken at
 $z_{0}=H/8$
. We see that pointwise differences get as high as
 $0.5U_{f}$
in this example. Figures 2(b)–2(d) show a measure for the drift of the mean flow patterns, which is defined as
 $$\begin{eqnarray}V_{k+1,k}(z_{0})=|\langle u_{i}(z_{0})\rangle _{A,t\in \mathscr{I}_{k+1}}-\langle u_{i}(z_{0})\rangle _{A,t\in \mathscr{I}_{k}}|.\end{eqnarray}$$
The notation
 $\langle \cdot \rangle _{A,t}$
stands for a plane–time average. Run 2 is continued for
 $400T_{f}$
and this time interval is split into fractions of
 ${\it\tau}=20T_{f},50T_{f}$
and
 $100T_{f}$
, respectively. While for
 ${\it\tau}=100T_{f}$
the drift velocities in all three planes shown are of the same size, the data for the two smaller
 ${\it\tau}$
imply that the drift in the centre-plane is in parts slightly slower. For averaging times
 ${\it\tau}\lesssim 20T_{f}$
we reach the range of typical turnover times of a Lagrangian tracer within a large-scale circulation roll (Emran & Schumacher Reference Emran and Schumacher2010). Therefore, we do not consider smaller time intervals
 ${\it\tau}$
. In all three plots, we detect nearly the same magnitude of the drift velocity. This allows us to derive a time scale of the processes which is
 $H/V_{k+1,k}\gtrsim 10^{3}T_{f}$
, a large time scale which is not accessible in this study. This time scale is comparable to that of the slow spanwise drift of streaky structures in plane Poiseuille flow which has been reported very recently by Kreilos, Zammert & Eckhardt (Reference Kreilos, Zammert and Eckhardt2014). This estimate is also consistent with the one for a time scale of horizontal motion,
 $T_{h}$
, that should vary as
 $T_{h}={\it\Gamma}^{2}T_{f}$
. Furthermore, we observe that the drift velocities for planes at
 $z={\it\delta}_{T},\,H/2$
and
 $H-{\it\delta}_{T}$
are of same order of magnitude. This suggests that the mean flow roll pattern drifts slowly as a whole.
Determination of the drift between two successive mean flow patterns in order to quantify the slow variation. (a) Magnitude of the difference between two successive mean flow patterns taken at
 $z_{0}=H/8$
with
 ${\it\tau}=50T_{f}$
. (b–d)
 $V_{k+1,k}(z_{0})$
versus averaging interval
 $k$
taken at three different
 $z_{0}$
which are indicated in the legend and the same for all three panels. Data are for run 2 in table 1. (b)
 ${\it\tau}=100T_{f}$
, (c)
 ${\it\tau}=50T_{f}$
, (d)
 ${\it\tau}=20T_{f}$
.

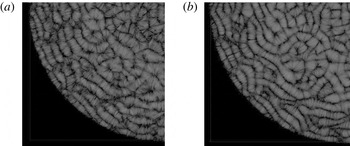
Figure 3 repeats the analysis at
 $\mathit{Pr}=10$
and
 $\mathit{Ra}=500\,000$
. Now, the streamlines of the snapshot appear much less disordered than for
 $\mathit{Pr}=0.7$
. Consequently, the difference with the mean flow pattern is much smaller. One reason could be that the thermal diffusion is less compared to the momentum diffusion when the Prandtl number grows for a fixed Rayleigh number. This results in thermal plumes which have thinner stems and disperse less rapidly with respect to time. Thus the stirring of the fluid by plumes is less efficient. The result is in line with the decrease of the Reynolds number for growing Prandtl number as shown in table 1. Our finding is also supported by Silano, Sreenivasan & Verzicco (Reference Silano, Sreenivasan and Verzicco2010) who have observed decreasing peak velocities for increasing
 $\mathit{Pr}$
.
Streamline plots of the velocity field in the Rayleigh–Bénard convection cell at
 $\mathit{Ra}=500\,000$
and
 $\mathit{Pr}=10$
. A view from the top onto a quarter of the cell is displayed. (a) Instantaneous streamline snapshot. (b) Time-averaged streamline plot obtained for averaging over
 ${\it\tau}=50T_{f}$
. Data are from run 5 in table 1.

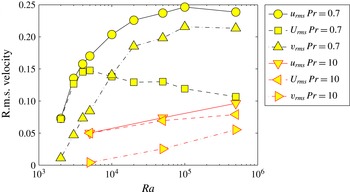
In figure 4, we summarize the results of the Reynolds-decomposed velocity field (see the decomposition in (3.1)). In detail, we define
 $$\begin{eqnarray}u_{rms}=\sqrt{\langle u_{i}^{2}\rangle _{V,t}},\quad U_{rms}=\sqrt{\langle \langle u_{i}\rangle _{t}^{2}\rangle _{V}},\quad v_{rms}=\sqrt{\langle u_{i}^{\prime \,2}\rangle _{V,t}}.\end{eqnarray}$$
We include further runs at the same resolution which are not listed in table 1, but given in the caption. The smallest Rayleigh number was
 $\mathit{Ra}=2000$
for
 $\mathit{Pr}=0.7$
which is slightly larger than the linear instability threshold,
 $\mathit{Ra}_{c}=1708$
. When expressed as a distance from the linear instability threshold this gives
 ${\it\varepsilon}=(\mathit{Ra}-\mathit{Ra}_{c})/\mathit{Ra}_{c}=0.17$
. In this case, velocity fluctuations are practically absent; the flow pattern is almost steady, consisting of several subdomains with stripe textures. With increasing Rayleigh number, fluctuations of all three components of the velocity field (see (3.3)) grow up to
 $\mathit{Ra}\approx 5000$
which corresponds to
 ${\it\varepsilon}=(\mathit{Ra}-\mathit{Ra}_{c})/\mathit{Ra}_{c}=1.93$
. At about this Rayleigh number,
 $U_{rms}$
reaches a local maximum and starts to decrease with increasing Rayleigh number. At
 $\mathit{Ra}\approx 10\,000$
, the turbulent fluctuations
 $v_{rms}$
exceed
 $U_{rms}$
. At
 $\mathit{Ra}\sim 100\,000$
,
 $u_{rms}$
and
 $v_{rms}$
reach a local maximum and level off. For this Rayleigh number, the flow is already turbulent; the fluctuations
 $v_{rms}$
are a factor of two larger than
 $U_{rms}$
. We also show three data sets for the case of
 $\mathit{Pr}=10$
. The magnitudes of all three components are significantly reduced, which confirms our observation from figure 3. Up to the highest accessible
 $\mathit{Ra}=500\,000$
all three terms continue to grow, suggesting that the maxima are shifted to higher
 $\mathit{Ra}$
.
Root mean square values of the total velocity, the time-averaged velocity and the remaining turbulent fluctuations as a function of Rayleigh number
 $\mathit{Ra}$
(see (3.3)). Additional data points beside those listed in table 1 are given at
 $\mathit{Ra}=2000,3000,4000,10\,000,20\,000,50\,000$
and 100 000 for the series at
 $\mathit{Pr}=0.7$
and
 $\mathit{Ra}=50\,000$
for
 $\mathit{Pr}=10$
.

3.2. Estimate of turbulent viscosity and diffusivity
The next step is to estimate the turbulent viscosities and diffusivities in the bulk of the cell and to evaluate the resulting turbulent Rayleigh and Prandtl numbers. We start with the Boussinesq ansatz for the closure which connects turbulent fluxes (or stresses) with the mean gradients (see e.g. Wilcox Reference Wilcox2006 and Shams et al. Reference Shams, Roelofs, Baglietto, Lardeau and Kenjeres2014) and states that
 $$\begin{eqnarray}\overline{u_{i}^{\prime }u_{j}^{\prime }}=-{\it\nu}_{\ast }^{ijkl}\frac{\partial \overline{u}_{l}}{\partial x_{k}},\quad \overline{u_{i}^{\prime }T^{\prime }}=-{\it\kappa}_{\ast }^{ij}\frac{\partial \overline{T}}{\partial x_{j}},\end{eqnarray}$$
where bars denote an appropriate space–time average. Our following estimate will aim at obtaining the numbers
 ${\it\nu}_{\ast }$
and
 ${\it\kappa}_{\ast }$
rather than exploring the full tensorial structure of the turbulent viscosities and diffusivities. This would go beyond the scope of this work. We will restrict the analysis to the dominant contributions only.
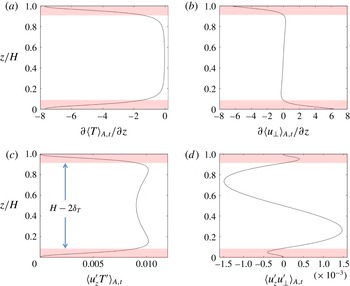
In the case of the turbulent diffusivity, we focus on the vertical transport of heat from the hot bottom plate to the cold top plate. The comparison of the three convective fluxes shows that the magnitude of the mean vertical flux is the largest. The turbulent diffusivity,
 ${\it\kappa}_{\ast }$
, can be obtained by the following bulk average:
 $$\begin{eqnarray}\int _{{\it\delta}_{T}}^{1/2}\langle u_{z}^{\prime }T^{\prime }(z)\rangle _{A,t}\,\text{d}z=-{\it\kappa}_{\ast }\int _{{\it\delta}_{T}}^{1/2}\frac{\partial \langle T(z)\rangle _{A,t}}{\partial z}\,\text{d}z.\end{eqnarray}$$
Time–plane averages are denoted by
 $\langle \cdot \rangle _{A,t}$
. Figure 5 displays the resulting profiles which enter the determination of
 ${\it\kappa}_{\ast }$
via (3.5). The double-headed arrow indicates the bulk region in the figure.
Vertical profiles of the plane- and time-averaged correlations and derivatives which are required to determine the turbulent viscosity and diffusivity. Data displayed in the figure are obtained for
 $\mathit{Ra}=500\,000$
and
 $\mathit{Pr}=0.7$
.

In the case of the momentum transport the determination is less straightforward. We can expect that the horizontal turbulent mixing is also important. However, first, we proceed similarly to the temperature field. We take the magnitude of horizontal velocity
 $\boldsymbol{u}_{\bot }(r,{\it\phi},z,t)=u_{r}(r,{\it\phi},z,t)\boldsymbol{e}_{r}+u_{{\it\phi}}(r,{\it\phi},z,t)\boldsymbol{e}_{{\it\phi}}$
. This field is decomposed again into a temporal mean and remaining fluctuations. The turbulent viscosity,
 ${\it\nu}_{\ast }$
, is determined in a similar way as the turbulent diffusivity
 $$\begin{eqnarray}\int _{{\it\delta}_{T}}^{1/2}\langle u_{z}^{\prime }u_{\bot }^{\prime }(z)\rangle _{A,t}\,\text{d}z=-{\it\nu}_{\ast }\int _{{\it\delta}_{T}}^{1/2}\frac{\partial \langle u_{\bot }(z)\rangle _{A,t}}{\partial z}\,\text{d}z.\end{eqnarray}$$
Here
 $u_{\bot }^{\prime }$
and
 $u_{\bot }$
denote magnitudes. The resulting profiles that enter (3.5) and (3.6) are displayed in figure 5(b,d). In table 1 we summarize the turbulent Rayleigh and Prandtl numbers which result from this closure procedure. The turbulent Rayleigh numbers,
 $\mathit{Ra}_{\ast }$
, are reduced for all three cases.
 $\mathit{Ra}_{\ast }$
gets consistently smaller with decreasing Prandtl number
 $\mathit{Pr}$
since the amplitude of the turbulent fluctuations increases. We obtain
 $\mathit{Pr}_{\ast }<\mathit{Pr}$
for all three cases. Their magnitudes vary between 0.2 and 0.4. The turbulent Prandtl number
 $\mathit{Pr}_{\ast }$
increases slightly with increasing
 $\mathit{Pr}$
.
In the case of runs 2 and 5, we then conducted a DNS with viscosity and diffusivity equal to the values of
 ${\it\nu}_{\ast }$
and
 ${\it\kappa}_{\ast }$
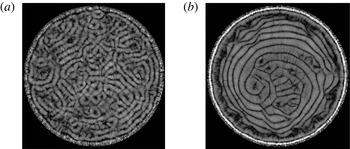
, respectively. The resulting streamline pattern for run 2 is displayed in figure 6. A time average over
 $200T_{f}$
was applied at
 $\mathit{Pr}=0.2$
and
 $\mathit{Ra}=4500$
. This flow structure can be compared with the time-averaged one from figure 1(g,h) and indeed a reasonable visual agreement of both large-scale patterns is found. We determined the Betti numbers
 $\{b_{0},b_{1}\}$
from two-dimensional horizontal cuts of the mean temperature at
 $z=1/2$
in both cases (Kurtuldu, Mischaikow & Schatz Reference Kurtuldu, Mischaikow and Schatz2011). Betti numbers are
 $d$
positive integers to characterize a
 $d$
-dimensional set topologically. In detail,
 $b_{0}$
is the number of connected filaments which is obtained by digitizing a greyscale picture at a threshold, and
 $b_{1}$
counts the number of enclosed holes in the pattern. We choose the temperature field in the mid-plane. A threshold temperature
 $T=0.5$
results in Betti number pairs which are listed in table 2 for runs 2 and 5 as well as those corresponding to
 $\mathit{Ra}_{\ast }$
and
 $\mathit{Pr}_{\ast }$
. Additionally, we estimated the average width of the rolls by counting the mean number of rolls that fit into the cell along different orientations. The values vary around a width of
 $2H$
, but are not exactly equal.
Streamline plots of the velocity field in a Rayleigh–Bénard convection cell as a view from the top. (a) Plot averaged for
 $200T_{f}$
. (b) Magnification of the same data. The DNS was conducted for
 $\mathit{Ra}=4500$
,
 $\mathit{Pr}=0.2$
which corresponds with the turbulent viscosities and diffusivities for the time-averaged data in figure 1(g,h).

Betti numbers
 $b_{0}$
and
 $b_{1}$
for the original simulations at
 $\mathit{Ra}$
and
 $\mathit{Pr}$
as well as
 $b_{0}^{\ast }$
and
 $b_{1}^{\ast }$
for the corresponding runs at
 $\mathit{Ra}_{\ast }$
and
 $\mathit{Pr}_{\ast }$
. The run number corresponds with table 1. Temperature patterns at mid-plane have been analysed.

We also determined the turbulent viscosities from horizontal turbulent diffusion processes. It turns out that a simple adaption of the averaging procedure of (3.5) and (3.6) to a radial dependence is not successful. The roll patterns cause radially oscillating profiles which result in strong cancellations for the averaged turbulent stresses and mean strain rates. If we omit the radial averaging and analyse the local Boussinesq relation
 $\langle u_{r}^{\prime }u_{j}^{\prime }(z)\rangle _{{\it\phi},H-2{\it\delta}_{T},t}=-{\it\nu}_{\ast }(r)\partial \langle u_{j}(r)\rangle _{{\it\phi},H-2{\it\delta}_{T},t}/\partial r$
for
 $j=r,{\it\phi},z$
, we do indeed get turbulent Prandtl numbers which are locally closer to one, but vary significantly with
 $r$
.
The resulting
 $\mathit{Ra}_{\ast }$
and
 $\mathit{Pr}_{\ast }$
are such that the DNS yield time-dependent patterns, in particular for run 5 with
 $\mathit{Ra}_{\ast }=39\,000$
and
 $\mathit{Pr}_{\ast }=0.4$
. We therefore repeated this ‘renormalization procedure’ in the weakly nonlinear regime and obtain
 $\mathit{Ra}_{\ast \ast }=3000$
and
 $\mathit{Pr}_{\ast \ast }=0.13$
for run 2 and
 $\mathit{Ra}_{\ast \ast }=1800$
and
 $\mathit{Pr}_{\ast \ast }=0.17$
for run 5, respectively. Both runs thus end in the convection regime close to the onset.
To summarize this section, all routes of analysis will in general not lead to turbulent Prandtl numbers
 $\mathit{Pr}_{\ast }\approx 1$
. A turbulent Prandtl number smaller than unity can be interpreted as follows: plume filaments of the temperature are coarser and diffuse faster than vortex filaments next to them. This circumstance could be connected to the fact that the width of rising and falling plumes is of the size of the thermal boundary layer thickness which is rather large for our
 $\mathit{Ra}$
. In contrast, vorticity is frequently generated on finer scales. Vortex filaments are for example generated by locally reversed flows next to rising plumes, a consequence of incompressibility. An increase of the Rayleigh number to very large values could then increase the turbulent Prandtl number to one since the typical flow structures are getting finer and the boundary layers themselves are expected to eventually become fully turbulent.
At this point, it should also be mentioned that the particular magnitude of turbulent Prandtl numbers,
 $\mathit{Pr}_{\ast }$
, is still an open problem. For example, Spiegel (Reference Spiegel1971), Kays (Reference Kays1994) and Grötzbach (Reference Grötzbach2011) discuss the dependence of
 $\mathit{Pr}_{\ast }$
on the distance from walls or on the original
 $\mathit{Pr}$
. In the case of homogeneous isotropic turbulence, Nakano et al. (Reference Nakano, Fukushima, Unno and Kondo1979) derived a value of
 $\mathit{Pr}_{\ast }=0.4$
from a spectral formulation based on the classical Kolmogorov turbulence theory.
3.3. Robustness of large-scale mean flow patterns to additional sidewall forcing
The sensitivity of SDC patterns to sidewall effects and suppressed mean flows has been discussed in Bodenschatz et al. (Reference Bodenschatz, de Bryun, Ahlers and Cannell1991) and Chiam et al. (Reference Chiam, Paul, Cross and Greenside2003), respectively. This motivates us here, also in view of spontaneous symmetry breaking, to study their robustness with respect to the addition of a volume forcing to (2.1). The forcing is set up such that it sustains a steady Lamb–Oseen-type vortex
 $\hat{U} _{i}(r,z)$
, with
 $i=\{r,z\}$
, very close to the sidewalls of the cell at
 $(r_{0}=({\it\Gamma}-1)/2,z_{0}=1/2)$
. This vortex generates an azimuthally symmetric mean flow at the sidewall. The circulation,
 ${\it\Omega}$
, and the radius of the vortex core,
 $r_{L}$
, are chosen such that no-slip boundary conditions can still be satisfied by setting this flow to zero below a certain threshold. This clearly prohibits a stronger variation of the amplitudes and thus of the strength of the additional forcing.
Incompressibility of the full velocity field is sustained via the solution of the Poisson problem for the pressure in each time step. Figure 7 shows the results for the mean flow pattern. In the case of
 $\mathit{Pr}=0.7$
, the toroidal roll is clearly visible right at the sidewall. A second roll next to the sidewalls can be established by the additional forcing term. Towards the centre of the convection cell the mean pattern remains unchanged, however, as can be seen by a comparison with figure 1(g,h). The turbulent fluctuations are large enough to re-establish the mean flow pattern. This is different for
 $\mathit{Pr}=10$
(figure 7
b). In comparison to figure 3, the pattern has changed significantly. The toroidal roll pattern of the time-averaged velocity is continued almost to the centre of the cell. The reason for the stronger impact of the additional sidewall forcing lies in the significantly lower level of turbulent fluctuations which we documented in figure 4.
Streamline plots of the velocity field in a Rayleigh–Bénard convection cell as a view from the top for
 $\mathit{Ra}=500\,000$
with the additional forcing
 $f_{i}$
(see also (2.1)). (a)
 $\mathit{Pr}=0.7$
. (b)
 $\mathit{Pr}=10$
. Both data sets have been averaged over
 $150T_{f}$
. We took
 ${\it\Omega}=1$
for the (non-dimensional) circulation and
 $r_{L}=0.01$
for the (non-dimensional) radius of the vortex core.

4. Summary
We have presented three-dimensional DNS of thermal convection in the soft turbulence regime to study time-averaged velocity field patterns and their dependence on the Prandtl number in very large-aspect-ratio convection cells. Our DNS demonstrate clearly that the SDC patterns, which are known from the weakly nonlinear regime, continue to exist in the turbulent regime. They remain thus dynamically relevant and do not simply disappear when convection turns into the turbulent regime. The patterns are revealed when the turbulent fluctuations are removed by time averaging over intervals of the order of
 $10^{2}T_{f}$
, which is significantly smaller than the time scale over which the mean velocity and temperature patterns evolve. Our simulations allow us to calculate the turbulent viscosities and diffusivities as well as related turbulent Rayleigh and Prandtl numbers,
 $\mathit{Ra}_{\ast }$
and
 $\mathit{Pr}_{\ast }$
. Their values do indeed fall back into the range of the original SDC regime. The turbulent Prandtl numbers
 $\mathit{Pr}_{\ast }$
vary between 0.2 and 0.4 and increase with increasing
 $\mathit{Pr}$
. Our studies showed also that the mean patterns are robust to finite-amplitude perturbations once the turbulent fluctuations in the flow are sufficiently large, i.e. once
 $\mathit{Pr}$
at a given
 $\mathit{Ra}$
is sufficiently small. We demonstrated this by a sidewall forcing that sustained an azimuthally symmetric vortex.
Three areas of future study are implied, in our view. (i) It should be investigated systematically if the mean flow patterns which are similar to SDC persist to even higher Rayleigh numbers or if the mean flow structure is changed. This would require numerical studies at high Rayleigh numbers and large aspect ratios. (ii) A more detailed analysis of the turbulent viscosities and diffusivities for larger Rayleigh numbers will provide useful input for technological and astrophysical applications in which the small-scale convective turbulence has to be modelled. This would however imply the need to explore systematically the tensorial nature of the turbulent viscosity, which we did not analyse in the present work. (iii) Our results could also provide useful input to help reduce the degrees of freedom systematically and to derive some effective equations for the large-scale patterns, as done in other systems (Malecha, Chini & Julien Reference Malecha, Chini and Julien2014).
Acknowledgements
This work is supported by the Deutsche Forschungsgemeinschaft. Part of this work was completed while one of us (J.S.) stayed at the Institute of Pure and Applied Mathematics (IPAM) at the University of California Los Angeles. He thanks IPAM and the US National Science Foundation for financial support. Helpful comments by J. D. Scheel and discussions with J. Aurnou, E. Bodenschatz, F. Busse, G. Chini, and K. Julien are acknowledged.