Introduction
The connections between poverty and food insecurity are long established (Rowntree, Reference Rowntree1901; Dowler, Reference Dowler2002). In the UK, stagnating incomes, rising costs of living and, from 2007–2012, the rising price of many foods, have made food less affordable, especially for lower income households (Defra, 2015). Whilst there is evidence that the impacts of the global financial crisis and changing social policy, including welfare reform, have hit UK households with children harder than those without (De Agostini et al., Reference De Agostini, Hills and Sutherland2014; Stewart, Reference Stewart2015), not enough is known about how these economic phenomena and policy changes have impacted families’ ability to feed themselves.
This article contributes to a growing literature concerned with food poverty and insecurity in the global North by identifying the types of families (households with children) at risk of food poverty in the UK. A second purpose is to consider the relative merits of this novel approach to defining and operationalising food poverty. Both of these have important implications for policies that seek to address poverty and food poverty.
The first section addresses issues of definition and measurement and introduces budget standards approaches to constructing and costing diets. This is followed by an overview of the methodology for the Joseph Rowntree Foundation's (JRF's) Minimum Income Standard food budget standard (FBS), and the analysis undertaken, that compares the FBS to actual expenditure for different families in order to answer our research questions which were: ‘which types of families/households appear not to be meeting the lower spending threshold for a socially acceptable healthy diet that allows for social participation?’ and ‘how has this changed over time?’ Results are followed by a consideration of key findings in relation to broader societal and policy contexts and reflection upon the implications of methods of measurement of food poverty and insecurity for monitoring and intervention.
Food poverty and food insecurity: concepts, definitions and measures
The definition and measurement of food poverty and insecurity are complex and vary across time and place (Maxwell, Reference Maxwell1996; Dowler et al., Reference Dowler, Kneafsey, Lambie, Inman and Collier2011; Kneafsey et al., Reference Kneafsey, Dowler, Lambie, Inman and Collier2012; O'Connor et al., Reference O'Connor, Farag and Baines2016). In the last few decades, particularly since the publication of Sen's ground-breaking study of Poverty and Famines (1981)Footnote 1, there has been a shift in focus from food availability towards food access (Maxwell, Reference Maxwell1996; Hadley and Crooks, Reference Hadley and Crooks2012; Borch and Kjaernes, Reference Borch and Kjærnes2016) that is reflected in the Food and Agriculture Organisation (FAO) (2001) definition of food security as ‘a situation that exists when all people, at all times, have physical, social and economic access to sufficient, safe and nutritious food that meets their dietary needs and food preferences for an active and healthy life’.
In the UK, in contrast to other developed economies with entrenched systems of emergency food provision such as the US and Canada, there is no accepted definition of household food poverty or insecurity and little systematic collection of ‘direct’ data. Whilst many definitions of household food insecurity, such as that adopted in 2006 by the UK's Department for Environment, Food and Rural Affairs (Defra, 2006), draw on the FAO definition, methodologies for measurement may use different approaches. For example, in the US and Canada the measurement of food insecurity at the household level uses a questionnaire, originally developed from qualitative research with food insecure households (Radimer et al., Reference Radimer, Olson and Campbell1990), that asks direct questions about experiences. Food insecurity is primarily defined, in this survey, in terms of compromised quality and quantity of food (the most severe manifestation) and worry about running out of food (the least severe) (e.g. Bickel et al., Reference Bickel, Nord, Price, Hamilton and Cook2000). Many other countries and surveys have adopted or drawn on this US Department of Agriculture (USDA) measure, including the Food Standards Agency survey, Food & You, that in 2016 included (for the first time) a module on food insecurity (FSA, 2017). Whilst these new data are welcome they suffer from a number of limitations including that there is only one wave (2016) so it is not possible to study change over time and the sample size is too small to analyse by household characteristics.
In the absence of extensive ‘direct’ information about food insecurity, researchers have carried out secondary analyses of routinely collected data on food bank usage and material deprivation. Food bank data have proved invaluable in highlighting the struggle families face in feeding themselves and in raising the profile of (food) poverty in the UK press (Wells and Caraher, Reference Wells and Caraher2014). Analyses find associations between rising emergency food aid usage and particular social policies, including benefit delays and sanctions (Loopstra et al., Reference Loopstra, Reeves, Taylor-Robinson, Barr, McKee and Stuckler2015), as well as increasing provision of food parcels to children (Lambie-Mumford and Green, Reference Lambie-Mumford and Green2015). However, since not all food insecure households access emergency food provision and not all emergency food providers collect information about their ‘clients’ in a systematic way, food bank data underestimate the extent of food poverty (Lambie-Mumford et al., Reference Lambie-Mumford, Crossley, Jensen, Verbeke and Dowler2014). Complementing this research, some studies examine an indicator of material deprivation, ability to ‘afford meat, chicken, fish (or vegetarian equivalent) every second day’, that is included in two European datasets, the EU-Survey on Income and Living Conditions (Pfeiffer et al., Reference Pfieffer, Ritter and Oestreicher2015; Loopstra et al., Reference Loopstra, Reeves, McKee and Stuckler2016) and the European Quality of Life Survey (Davis and Baumberg Geiger, Reference Davis and Baumberg Geiger2017). A consistent finding is that household food insecurity has risen over time in the UK, particularly since 2010. However, using a single indicator of material deprivation as a proxy for ‘food insecurity’ is problematic, not least because food poverty is a multidimensional phenomenon (see Loopstra et al., Reference Loopstra, Reeves, McKee and Stuckler2016: 47–8).
The next section introduces a novel strategy that we have adopted, as part of a mixed methods study of families and food poverty, to identify the types of family at risk of food poverty over time in the UK. It begins by situating this within a relative deprivation approach to poverty.
A relative deprivation approach to food poverty
Food poverty and insecurity have long been understood as dimensions and indicators of poverty (Dowler, Reference Dowler2002). For example, Seebohm Rowntree's (Reference Rowntree1901) definition of poverty, based on minimalist expectations of the time to establish a ‘scientific’ minimum income line beneath which no one could be expected to fall, included at its heart adequate food for ‘physical efficiency’. As Dowler and O'Connor (Reference Dowler and O'Connor2012: 45) note, ‘[w]ithin work on ‘poverty’ [. . .] the ability to buy or otherwise obtain enough food is an important component, however the condition is defined’. Central to the concepts of food insecurity and food poverty, then, are ‘the notion of food scarcity or deprivation in the basic need for food’ (Tarasuk, Reference Tarasuk2001: 7). However, as Peter Townsend later (Reference Townsend1954, Reference Townsend1962, Reference Townsend1979) pointed out, no one could really be expected to live on Rowntree's ‘primary poverty income’ in real life: ‘[s]ocial pressures, to drink in the local pub, to buy presents for the children, to be a normal social being especially in adversity, required a higher budget’ (Glennerster et al., Reference Glennerster, Hills, Piachaud and Webb2004: 25).
Townsend argued that people had social as well as physical needs and that these could not usefully be divided, since the ways in which seemingly ‘basic’ needs (for example for nutrition) were met served social functions (Hick, Reference Hick2014: 301). Whilst a cup of tea, for example, was nutritionally worthless, offering tea to visitors made ‘a small contribution [. . .] towards maintaining the threads of social relationships’ (1979: 50 in Hick, Reference Hick2014: 301). Townsend's relative deprivation approach to conceptualising poverty thus covered a wide range of aspects of material and social living standards. In Poverty in the United Kingdom Townsend (Reference Townsend1979) identified the levels of income below which consumption and participation fell well below what might be regarded as ordinary or acceptable in an increasingly affluent society. This group was seen to be in poverty (Lansley and Mack, Reference Lansley and Mack2015).
Food poverty, as we understand it, is about more than hunger or malnutrition, since, ‘[f]or men [sic], food acquires a series of values other those than which hunger provides’ (Richards (Reference Richards2004[1932]: 9). At one level, food provides the nutrients needed for growth and development. It plays a critical role in health and thus inequitable access to healthy food plays a role in health inequalities (Najman and Davey Smith, Reference Najman and Davey Smith2000). But food is also fundamentally meaningful, a source of pleasure, a way of expressing care, a medium of control (O'Connell and Brannen, Reference O'Connell, Knight and Brannen2014) and a means of social inclusion and exclusion. Food is intimately linked to identity: we are what we eat (Fischler, Reference Fischler1988). Furthermore, exercising choice in the marketplace, including what food to buy and eat, is one means of enacting agency in a consumer society. Research has shown that these ‘social’ dimensions of food and eating are widely included as part of consensually determined minimum socially acceptable standards of living (Davis et al., Reference Davis, Hirsch, Smith, Beckhelling and Padley2012; Padley et al., Reference Padley, Marshall, Hirsch, Davis and Valadez2015), despite evidence of adapted preferences (reduced expectations) in the context of austerity (Davis et al., Reference Davis, Hirsch, Smith, Beckhelling and Padley2012, Reference Davis, Hirsch and Padley2014). The next section describes how we have operationalised this conceptualisation to identify which UK families may be at risk of food poverty.
Identifying families at risk of food poverty in the UK
The European Research Council funded study on which this article draws, Families and Food in Hard Times, is concerned with food and poverty in families in three European countries. It is a mixed methods study that uses qualitative methods with 135 young people and their parents in low income households as well as secondary analysis of national and international quantitative data. One objective of the study is to identify which types of family in each country are at risk of food poverty.
In the UK the relative deprivation approach we have taken begins by asking what counts as a socially acceptable diet that meets needs for health and social participation and how much this costs. The analysis then compares this to actual spending on food by different family types between 2005 and 2013 to identify which families are not spending this amount and may be at risk of food poverty, and whether the types of families at risk have changed over time.
Constructing and costing a socially acceptable diet that meets needs for health and social participation
There are a number of approaches to costing a diet that is both healthy and realistic (Dowler, Reference Dowler2002). Reference budget – or budget standards – approaches may be based on the views of experts, make use of consensual methods (Davis and Padley, Reference Davis, Padley, Fee and Kober-Smith2017) or be some combination of both. Budget standards are used widely internationally both to determine levels of income support and monitor its adequacy (Storms et al., Reference Storms, Goedemé, Van den Bosch, Penne, Schuermann and Stockman2014). Budget standard calculations are therefore political and consequential because they can, and do, play a role in shaping policy, including responses to food insecurity and poverty. In the US, for example, the rate of food stamps is determined by statistical packages that calculate the cost of a healthy, socially acceptable diet (Carlson et al., Reference Carlson, Lino and Fungwe2007), though the degree to which the menus reflect ordinary shopping and eating habits is contested (Maillot et al., Reference Maillot, Darmon and Drewnowski2010)Footnote 2. Within the UK, the Minimum Income Standard (MIS), based principally on consensual methods but with consultation with experts where required, includes a food budget standard (FBS) setting out a minimum socially acceptable diet that meets social as well as nutritional needs.
The MIS, which is funded by the Joseph Rowntree Foundation and has been updated annually since 2008, calculates the income needed by a range of different household types to achieve a minimum, socially acceptable standard of living. It is based on detailed research with groups of members of the public specifying what items are needed for a minimum socially acceptable standard of living and consequently what needs to be included in a minimum household budget. The groups are augmented by expert knowledge in relation to energy use, such as electricity consumption, and food and diet. The results of the research indicate how much households require in a weekly budget and how much they need to earn in order to achieve this level of disposable income. The definition of a minimum socially acceptable standard of living at the heart of all MIS groups is that ‘it includes, but is more than just, food, clothes and shelter. It is about having what you need in order to have the opportunities and choices necessary to participate in society' (Padley and Hirsch, Reference Padley and Hirsch2016: 5). Consequently, the FBS takes account not only of the cost of spending that is essential for health but also describes what is needed for social inclusion (Oldfield and Burr, Reference Oldfield and Burr2008). It is the amount deemed necessary for a realistic, nutritious, socially acceptable diet that allows for participation in customary activities, including additional amounts for seasonal events such as Christmas and birthdays, and modestly eating out occasionally (Davis et al. Reference Davis, Hirsch and Padley2014; Padley et al., Reference Padley, Davis, Hirsch, Horsley and Valadez2017a). The standard is, then, in line with a multidimensional understanding of poverty and more realistic than that calculated by Seebohm Rowntree and some other more recent approaches to determining the cost of a diet (e.g. Nelson et al., Reference Nelson, Dick and Holmes2002: 575). Because it includes spending on social participation, the FBS is about more than physical survival and is consistent with the broader definition of food poverty adopted in this article.
The FBS is constructed during the MIS research that is based on a deliberative focus group methodology. It is put together by groups of individuals looking in detail at the needs of different household types (see Davis et al., Reference Davis, Hirsch, Smith, Beckhelling and Padley2012, Reference Davis, Hirsch and Padley2014). As a part of this process groups discuss and agree menus, for all individuals covered by the MIS research, which are reasonably healthy, practical in terms of lifestyle, and realistic in terms of preferences and ‘treats’Footnote 3. Minor adjustments to the menus by a nutritional expert are made to ensure that they are nutritionally adequate for that particular group of the population (Oldfield and Burr, Reference Oldfield and Burr2008) and the basket is costed at a national retailer, Tesco. An advantage of costing food baskets at Tesco is that as the largest supermarket chain in the UK, with a national pricing policy, there is no need to account for regional variation in urban and accessible rural locations. However, there are also limitations in using this approach, as noted in the discussion, including that some low income households are unable or do not choose to shop at mainstream supermarkets. MIS is calculated for eleven different core household compositions, seven of which are families with children.
Methodology
The key questions considered here were ‘which types of families/households appear not to be meeting the lower spending threshold for a socially acceptable healthy diet that allows for social participation, and how has this changed over time’. To answer these, the Living Costs and Food Survey (LCFSFootnote 4) was analysed in order to calculate the actual food expenditure of selected household types which was then compared to the FBS from MIS research. The LCFS, which is used in Defra's annual Family Food report (e.g. Defra, 2015), collects information on spending patterns and the cost of living that reflects household budgets across the UK, the results of which are primarily used to provide information about spending patterns for the Consumer Price Indices, and about food consumption and nutrition. It aims to achieve a sample size of approximately 6,000 households per year (ONS, 2017). We created a variable that combined data from the LCFS asking respondents about the amount spent on food and non-alcoholic drinks inside the home each week with other variables in the LCFS quantifying expenditure on food outside of the homeFootnote 5.
The FBS calculates minimum costs including food (and some alcoholic beverages) consumed inside and outside of the home, for a range of different household compositions reflecting variation in food needs according to the ages of children: the minimum food needs of a secondary school age child are, for example, very different to those of a toddler. For this analysis, and in line with MIS, a family was defined as adults with their children (not necessarily their biological children), adults being people of working age (eighteen to sixty-four). A lone parent family was defined as a family with one adult while a couple family was two adults who are either married, cohabiting or in a civil partnership. Families with two adults who were not married, cohabiting or in a civil partnership or with more than two adults were excluded from the analysis. Children were defined as individuals aged between zero and seventeen years. On this basis, families were identified as either a lone parent with one child or a lone parent with two or three children, and as couple parents with one child, two children, three children or with four children. Lone parents with more than three children and couple parents with more than four children were excluded from the analysis, as these are not currently included in the MIS research. The analysis was based on data for a series of nine years beginning before the financial crisis, in 2005, and ending with the most recent complete data currently available: that is, in 2013. All data reported here have been weighted using the ‘annual weight’ variable in the LCFS for each data year (2005-13)Footnote 6. Food expenditure over time (2005-13) was inflated using the Retail Price Index – which has also been used to provide updates to MIS budgets – to 2013 prices.
Results: exploring the food budget standard data
How has the cost of a minimum socially acceptable diet changed over time?
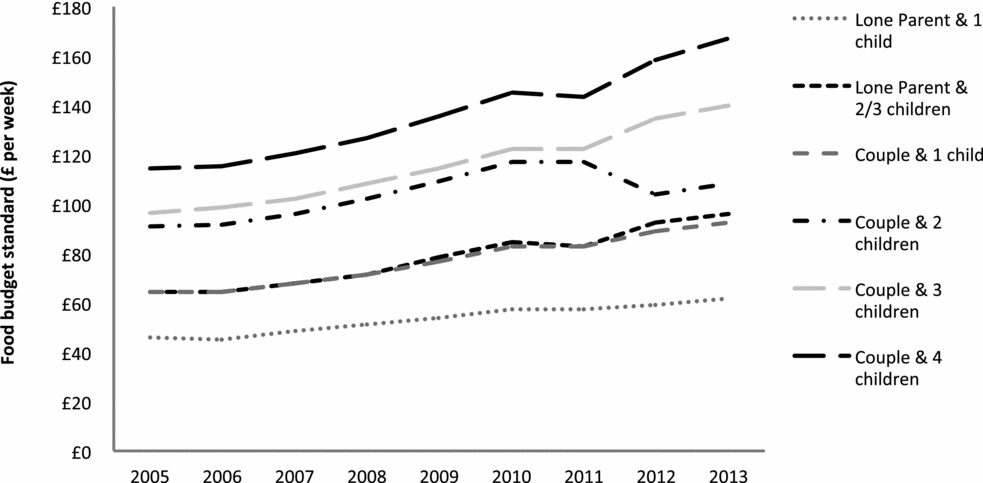
Figure 1 sets out the FBS for six different family types – all working age households with children – over the nine-year period examined in this analysis (2005 to 2013), as determined through the MIS research. This is the amount that members of the public agree each family type needs to spend each week in order to achieve a minimum nutritious, socially acceptable diet that allows for social participation. The FBS sets out what is needed by children in four age groups, covering from birth to seventeen, recognising that children of different ages have different requirements in terms of diet and nutrition. The analysis presented here has averaged the needs of children set out by the FBS in order to enable comparisons with expenditure dataFootnote 7.
Weekly Food Budget Standards for families 2005–2013
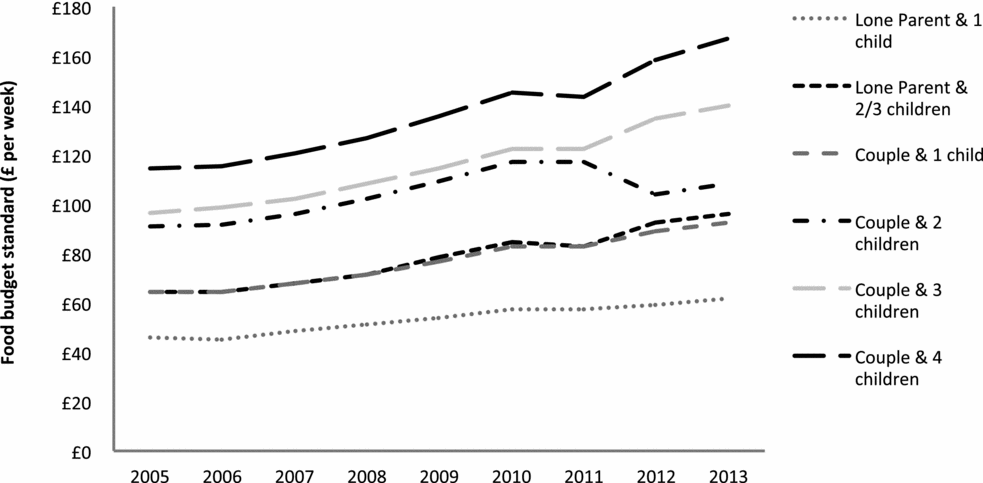
The cost of meeting households’ food needs for health and social participation has increased over time for each type of family shown here (Figure 1). But the cost of meeting the FBS has not increased in the same way for all households with children: couple parents with two children have seen the cost of meeting the FBS increase by just less than a fifth (19.1 per cent) between 2005–13 while couple parents with either three or four children have seen an increase of around 45 per cent. To put this in some context, over the same period the average increase in food prices, as measured by the Retail Prices Index, was 39 per cent.
How has food expenditure for different family types changed over time?
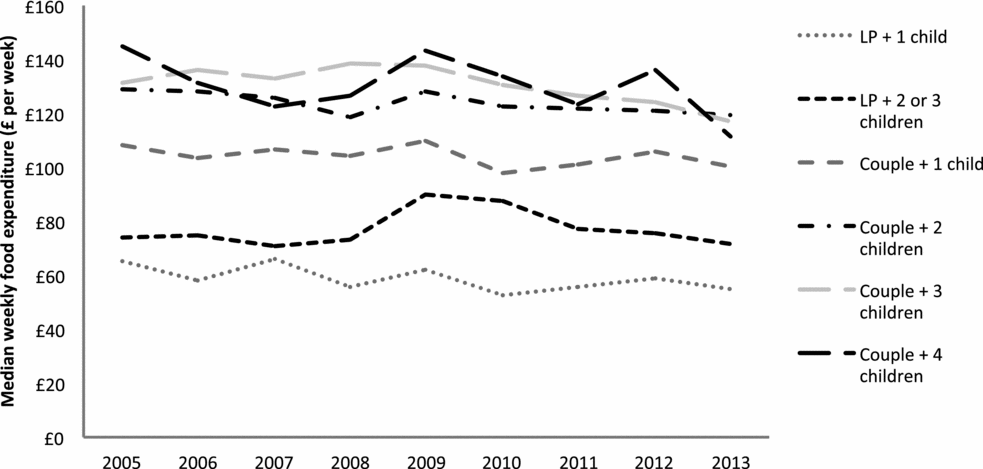
Figure 2 shows median food expenditure over time, from LCFS, inflated to 2013 prices for different types of families between 2005 and 2013.
Median weekly food expenditure for families, 2005 to 2013

Figure 2 shows that median weekly food expenditure for families peaked in 2009 and has decreased between then and 2013 for all households. In general, median food expenditure is lowest for lone parents, especially with one child, and highest for large families with two adults and three or more children.
Comparing actual expenditure with the FBS for different households
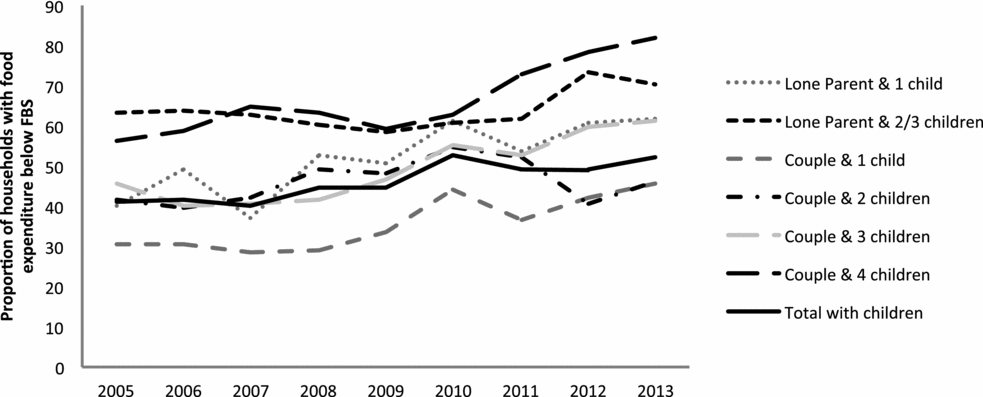
The central interest here is in looking at how actual expenditure on food compares with the FBS for households with children: that is, what proportion of the different family types are spending less on food than is needed for a diet that meets needs for health and social participation? Figure 3 shows the results of the comparison of actual expenditure on food with the FBS, as a proportion of each household type not meeting the FBS between 2005 and 2013. The proportion spending below the FBS has increased over time for all of the different family types examined here. For all families, the proportion spending below the FBS increased from 41 per cent in 2005 to 52 per cent in 2013. In other words, more than half of all families in 2013 were spending less on food than needed for a minimum nutritious socially acceptable diet that allows for social participation.
Proportion of families spending below the FBS, 2005 to 2013

Lone parents with either two or three children and couples with four children are most likely to be spending less on food than that needed to provide the FBS; 71 per cent of lone parents with two or three children and 82 per cent of couples with four children have food expenditure below the level of the FBS in 2013. The proportion of lone parents with one child spending less than the FBS on food each week has increased by more than half (54.1 per cent) between 2005 and 2013, rising from 40 to 62 per cent, while the proportion of couples with one child and couples with four children spending less than the FBS has increased by a similar order of magnitude over the same period. Although there are fluctuations in the proportion of families spending below the FBS between 2005 and 2013, it is clear that the overall pattern is one of an increasing proportion not spending what is needed for a diet that meets needs for health and social participation, defined through MIS.
That such a large proportion of all household types is spending less than the FBS –– between 30 and 82 per cent of households with children between 2005 and 2013 – is of concern, but is to be expected. In the first place ‘actual expenditure is constrained by income, whereas the MIS budgets have been derived without an income constraint’ (Bradshaw et al. Reference Bradshaw, Middleton, Davis, Oldfield, Smith, Cusworth and Williams2008: 31), that is, MIS is about establishing a publicly determined, socially acceptable threshold of need which reflects individuals’ lived realities, but is not dictated by available resources. Second, previous research has shown that food expenditure is an ‘elastic’ part of household budgets (Dowler et al., Reference Dowler, Turner and Dobson2001; Dowler, Reference Dowler2002) and in a period when the cost of other key essentials, such as fuel and housing, has also risen, it is often the food budget that is dipped into in order to pay for these other things (Tait, Reference Tait2015).
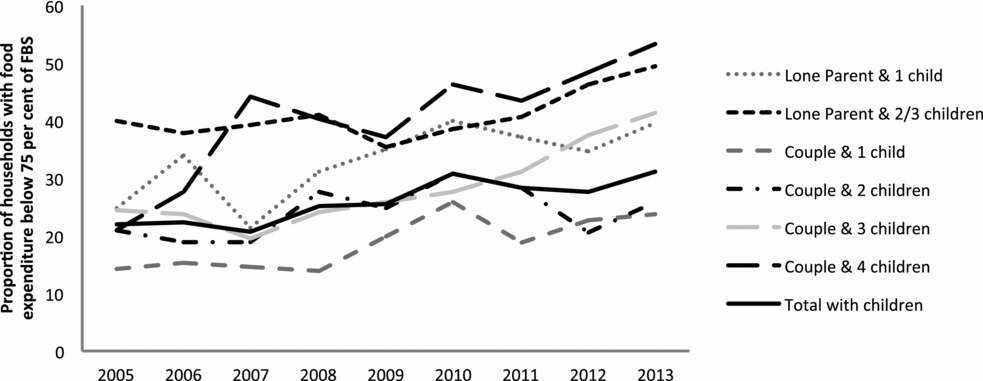
Looking at the proportion of households spending below the FBS provides an indication of the substantial number of households spending below what is needed to meet the minimum described within MIS. However, there is likely to be a qualitative difference between spending just below and well below the FBS on a weekly basis (Hill et al., Reference Hill, Davis, Hirsch and Marshall2016). Exploring the link between incomes, relative to MIS, and material and financial deprivation, Hirsch and Valadez Martinez (Reference Hirsch and Valadez Martinez2017) conclude that households with incomes below 75 per cent of that needed to reach MIS are around four times as likely to experience material or income deprivation as those with incomes above MIS. To put this another way, people with incomes below 75 per cent of MIS are falling well short of the minimum income standard, do not have the incomes needed day-to-day to cover all essentials, and may well be faced with difficult decisions regarding spending priorities. Figure 4 shows the proportions of households spending below 75 per cent of the FBS, who can be thought of as those having to make serious compromises in terms of food quality and quantity on a daily and weekly basis. The overall trend is one of an increasing proportion of households with children spending less than 75 per cent of the FBS between 2005 and 2013. Nearly a third of all households with children (31.2 per cent) were spending below this level on food in 2013, compared to just more than a fifth (21.9 per cent) in 2005. This means that around 2.2 million families were spending substantially less than the FBS on food in 2013, on a weekly basis, compared to 1.4 million in 2009. In 2013, 620,000 of these were lone parent households, compared to 470,000 in 2009.
Proportion of families spending below 75 per cent of FBS, 2005 to 2013

The risk of spending below 75 per cent of the FBS is not evenly distributed: lone parents with two or three children and couples with four children are most likely to be spending below this level, with around half of these households spending less than 75 per cent of the FBS. Couples with either one or two children are least likely to be spending below the FBS level: around a quarter have food expenditure below 75 per cent of the FBS.
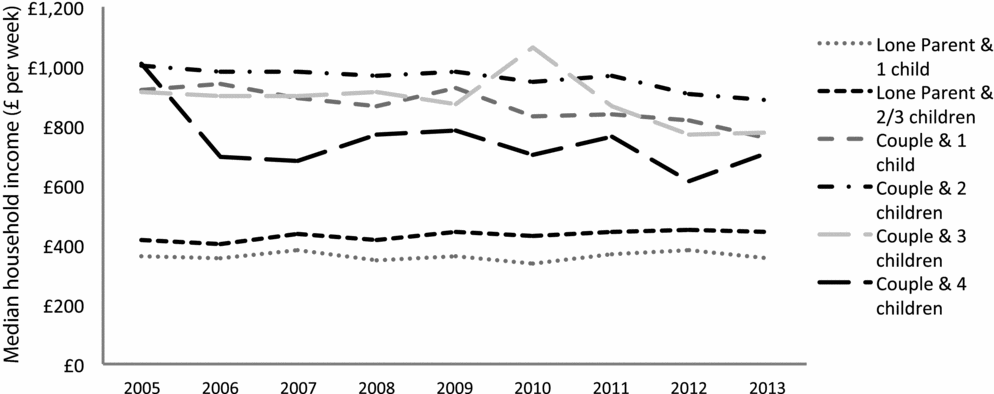
As income is the principal resource within the UK through which households meet their essential needs, looking at what happened to median household income between 2005 and 2013 may help to make sense of the growing proportions of households with children that are spending below, and below 75 per cent of, the FBS on food. Figure 5 sets out the median household weekly income, inflated (using the Retail Price Index, RPI) to 2013 prices for different types of families. It shows that, with the exception of lone parents with two or three children, median weekly income has fallen in real terms since 2005. For a couple with two children, for example, median weekly income (adjusted for inflation) has fallen from £1,005.25 in 2005 to £885.15 in 2013. It is evident from Figure 5 that the income of lone parent households is consistently much lower than that of couple parent households and has remained at a relatively constant level, in real terms, between 2005 and 2013. Overall, this period of falling real terms incomes coincides with the growing proportion of households whose food expenditure is below the FBS, and more broadly with the growing number of lone parents with incomes below MIS (Padley et al., Reference Padley, Hirsch and Valadez2017b). As the income available to provide for all household needs is constrained, it is to be anticipated that growing proportions of households will struggle to spend what is ‘needed’ on food, prioritising other areas of essential spending and/or adjusting the composition of a weekly food basket around the available resources.
Median household income over time (£ per week) for families, 2005 to 2013

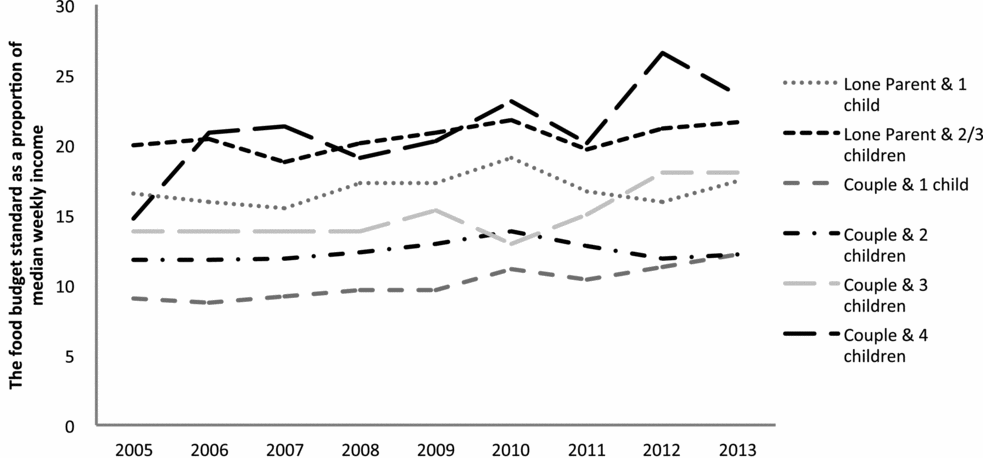
Further explanation, as to why large proportions of some households are not spending ‘enough’ on food to meet these norms, may come from looking at the FBS as a proportion of household income. Setting out the FBS as a proportion of median income, Figure 6 shows that for all households with children, the proportion of their income they would need to spend on food to achieve the FBS has increased between 2005 and 2013. However, in 2013 there are large differences between household types in terms of the proportion of income that would need to be spent to reach this level. For example, in 2013 couples with one child needed to spend 12 per cent of their weekly income in order to provide a minimum nutritious, socially acceptable diet that allows for social participation. Larger households, such as couples with four children and lone parents with two or more children, however, would need to spend nearly double this, between 22 and 24 per cent of their income, in order to meet the same standard.
The FBS as a proportion of median weekly income for families, 2005 to 2013

In a period of falling household incomes (in real terms), with a FBS that has steadily increased over the same time frame, it is not surprising that meeting minimum food needs requires a growing share of income. The analysis presented here draws attention to the growing proportion of families who are not spending as much as is considered necessary to achieve a socially acceptable, nutritious diet that allows for social participation. While all family types (52 per cent of households with children) are less likely to be spending what is ‘needed’ on food, there are some critical differences, with lone parents and larger families facing a greater risk of not meeting the FBS. In 2013, for example, 62 per cent and 71 per cent of lone parents with one or two/three children respectively, and 62 per cent and 82 per cent of couples with three or with four children respectively were spending less than the FBS; whereas, for couples with one child, fewer than half (46 per cent) were falling short of this standard. A particularly sharp rise between 2005 and 2007 in the proportion of families with four children spending below 75 per cent of the FBS (figure 4) reflects the sharp rise, particularly for this family type, in the FBS as a proportion of income (Figure 6). It is likely that significant inflation in cost of food (that reached 13 per cent in 2008 well above real increases in earnings) has a bigger impact on larger families.
Discussion
The analysis above shows that whilst incomes have remained stagnant or fallen, the amount households need to spend to achieve a minimum diet for health and social participation has increased both in real terms and as a proportion of household income. The result is that the proportion not meeting the FBS has increased over time for most household types and is consistently highest for lone parent and large families. Where families are spending below the FBS it is likely that compromises are made in terms of food quality and quantity, social participation and socially acceptable procurement. Previous research suggests that food budgets are ‘elastic’ (that is, squeezed by competing, inelastic, household expenses) and that households achieve savings through food ‘coping strategies’ including ‘trading down’ (Dowler et al., Reference Dowler, Turner and Dobson2001; Griffith et al., Reference Griffith, O'Connell and Smith2013) involving compromised quality and variety. It has been shown that there is a growing price gap between more and less healthy foods (Jones et al., Reference Jones, Conklin, Suhrcke and Monsivais2014) and, when income goes down or the cost of food goes up, people switch to cheaper calories, whilst families with children purchase fewer fruit and vegetables (Griffith et al., Reference Griffith, O'Connell and Smith2013). For those at the very bottom of the income distribution, further reductions in the quality of food are difficult and in these households food quantity is likely to be reduced, with parents generally sacrificing their own food intake to protect their children and/or turning to emergency food provision such as food banks, that are socially stigmatising (Garthwaite, Reference Garthwaite2016). The MIS research and results of PSE UK also confirm an ‘austerity effect’ on social participation, so that whilst families still see the value in social activities such as eating out or entertaining family, friends and children's friends, they are unable to allocate as much resource to them (Davis et al., Reference Davis, Hirsch, Smith, Beckhelling and Padley2012; Gordon et al., Reference Gordon, Mack, Lansley, Main, Nandy, Patsios and Pomati2013). Increased pressures on the household budgets of all family types over time, and lone parents and large families in particular, then, may therefore impact on families’ dietary intake and health and may result in exclusion from social participation and social norms.
A novel contribution of this analysis is in identifying which types of UK families are at risk of food poverty and how this has changed over time. Given what is known about the links between family structures and poverty in the UK (e.g. Culliney et al., Reference Culliney, Haux and McKay2014) it is unsurprising that it is large and lone parent families who struggle to meet the budget standard for a socially acceptable, healthy diet that allows for social participation. According to the Households Below Average Income figures for 2013/14 (DWP, 2015), families particularly at risk of income poverty in Britain include lone parent families, workless households (plus those with only one adult in paid work) and those with three or more children. However, this situation is not inevitable and whilst many factors have been shown to mediate the connection between family structure and poverty, ‘the nature and extent of these links is continually changing as a result of broader demographic, socio-economic and policy developments’ (Culliney et al., Reference Culliney, Haux and McKay2014: 7; Falkingham et al., Reference Falkingham, Evandrou and Vlachantoni2014). International analyses show that investment in welfare can successfully remove families from poverty and that the composition of social transfers is important. In the UK, for example, one child families ‘do better’ compared to large families when the total package of taxes and benefits is taken into account, because child benefit is paid at a higher rate for the first child (Bradshaw and Finch, Reference Bradshaw and Finch2002: 152; Culliney et al., Reference Culliney, Haux and McKay2014: 30). This difference is set to be exacerbated by policies that penalise large families further, for example limiting state support through child tax credits and other benefits to the first two children in a household.
Whilst these findings offer a valuable insight into the family types most likely to be at risk of food poverty, it is important to note that the ways in which people meet their food needs vary widely and there may be reasons other than economic ones that explain why households spend less on food than is publicly determined as socially acceptable. These might include individual, family and cultural preferences for cheaper or less healthy foods, customary cooking practices involving low cost, healthy, foods, or supplementing bought foods with home grown produce. Whilst the MIS Food Budget Standard is calculated using Tesco's pricing, there has been a growth in discount food retailers in the UK (Thompson et al., Reference Thompson, Clarke, Clarke and Stillwell2012) where families may be able to buy equivalent foods more cheaply. On the other hand, there is evidence that some low income households are unable or do not choose to shop at mainstream supermarkets and that food prices for many foods are higher in small local shops, which is sometimes all that is found in deprived areas (Ginn et al., Reference Ginn, Majumdar, Carr, Eastwood and Menger2016). This is likely to make the gap between the amount of money needed to meet food needs and income even wider. Importantly, families may not be spending below the standard because they lack resources. In addition, the diets of those families spending below this amount (whether or not they lack the resources to do otherwise) may not be nutritionally inadequate or socially unacceptable. A limitation of the approach taken in this article compared to direct measures of food insecurity and other research about material deprivation (e.g. see Mack and Lansley, Reference Mack and Lansley2015), then, is that it does not tell us whether households are spending below the amount because of a lack of resources or for other reasons. Furthermore, these data cannot tell us about resource distribution within families and how different household members are affected. Qualitative research examining intra-household variation would usefully augment these analyses (O'Connell et al. (forthcoming) provides detailed qualitative case studies of how three families manage food when they are spending different levels below the food budget standard for their family type). However, an advantage is that the approach operationalises a multidimensional conceptualisation of food poverty that captures food's role in social participation as well as health.
Conclusion
How poverty is conceived and defined has implications for how it is measured (Lister, Reference Lister2004). Since the latter is highly relevant to the measures taken to address it, definitions of (food) poverty are a highly political issue (Saunders, Reference Saunders2013). The article has suggested that in order to learn about which types of family are at risk of food poverty, it is first necessary to establish what counts as a socially acceptable diet in the society of interest, and then to look at who is unable to meet this standard. The comparison of families’ actual expenditure with the FBS element of MIS allows us to do that. Because it includes social acceptability and social participation, special occasions and eating out, the FBS captures a multidimensional understanding of food poverty beyond mere ‘quality’ or ‘quantity’ that is captured by some widely used measures of food insecurity. A further advantage is that because the data have been collected annually it is possible to examine change over time and make interpretations about observed differences in relation to the historical context. Whilst many in the field agree the government needs to measure and monitor food insecurity systematically (not least to fulfil its obligations regarding the Human Right to Food (e.g. Lambie-Mumford and Dowler, Reference Lambie-Mumford and Dowler2014), any new measure will not permit retrospective analysis of the effects of austerity measures or other social policies and historical events on the food families buy and eat.
Whilst there are challenges to operationalising a broad conceptualisation of food poverty, more stringent measures that fail to acknowledge the social nature of food effectively reduce food to nutrients. A risk is that these feed into public policies that seek to ‘solve’ food insecurity through ‘food solutions’, including giving ‘wasted food to surplus people’ (Riches and Silvasti, Reference Riches and Silvasti2014). This approach is inconsistent with a multidimensional understanding of poverty and contrary to the UNESCR, which gives people the right to food, not the right to be fed (Lambie-Mumford, Reference Lambie-Mumford2013; Riches and Silvasti, Reference Riches and Silvasti2014). Instead of further stigmatising and excluding families from ‘ordinary living patterns’ (Townsend, Reference Townsend1979: 31), and discriminating against large and lone parent families, government should use budget standards research to ensure that wages and social security benefits, in combination, are adequate for a socially acceptable standard of living and eating that recognises the fundamental role of food in health and social inclusion (Hirsch and Valadez-Martinez, Reference Hirsch and Valadez Martinez2017; Padley and Hirsch, Reference Padley and Hirsch2017).
Acknowledgements
The research leading to these results has received funding from the European Research Council under the European Union's Seventh Framework Programme (FP7/2007-2013) /ERC grant agreement n° 337977. The authors wish to thank colleagues at the Centre for Research in Social Policy, Loughborough University, for permission to use their data and making it accessible to us.