INTRODUCTION
One of the more challenging questions facing parasite population ecologists is why certain individuals in any given host population are infected with so many more of a given nematode species than other individuals. These more heavily infected hosts are typically a dominant source of transmission to the population at large, they experience the highest parasite-induced morbidity and mortality, and they are the hosts in which density-dependent regulation of both parasite and host populations predominates (Anderson, 1986). Although parasite burden is determined by a wide range of factors, it is genetically-determined influences on the type and magnitude of innate and adaptive immune responses that have received most attention (Wassom et al. 1986; Wakelin, 1988; Moulia, Le Brun and Renaud, 1996). Such genetically-determined resistance has led researchers to select for sheep (Bisset et al. 1994; Stear and Murray, 1994; Eady, 2003; Khan et al. 2003) or mice (Brindley et al. 1986; Keymer et al. 1990) that are naturally resistant to nematodes or tolerant to nematode-induced disease, and to identify specific genes or gene complexes (Wahid and Behnke, 1991; Su and Dobson, 1997; Behnke et al. 2003; Menge et al. 2003; Quinnell, 2003) that may allow us to understand nematode epidemiology and possibly to target control efforts toward those individuals who carry ‘susceptibility’ traits.
My laboratory has used Heligmosomoides polygyrus, a direct life-cycle nematode of the duodenum of mice, to further understand the relative importance of various factors that determine the intensity of nematode infections in individual hosts (Scott, 1991; Tanguay and Scott, 1992; Heitman, Koski and Scott, 2003; Scott et al. 2005). The higher resistance of inbred Balb/c mice compared with C57BL/6 mice (Cypess and Zidian, 1975; Prowse et al. 1979; Enriquez, Zidian and Cypess, 1988; Scott, 1991) is evident after a primary infection that normally induces a long-lasting chronic infection, after a challenge infection that normally induces protective immunity and expulsion of the parasite within a few weeks, and after repeated weekly exposure to 10, 50 or 100 larvae (Scott, 1991). However, when the two strains of mice are exposed together to a more natural transmission process in indoor arenas, infection levels are indistinguishable between the two strains (Scott, 1991). In these arenas, 50 female mice of each strain lived together. Damp peat trays in the arenas provided a suitable habitat for development of larvae, thus providing a continuous source of infection to mice that were in contact with the peat trays. The similar infection levels in Balb/c and C57BL/6 mice could not be explained on the basis of differential transmission rates as there was no evidence of different rates of contact with the peat trays between the strains (Scott, 1991).
This paper reports the results of a series of follow-up experiments designed to determine why infection levels differed between C57BL/6 and Balb/c mice under controlled infection conditions but were similar in the two strains when they lived together as a free-running host-parasite population. Specifically, 3 sets of hypotheses were tested: (1) the social context of the mice (living as a large population in an arena) altered the relative resistance of the two strains; (2) peat altered the course of infection in the mice and (3) the ability to distinguish between Balb/c and C57BL/6 mice was a function of the rate of exposure to parasite larvae in the arena. The experiments are described in separate sections of this paper.
MATERIALS AND METHODS
Female Balb/c and C57BL/6 mice were purchased at 3 weeks of age from Charles River Canada. Mice were held for 3–4 days prior to any experiments. All procedures were approved by the McGill University Animal Care Committee, in accordance with the policies of the Canadian Council on Animal Care (1984).
Heligmosomoides polygyrus was originally obtained from Dr M. Sukhdeo (Rutgers University) and is passaged every 3–4 months in outbred female CD1 mice. Controlled infection of mice was by oral gavage under light ether anaesthetic. The standard anthelmintic-abbreviated challenge infection protocol involved infecting mice with 100 L3 on Day 0, treating them with pyrantel pamoate (175 mg/kg body weight) on days 9 and 14, then re-infecting them with 100 L3 on day 21. This procedure has been shown to be effective in stimulating a protective acquired immune response in the mice (Behnke and Robinson, 1985). Net parasite egg production per mouse per day (epd) was estimated from faecal pellets collected from individual mice removed from their home cage or arena and placed, without food, over a wire grid in conventional cages for 24 h. Mice were then returned to the home cage or arena. Mice were killed using CO2 and numbers of larvae and adult parasites were counted using standard procedures (Scott, 1988, 1991).
Large indoor arenas (3·2×0·8 m) were used for several experiments. Mice in the arenas were provided with food and water ad libitum. The arena floor was covered with pine shavings. In those experiments involving natural transmission, 3 trays (42×52 cm) containing damp peat moss and covered with stainless steel mesh (6×6 mm) were placed in the arena and sprayed with water daily. Mice were moved into a clean arena every 2 weeks. On the same day, 10 uninfected sentinel mice of each strain were placed in the used arena containing the 3 peat trays for 24 h. Then, 2 of the 3 peat trays were transferred to the clean arena, and the third tray was cleaned, filled with fresh peat and placed in the clean arena. The sentinel mice were removed and housed in conventional cages until necropsy 6 days later. Worm numbers in these mice were used as an index of larval availability in the arena.
All statistical analyses were done using SAS 9.1. Analysis of Variance (ANOVA) was used to compare worm burdens and per capita egg production (eggs/female worm/day) between strains using Proc Mixed. Repeated measures ANOVA was used to detect differences in the pattern of net egg production (eggs/mouse/day) over time between strains. Only significant interaction terms are reported. Post-hoc comparison of means was done by a Tukey's test using Proc GLM. Unless otherwise noted, data are presented as mean±S.E. Analyses were considered statistically significant at P[les ]0·05.
DOES SOCIAL CONTEXT ALTER EXPRESSION OF RESISTANCE?
When mice housed in conventional cages are given a controlled oral challenge infection, worm numbers are higher in C57BL/6 mice than in Balb/c mice (Scott, 1991). The following experiment was designed to determine whether the distinction would be retained if the two strains lived together in an arena as a single large population but in the absence of continuing transmission.
Methods
Forty female mice of each strain were individually marked using toe clips and placed in an arena on a bedding of pine shavings with no peat trays. Each mouse was given a primary infection with 100 L3 on Day 0 and 10 of these mice were killed 9 days post-primary (pp). The standard anthelmintic-abbreviated challenge protocol was used for the 30 remaining infected mice of each strain. Net egg production was monitored weekly, beginning 2 weeks after the challenge infection. Fifteen mice of each strain were killed 29 days post-challenge (pc), and the remaining 15 mice were killed 58 days pc.
Results
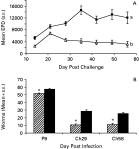
Egg production during challenge infection varied significantly with time and mouse strain, and the pattern of egg production over time differed significantly among strains. Egg production was higher and remained elevated in C57BL/6 mice, whereas it was lower and declined with time in Balb/c mice (Fig. 1A). Similarly, worm numbers were significantly higher in C57BL/6 mice than in Balb/c mice at 9 days pp and at both 29 and 58 days pc (Fig. 1B). Together, these data indicate that living together as a single large population does not alter the clear distinction between C57BL/6 mice as susceptible and Balb/c mice as resistant to H. polygygrus.

Fig. 1. Controlled challenge infection in arenas. (A) Net egg production in Balb/c (–[utri ]–) than C57BL/6 (–[squf ]–) mice following anthelminthic-abbreviated challenge protocol. (Time: F6,228=9·98, P<0·0001; Strain: F1,58=202·43, P<0·0001; Time*Strain: F6,228=7·68, P<0·0001). Different lowercase letters indicate significant differences between strains. (B) Worm numbers in Balb/c (cross-hatched bar) and C57BL/6 (solid bar) mice differed significantly at 9 days after primary infection (P9; F1,18=20·35, P=0·0003) and at 29 days (Ch29: F1,28=74·19, P<0·0001) and 58 days (Ch58; F1,28=32·95, P<0·0001) after challenge infection. * Indicates significant difference between strains at each time.
DOES PEAT MOSS ALTER EXPRESSION OF HOST RESISTANCE?
This experiment examined whether worm burdens would differ between strains when mice were infected by exposure to 1000 L3 on damp peat moss for 24 h and were housed on peat.
Methods
Thirty female mice of both strains were infected in Nalgene cages (27×21×14 cm) (Fisher Scientific, Montreal, Quebec, Canada) containing 1000 larvae on damp peat for 24 h. Mice were then moved into Nalgene cages covered with dry peat. Ten mice of each strain were killed 9 days pp. The remainder were treated with pyrantel pamoate on 9 and 14 days pp, then re-exposed to 1000 larvae on damp peat for 24 h on day 21. Ten mice of each strain were killed on days 29 and 57 pc. Net egg production was monitored on days 14, 28, 42 and 56 pc.
To confirm that housing mice on peat did not alter the efficacy of pyrantel pamoate, an additional 10 mice of each strain were infected by oral gavage with 100 L3. Half the mice were housed on dry peat and the other half were housed on dry shavings. All mice were treated with pyrantel pamoate on days 9 and 14 pp, then killed 1 week later.
Results
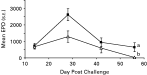
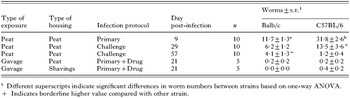
Consistent with C57BL/6 mice being more susceptible to H. polygyrus, C57BL/6 mice had higher worm numbers than Balb/c mice at 9 days pp (Table 1) (F1,18=17·68, P=0·0005) and produced more eggs after challenge infection (Fig. 2). Worm numbers were borderline higher in C57BL/6 mice at day 29 pc (F1,18=3·64, P=0·0723). They declined in C57BL/6 mice after 29 days pc such that, by day 57 pc, worm numbers were borderline higher in Balb/c mice (F1,18=4·34, P=0·0518). Pyrantel pamoate was equally effective at clearing parasites regardless of whether mice were housed on peat or shavings (Table 1). Overall, C57BL/6 mice were more susceptible than Balb/c mice, although worm numbers at day 57 pc hint that peat may result in an accelerated loss of worms from C57BL/6 mice late in the challenge infection.

Fig. 2. Effect of peat on egg production in Balb/c (–[utri ]–) and C57BL/6 (–[squf ]–) mice following anthelminthic-abbreviated challenge protocol. (Time: F3,112=14·10, P<0·0001; Strain: F1,112=7·92, P=0·0058). Different lowercase letters indicate significant differences between strains.

IS HOST RESISTANCE PHENOTYPE EXPRESSED AFTER A SINGLE LOW LEVEL INFECTION?
Methods
To determine whether the worm numbers in the 2 inbred strains would be distinguishable if mice were infected with very low numbers of parasites, 20 mice of each strain were infected by oral gavage, once only with 5 L3. Mice were then housed in conventional cages. Net egg production was monitored every 2 weeks, and worm numbers were recorded every month for 4 months at necropsy of 5 mice per strain.
Results
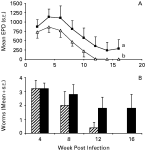
Egg production differed over time and was significantly higher in C57BL/6 mice than in Balb/c mice throughout the experiment (Fig. 3A). Similarly, worm numbers declined over time and were overall significantly higher in C57BL/6 mice than Balb/c mice (Fig. 3B). These results indicate that despite a single, very low exposure to larvae, the two strains were distinguishable both on the basis of net egg production and worm burden.

Fig. 3. Effect of single low-level infection on Heligmosomoides polygyrus survival in Balb/c and C57BL/6 mice. (A) Net egg production in Balb/c (–[utri ]–) and C57BL/6 (–[squf ]–) mice following a single oral infection with 5 larvae. (Time: F7,184=4·76, P<0·0001; Strain: F1,184=5·52, P<0·0199). Different lowercase letters indicate significant differences between strains. (B) Worm numbers in Balb/c (cross-hatched bar) and C57BL/6 (solid bar) mice differed significantly over time (F3,32=5·08, P=0·0055) and between strains (F1,32=4·26, P=0·0473). Comparisons between strains at individual time-points were not significant.
DOES INCREASED TRANSMISSION IN THE ARENAS FACILITATE DISCRIMINATION IN WORM BURDENS BETWEEN STRAINS? (REGULAR REPLACEMENT WITH NAÏVE MICE)
The first approach used to increase transmission rates in the arena setting was regular addition of naïve mice to gradually replace the original arena mice.
Methods
Arena 1
Fifty female Balb/c and 50 female C57BL/6 mice were individually marked, and 5 of each strain were infected by oral gavage with 200 L3. Then all mice were placed together in a large indoor arena containing 3 damp peat trays. Every 2 weeks, beginning on week 4, 5 mice of both strains were replaced with individually marked cohorts of 5 naïve mice. Net egg production was measured in 2 groups of 15 mice of each strain that had not been infected by oral garage, removed from the arena for 24 h on alternate weeks, beginning on week 4. Every 2 weeks, 10 uninfected sentinel mice of each strain were introduced into the arena for 24 h, and killed 6 days later as an index of larval availability in the arenas. All arena mice were killed on week 20.
Arena 2
A second arena had been established 19 weeks earlier without replacement of mice, and data on egg production have been published previously (see Scott, 1991 for details). Beginning on week 20, and over the next 20 weeks, 5 mice of both strains were replaced with naïve mice every 2 weeks until all had been replaced, except the 5 mice of each strain that had been initially infected. Over the following 10 weeks, no further replacement occurred. Net egg production and larval availability were monitored every 2 weeks.
The resistance of mice in Arena 2 was then tested by controlled experimental infection of mice that had been exposed to ongoing transmission for 9–13 weeks (15 mice per strain), 15–19 weeks (15 mice per strain), 21–25 weeks (15 mice per strain), or 45 weeks (5 mice per strain). All mice were removed from the arena and housed in conventional cages. Half the mice of the first 3 subsets were challenged with 100 L3, given by oral gavage. The remaining mice were not given a challenge infection. In order to control for infectivity of the larvae, 5 naïve mice of each strain were also infected with 100 L3. All mice were killed 13 days post-infection and numbers of larvae and adult worms were recorded.
Results
Larval uptake
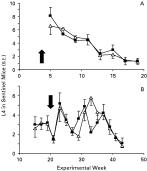
Data from sentinel mice confirmed previous reports that there is no difference in the rate of uptake of larvae from the peat between strains, but that larval availability differs significantly over time (Fig. 4A,B). In Arena 1 where mouse replacement began 4 weeks after the experiment started (Fig. 4A), larval uptake gradually declined with time. In Arena 2, uptake of larvae more than doubled 3 weeks after replacement with naïve mice began (week 20), it then fluctuated between about 2 and 5 larvae/mouse/day, then declined to less than 1 larva/mouse/day after week 40. Interestingly, regular replacement of mice exerted only a modest effect on the number of larvae in the arena, compared to previous experiments without replacement (see Scott, 1991).

Fig. 4. Larval uptake by sentinel mice in Arena 1 (A) and Arena 2 (B) with regular replacement of Balb/c (–[utri ]–) and C57BL/6 (–[squf ]–) mice with naïve mice, as assayed 6 days after exposure in arena. In both arenas, larval uptake declined with time (Arena 1: F7,152=14·54, P<0·0001; F14,292=5·07, P<0·0001). Arrow indicates week on which replacement began.
Egg production
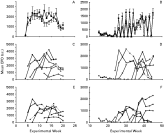
In order to evaluate the impact of mouse replacement on egg production in the arenas, the net profile of egg production in the arena was monitored (Fig. 5A,B) as well as egg production in each new cohort of 5 mice (Fig. 5C,D,E,F). In Arena 1, net egg production differed significantly with strain and with time (Fig. 5A), both over the duration of the experiment, and also with the time that individual cohorts of mice had been in the arena. At the cohort level, egg production was initially comparable among strains (Fig. 5C vs E), but egg release increased and remained elevated in the first 2 cohorts of C57BL/6 mice (Fig. 5C), compared with the first 2 cohorts of new Balb/c mice (Fig. 5E). Thereafter egg production in new cohorts of mice was comparable between the strains.

Fig. 5. Egg production in Arenas 1 (A,C,E) and 2 (B,D,F) with regular replacement with naïve mice. (A,B) Net egg production differed between Balb/c (–[utri ]–) and C57BL/6 (–[squf ]–) mice (Arena 1: F1,455=10·55, P=0·0012; Arena 2: F1,828=11·12, P=0·0009), over time (Arena 1: F13,455=4·56, P<0·0001; Arena 2: F19,828=3·80, P<0·0001), and with the length of time that mice had spent in the arena (Arena 1: F15,455=5·07, P<0·0001; Arena 2: F18,828=7·36, P<0·0001). In Arena 2, the interaction between strain and duration in the arena was also significant (F29,828=1·92, P=0·0027). (C,D,E,F) Cohort specific egg production in original C57BL/6 (C,D) and Balb/c (E,F) mice (closed symbols) and in cohorts of introduced mice (open symbols) from Arena 1 (C,E) and Arena 2 (D,F).
In Arena 2, mice of both strains that had been previously housed in the arena throughout the experiment were passing very few eggs at week 20 (Fig. 5B; see also Scott, 1991). Analysis of the pattern of egg production, starting at week 15 (5 weeks before mouse replacement began), revealed significant effects of strain, time, duration of mice in the arena and also a significant interaction between strain and duration in the arena (Fig. 5B,D,F). Within 3 weeks of the start of mouse replacement, net egg production in C57BL/6 mice was higher than in Balb/c mice (Fig. 5B). As soon as the first new cohorts of 5 Balb/c and 5 C57BL/5 mice were introduced, egg production in these mice increased after a time delay of about 3 weeks (Fig. 5D,F). Each successive group of 5 mice introduced between weeks 20 and 26 showed the same pattern. As in Arena 1, the initial increase in egg production in the first 2 cohorts of immigrants was much higher in C57BL/6 mice than in Balb/c mice whereas the rate of increase in egg production was comparable between the strains among the later sets of replacement cohorts. Overall, these data indicate that egg production was detectably higher in C57BL/6 mice than Balb/c mice only in the first cohorts of replaced mice.
Parasite numbers
Worm numbers at necropsy of mice in Arena 1 differed significantly between strains and over time, and there was also a significant interaction between strain and time. However, both the strain effect and the strain×time interaction were driven completely by data from the 5 mice of each strain that had been initially infected to start the epidemic (C57BL/6: 50·8±7·6 worms; Balb/c: 28·6±9·7 worms). When data from these mice were removed, all significant effects were lost. At the end of the experiment, worm burdens from the other 45 mice of each strain were similar between C57BL/6 mice (4·0±0·5) and Balb/c mice (3·5±0·4).
Resistance to controlled challenge
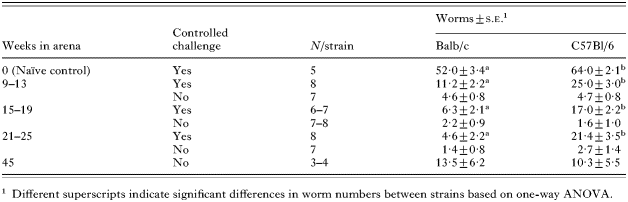
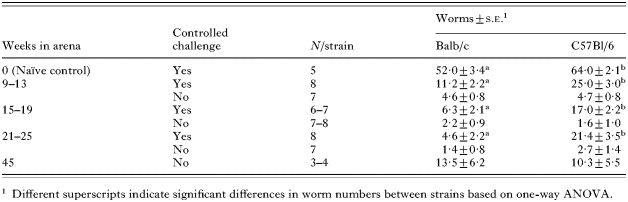
When half of the mice from Arena 2 were given a controlled challenge infection of 100 L3, worm burdens were higher in C57BL/6 mice than in Balb/c mice, confirming the ability of Balb/c mice to better resist challenge infection than C57BL/6 mice. In contrast, worm numbers in all groups of mice that had lived in the colony and not been challenged with 100 L3 were comparable between strains (Table 2). This confirms the previous observation (Scott, 1991) that mice living in the arenas and exposed to continuous transmission became indistinguishable with regard to worm burden.
DOES INCREASED TRANSMISSION IN THE ARENAS FACILITATE DISCRIMINATION IN WORM BURDENS BETWEEN STRAINS? (REGULAR ADDITION OF LARVAE)
Although regular replacement with naïve mice resulted in a temporary boost to transmission, data from sentinel mice indicated that it was not sufficient to sustain increased numbers of larvae on the peat trays (Fig. 4). The second approach to increase transmission rates in the arenas was to add larvae to the peat trays at regular intervals.
Methods
Fifty mice of each strain were placed in an arena containing 3 peat trays. Five mice of each strain were experimentally infected with 200 L3. Twice a week, 10000 L3 were pipetted onto each of the 3 peat trays in the arena, to boost the numbers of available third-stage larvae. Every 2 weeks, net egg production of 30 individually marked mice per strain was monitored. Ten sentinel mice of each strain were placed in the arena for 24 h every 2 weeks, and larval uptake was recorded 6 days later. After 19 weeks, all mice in the arena were killed and parasites were counted. This experiment was repeated twice (Arenas 3 and 4).
Results
Larval uptake
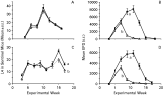
Addition of L3 to the peat trays substantially increased the availability of larvae (Fig. 6A,C), relative to arenas with regular replacement of mice (Fig. 4). Larval uptake varied significantly over time in both Arenas 3 and 4. Uptake declined in Balb/c mice toward the end of the experiment (Arena 4; Fig. 6C), but otherwise uptake between strains was similar.

Fig. 6. Larval uptake (A,C) and net egg production (B,D) by Balb/c (–[utri ]–) and C57BL/6 (–[squf ]–) mice in Arenas 3 (A,B) and 4 (C,D) with regular addition of third-stage larvae to the peat trays. Different letters indicate overall differences between strains. (A) Time (F6,126=47·28, P<0·0001); (B) Time (F7,464=44·47, P<0·0001), strain (F1,464=148·91, P<0·0001), time*strain (F7,464=29·24, P<0·0001); (C) Time (F7,144=15·82, P<0·0001), strain (F1,144=4·65, P<0·0327); (D) Time (F7,464=41·2, P<0·0001), strain (F1,464=170·29, P<0·0001), time*strain (F1,464=21·29, P<0·0001).
Egg production
Elevated transmission resulted in sustained differentiation in egg production between the two strains of mice (Fig. 6B,D). In both Arena 3 and 4, egg production increased then gradually declined over time but the increase was more dramatic and the decline delayed in C57BL/6 mice compared with Balb/c mice.
Parasite numbers
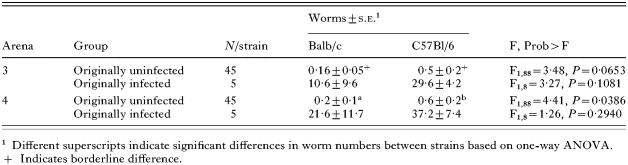
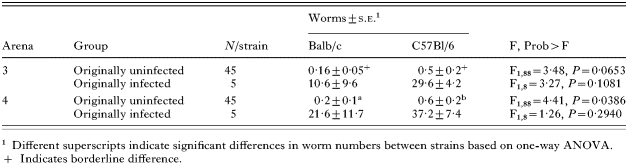
At the end of the experiment, comparison between strains revealed higher worm numbers in C57BL/6 mice compared with the Balb/c mice (Table 3). Interestingly, worm numbers were much higher in mice that had originally been infected with 200 L3, than in all other mice. Comparison between strains within this group of mice did not reveal significant differences but this is likely due to a combination of the low sample size (n=5 for this group) and high variability, as average worm numbers in C57BL/6 mice were almost twice (Arena 3) or 3 times (Arena 4) higher than in Balb/c mice.
DISCUSSION
Resistance to H. polygyrus of Balb/c mice relative to C57BL/6 mice evident during controlled primary, challenge and trickle infection protocols was lost when mice of both strains lived together as a single population in an indoor arena where continuous natural transmission occurred (Scott, 1991). Despite a general understanding that infection levels are driven by more than genetics, and that results from controlled experiments cannot always be extrapolated to more natural situations, the results from this study were perplexing. On the basis of experiments reported here, the explanation seems to be tied primarily to the rate of parasite transmission.
The arena setting differed from controlled infection experiments in a number of ways, each of which could have interfered with the expression of the susceptibility/resistance traits of the two mouse strains. I first considered the social context of the mice, given that housing mice at higher densities increases concentrations of the immunosuppressive hormone, corticosterone (Peng et al. 1989; Chapman et al. 1998). Results following both controlled primary and challenge infection of mice living in arenas indicated that mice living as a large population had no difficulty expressing their ‘normal’ resistance/susceptibility phenotype. Both egg production and worm burdens were consistently higher in C57BL/6 mice than in Balb/c mice. This indicated that the social environment was not the explanation for similar infection levels between strains in the previous arena experiments (Scott, 1991).
A second distinction between the previous controlled infection experiments and the previous arena experiments (Scott, 1991) was the presence of peat. Peat is likely to contain phenolics and other secondary chemicals, and these may exert anthelmintic effects if ingested. Mice have been observed to put peat moss in their mouths (Tanguay and Scott, 1992; Heitman et al. 2003; Scott et al. 2005), and may swallow at least some of it. Ingested peat would also increase the insoluble fibre content of the diet (Villarroel et al. 2003). Although Sun et al. (2002) found that diets high in the insoluble fibre, cellulose, had no effect on H. polygyrus survival, more chronic ingestion of cellulose has been reported to increase villus length in mice and rats (Sigleo, Jackson and Vahouny, 1984; Dirks and Freeman, 1987). This may promote H. polygyrus survival as the parasites maintain their position in the gut by twisting around the longer villi of the duodenum (Bansemir and Sukhdeo, 1994). The relative resistance of Balb/c mice living on a peat substrate was evident in lower egg production over 2 months following controlled challenge infection, and in lower worm numbers both during the primary infection and 1 month after challenge infection, compared with C57BL/6 mice. However, compared with other experiments (Fig. 1B and Scott, 1991), worm numbers were surprisingly low in C57BL/6 mice 2 months after challenge. Thus, this experiment hints that prolonged contact with peat may reduce worm survival after challenge in C57BL/6 mice, though why this effect would be specific to C57BL/6 mice is unclear. Nevertheless, on the basis of the data from day 57 post-challenge, there is some evidence that chronic exposure to peat moss may exert at least a subtle effect on the expression of the susceptibility phenotype in C57BL/6 mice.
Worm numbers in the previously reported arena experiments were very low, with average values less than 2 worms per mouse (Scott, 1991) except for the 5 mice of each strain that had been experimentally infected with 200 L3 at the beginning of the experiment. In order to see whether the susceptibility/resistance phenotype of the mice would emerge even when they were exposed to very low numbers of larvae, mice were infected once only with 5 larvae. As shown in Fig. 3, even at this very low infection dose, C57BL/6 mice had significantly higher egg production and worm numbers over time.
If a minimum threshold is required to stimulate an adaptive immune response, the threshold may not be reached at very low transmission rates. If this is the case, and assuming that the phenotypic differentiation between strains is due to genetic control of the adaptive immune response, it is possible that acquired immunity had not been stimulated in mice living in the arenas. However, when mice removed from the arena were given a controlled oral challenge, Balb/c mice were much more resistant to challenge than C57BL/6 mice. Therefore, it appears that an adaptive immune response had been stimulated in mice living in the arena. This is further supported by the elevated eosinophilia and IgE levels detected in arena mice (Scott et al. 2005) and by reports by that as few as 1–4 worms were sufficient to stimulate protective immunity (Behnke and Robinson, 1985; Wahid and Behnke, 1991).
Transmission in the arenas depends on continual availability of larvae on the peat. In the previous study (Scott, 1991), sentinel mice acquired between 5 and 10 larvae per day. Replacing 10% of the mice every 2 weeks had only a modest and transient effect in boosting transmission rates. Despite this, egg production increased more rapidly in C57BL/6 mice than in Balb/c mice, shortly after naïve mice were first introduced. Thereafter, both strains were indistinguishable both in egg production and in parasite numbers. In contrast, regular addition of larvae directly onto the peat trays achieved the desired goal of increasing transmission rates, and maintaining them at elevated levels throughout the experiment for both strains. Sentinel mice in these arenas acquired an average of 14 (Arena 4) or 17 (Arena 3) larvae in 24 h, compared with an average of 3 larvae in Arenas 1 and 2 with regular replacement with naïve mice. Associated with this higher transmission was a clear and continued distinction in egg output between C57BL/6 mice and Balb/c mice. Worm numbers were also higher in C57BL/6 mice compared with Balb/c mice when the mice were examined at the end of the experiment.
Overall, at lower transmission rates, it appears that C57BL/6 mice become more resistant to infection, not that Balb/c mice become more susceptible. Average egg production only reached about 2000 eggs/day in both strains exposed to lower transmission (Fig. 5 and Scott, 1991), but under conditions of higher transmission, egg production increased to 6000–8000 epd in C57BL/6 mice compared with about 3000 epd in Balb/c mice. This last experiment demonstrates not only that the phenotypic expression of resistance or susceptibility that had been hidden in previous arena settings was evident once transmission rates had increased, but also that it is the response of C57BL/6 mice that seems to be altered.
So why would the susceptibility phenotype be expressed in C57BL/6 mice only when they are exposed to higher transmission rates? Stated another way, why would C57BL/6 mice be better able to resist H. polygyrus infection at low rates of transmission? It seems unlikely that a lower exposure to parasite antigen stimulates a stronger response, especially given that the time taken to observe protective responses is inversely correlated with the rate of infection (Scott, 1991), and that worm burden after controlled challenge is inversely correlated with the priming dose of larvae (Wahid and Behnke, 1996). Presumably, C57BL/6 mice are rejecting either incoming larvae or adult worms more effectively at low transmission rates. Mouse strains that are classified as ‘susceptible’ or ‘weak responders’ to H. polygyrus do have the capacity to reject the parasites in a manner similar to more ‘resistant’ or ‘stronger responders’ when an acute mucosal inflammatory response is induced by another infection (Behnke, Cabaj and Wakelin, 1992). Perhaps C57BL/6 mice become less responsive to parasite-induced immunosuppression (Wahid and Behnke, 1996) at low transmission rates, and are thus better able to mount and sustain the Th2 protective response that is important for functional protection (Wahid et al. 1994; Gause, Urban and Stadecker, 2003).
In summary, this study indicates that the natural susceptibility of C57BL/6 mice to continual transmission of H. polygyrus in indoor arenas is not modified by the social environment of living within a large population of mice, nor by infection with only 5 larvae. C57BL/6 mice that have lived in arenas and been exposed to continuous transmission are responsive to controlled challenge infection, indicating that their adaptive immune response has been primed. Although chronic exposure to peat may promote resistance in C57BL/6 mice, it is more likely that low rates of exposure to larvae permit expression of resistance in these mice. By increasing transmission rates in the arena, C57BL/6 mice show their typical susceptibility phenotype, and Balb/c mice remain resistant. It is unusual to observe that a stronger resistance state is generated by reducing antigen exposure, as most studies show the inverse, with more effective and more rapid protection in mice exposed more frequently or to higher doses of larvae (Slater and Keymer, 1986; Keymer and Tarlton, 1991; Scott, 1991; Brailsford and Behnke, 1992; Wahid and Behnke, 1996; Fakae, Harrison and Sewell, 2000). If this finding extends beyond the mouse model, it may have marked implications for control of nematode infections in human and livestock populations where a gradual reduction in transmission rates would have the added benefit of boosting protection against incoming eggs or larvae in genetically susceptible individuals.
The technical assistance of F. Jalili is gratefully acknowledged. This research was supported by a Natural Sciences and Engineering Research Council of Canada (NSERC) Grant 3585. Research at the Institute of Parasitology is supported by a Regroupement Stratégique from FQRNT, a provincial funding agency.