NOMENCLATURE
- CD
drag coefficient
- C DL
lift-dependent drag coefficient
- C D 0
zero-lift drag coefficient
- CL
lift coefficient
- dFF
formation drag fraction
- DL
lift-dependent drag force (N)
Abbreviations
- ATUGA
Advanced Technology Ultra-Green Airliner
- ATC
Air Traffic Control
- BLADE
Breakthrough Laminar Aircraft Demonstrator in Europe
- CAD
Computer-Aided Design
- CFD
Computational Fluid Dynamics
- DLR
German Aerospace Centre (Deutsches Zentrum für Luft- und Raumfahrt)
- EASA
European Aviation Safety Agency
- FAA
Federal Aviation Administration, Federal Aviation Regulation
- ICAO
International Civil Aviation Organization
- NASA
National Aeronautics and Space Administration
- ISA
International Standard Atmosphere
- MIT
Massachusetts Institute of Technology
- NACRE
New Aircraft Concepts Research
- NLF
Natural Laminar Flow
- PAX
Passengers
- SAVE
Surfing Aircraft Vortices for Energy
- UAS
Unmanned Aerial System(s)
- USAF
United States Air Force
- VLM
Vortex Lattice Method
1.0 INTRODUCTION
The challenges that the aviation industry is going to face for decades to come are well known, as is the threat they pose to the growth – and indeed the future – of the sector. It is widely quoted that aviation contributes to 2–3% of man-made CO2 emissions, a percentage that could rise to 15% within a few decades(Reference Penner, Lister, Griggs, Dokken and McFarland1). Thus, environmental concerns are one of the first items in the agenda of companies, governments and society.
Another key challenge is the possibility for the sector to continue being economically viable. In addition to the expected continued rise of fossil fuel prices(2), alternatives such as biofuels will struggle to become commercially feasible unless significant technological advances are made(Reference Brownbridge, Azadi, Smallbone, Bhave, Taylor and Kraft3). One aspect related to this which the industry does not publicise so often is the availability of fuel. Selling aircraft is easier if the customers are told the new craft will cut down the ever-increasing fuel costs, but it becomes more difficult if they were to be reminded instead that there might in fact not be enough fuel to power the aircraft in the future.
Thirdly, with a predicted increase in the number of air passengers of many thousands in the next 30 years(4), developing a historical trend of arguably exponential growth(Reference Budd, Griggs and Howarth5), there will be a tremendous challenge in terms of the ability to provide for such a great number of travellers and flights, as well as the associated size of global fleet required.
In light of all of this, a sustainable approach is required on every front. Sustainability is a buzzword that has become commonly mentioned, perhaps misused in many occasions, and one could say the word itself has become unsustainable. However, it cannot be denied that it is at the heart of the solution to aviation's problems.
1.1 The reasons for formation flight
The situation just described is where formation flight comes into play. Similar to other developments in engineering, it has arisen from the observation of Nature and learning from it. Birds use formation flight with elegance and are able to extract an immense benefit out of it. It is claimed that a flock of birds of 25 specimens can extend its range by 70% of its solo flight capability(Reference Lissaman and Shollenberger6), and this has been supported by studies which found considerably reduced heartbeat and wing-beat frequencies for birds flying in formation(Reference Weimerskirch, Martin, Clerquin, Alexandre and Jiraskova7).
A key aspect of formation flight is that it requires no major change to the appearance or configuration of aircraft already in service, so the ratio of potential benefits to the cost of implementation is among the most promising of all the technologies and initiatives being put forward to tackle the abovementioned challenges. It is therefore a simple initiative with which the industry could gain a lot; however, real-world application tends to be less straightforward than on paper, which is also partly due to the fact that, it must be remembered, technologies do not act in isolation, making it fundamental to look at formation flight from a systematic point of view.
On the other hand, the idea of formation flight is not new. A hundred years ago, in 1914, Wieselsberger used Prandtl's recently published lifting line theory to explain the reasons for the reduction in flight power arising from the formation of several birds(Reference Ning8). His analysis was nevertheless somewhat basic and led to under-predicting the gains, but as time went on and the understanding of aerodynamics improved, studies in the 1970s, 1980s and 1990s showed substantial savings were indeed possible. This then raises the question, ‘Why now?’
The delay has been mostly due to safety, as the technological requirements for precise control and navigation of aircraft have hindered its application on civil airliners. Economic matters have also been a factor: perhaps analogously to the development of the Open Rotor engine, formation flight was essentially not economically beneficial in previous decades. However, progress in avionics and the increasing pressure to improve the efficiency of the aviation sector have put it back in the spotlight, and it has been recognised that, despite the difficulties, the industry has the technology and ability to put it in practice and develop it now, which is why formation flight is of such relevance in the effort to tackle aviation's challenges. The world could certainly be on the verge of an important improvement to aircraft operations and a step change in fuel efficiency and environmental impact.
1.2 Formation flight for highly efficient aircraft
The formation flight studies found in the literature presented in the next section are for conventional aircraft, be it civil or military, as the interest is to demonstrate the viability of the concept to use it with existing fleets, which is naturally a necessary step in the development of the technology. However, if we are to make the most out of formation flight, it is essential that its role is understood not just for the current fleet, but also for future aircraft. These future vehicles could be highly efficient due to the use of a host of new and disruptive technologies in the areas of propulsion, aerodynamics, structures, and systems, which will be aimed at reducing fuel consumption and environmental impact. Configurations studied as part of frameworks such as NACRE(Reference Frota9) in Europe or N+3(Reference Greitzer, Bonnefoy, De la Rosa Blanco, Dorbian, Drela, Hall, Hansman, Hileman, Liebeck, Lovegren, Mody, Pertuze, Sato, Spakovszky, Tan, Hollman, Duda, Fitzgerald, Houghton, Kerrebrock, Kiwada, Kordonowy, Parrish, Tylko, Wen and Lord10) by the National Aeronautics and Space Administration (NASA) in North America, may be taken as examples, although it is unlikely these exact concepts will be developed beyond the research stage as they are primarily intended to be platforms for the progress of the industry's engineering know-how.
Technologies developed in the field of aerodynamics are of particular interest as they are generally intended for the same objective as formation flight: the reduction of drag. Two topics that have been at the centre of engineers’ efforts for decades are the decrease of lift-induced drag through advanced-design wings and aircraft configurations, and the reduction of skin-friction drag through the use of laminar flow surfaces. Despite the ever-increasing attention and progress in these two areas and the growing momentum of formation flying, no research appears to have been carried out on investigating how they would work together or if they would annul each other's benefits.
If an aircraft had its lift-dependent drag reduced considerably by its design, then the gains that may be achieved with formation flying would be correspondingly low and possibly more difficult to attain. Perhaps more significant is that if an aircraft that relied on laminar flow surfaces flew in a trailing position in a formation, the increased turbulence due to the leader's wakes could trigger early transition and negate any drag savings from the laminar flow technology. Implementing laminar flow in production aircraft is not an easy task(Reference Bertin and Cummings11), as common conditions such as rain or insect contamination can severely damage the laminar flow ability of wings. Hence, increased atmospheric turbulence and changes in the wing lift distribution of the trailing aircraft could affect it, but no direct reference to this has been found in the literature. Forthcoming sections will describe the work carried out to explore the issues thus far discussed.
In any case, formation flying will have to coexist with the new technologies of the next generations of aircraft, because despite its potential it will not be enough to solve aviation's challenges on its own. This reinforces the need stated above: it is key that formation flight is considered from a systems-wide perspective, in an attempt to anticipate its interaction with the other technologies, and this is the motivation behind the work reported here.
2.0 REVIEW OF FORMATION FLIGHT
2.1 Theoretical background
The principle of formation flight is the following. In producing lift for its own flight, a leading aircraft generates vortices and imparts a swirling motion to the air, creating regions of downwash and upwash(Reference Ning8) (Fig. 1). A vehicle that flies in the upwash field of the first can obtain useful energy by increasing its apparent angle-of-attack, which produces an effective rotation of the lift vector and results in a lower lift-dependent component of drag. A significant decrease in drag is achieved with a small upwash angle with a simultaneous negligible increase in lift(Reference Ray, Cobleigh, Vachon and John12).
Vertical induced velocity field due to aircraft wake. Adapted from Ref. Reference Ray, Cobleigh, Vachon and John12.

The reduction in drag may be expressed as the formation drag fraction, dFF (Reference Kless, Aftosmis, Ning and Nemec13):
 $$\begin{equation}
{d_{FF}} = \sum {D_{L,{\rm{formation}}}}\left/\sum {D_{L,{\rm{out}}\hbox{-}{\rm{of}}\hbox{-}{\rm{formation}}}}\right.
\end{equation}$$
where DL is the drag force due to lift-induced effects, or ‘lift-dependent’ drag.
The position of the aircraft flying in formation determines the effect of the formation, especially with respect to the stream-wise (longitudinal or long-track) and span-wise (lateral or cross-track) distances (see Fig. 1), although the vertical offset will also be a significant factor. The distances between the vehicles are normally referred to in terms of wingspans, for instance: ‘aircraft flying at one wingspan’ or ‘a formation with 20 wingspans spacing’. Stream-wise distance is particularly important, and formations are in fact classified in terms of its value.
I. Close formations, generally with less than ten wingspans spacing. Studies originally focused on this type of formation, as it provides the greatest drag benefits. For very small separations (around one wingspan), the leader also experiences a reduction in the power required for flight, albeit not as marked as for the follower(Reference Kless, Aftosmis, Ning and Nemec13). Additionally, the short distances mean the vortices of the leading craft have not changed significantly by the time the trailing aircraft experiences their effect, and from Munk's theorem it can be stated that stream-wise distance should not affect the vortex drag of the formation(Reference Ning8). This means these formations can be analysed with simpler techniques and its effects are easier to quantify.
II. Extended formations, which can be regarded as formations of approximately 10-40 wingspans separation and possibly longer(Reference Ning8) – going beyond the premises of Munk's theorem. The wakes of the leaders will have developed due to inviscid vortex roll-up, as well as the decay and propagation which occurs in a viscous fluid. This means the potential drag savings are smaller, especially beyond 20 spans separation. It also introduces positioning uncertainty as the wake may have displaced enough to make the optimum no longer be located as simply and absolutely with respect to a point of reference in the leading aircraft, such as its wing tip. Consequently determining the location of the wake itself may be needed, which may call for more complex sensors and avionics. However, extended formations are inherently safer than close ones, a key factor for civil flights, and have been gaining so much attention that almost all of recent formation flight work has been on this type of formation.
When formations of more than two aircraft are considered, the shape of the formation becomes another variable. The three main options are the echelon or in-line formation, the V formation, and the inverted-V formation.
2.2. Potential achievements
A number of studies have been produced over the years on the topic, and reductions in the formation drag fraction dFF of up to 45% have been claimed(Reference Bower, Flanzer and Kroo14,Reference Ning, Flanzer and Kroo15) . There is a range of results in the literature arising from the different conditions under investigation, such as the number of aircraft, the type of formation, the proximity, etc. Nevertheless, the lift-induced drag savings quoted are of 20% or higher, and generally 5-20% for fuel burn reductions in representative conditions. Among the various studies completed, those conducted by four research groups in particular deserve special attention.
First, the team at TU Braunschweig and the German Aerospace Centre (DLR), who in the 1980s and 1990s developed the aerodynamic theory of formation flight and very importantly were the first to rigorously conduct a flight test programme measuring the effect of different parameters, especially stream-wise spacing. For the formations studied power savings of 15% were measured, which was very close to the analytical predictions(Reference Hummel16).
In the early 2000s NASA's Revolutionary Concepts Program funded the Autonomous Formation Flight Project in order to explore drag savings and develop control laws for formation flight(Reference Ray, Cobleigh, Vachon and John12). The original target of 10% fuel savings was surpassed, reaching up to 19% lower fuel burn for two F/A-18, becoming at the time the largest fuel savings ever measured during formation flight.
A few years later, researchers at Stanford University were the first to propose extended formations as a practical option for current airliners(Reference Ning, Flanzer and Kroo15), creating models to compute the effect of vortex development in long distances and showing that at least 80% of the benefits of close formations were achievable with extended distances. Other aspects were investigated, such as the effect of compressibility, roll trimming, formations of different aircraft, as well as of different numbers of aircraft. The conclusions included that a three-aircraft formation was likely to be of most interest due to the operational impracticalities of organising more airliners to fly together and the trend in aerodynamic benefits – which reduce asymptotically to a theoretical limit as the number of aircraft increases, with the greatest relative savings being for two and three aircraft. The work of this team raised the profile of formation flight and revived the debate of why this practice had not been considered seriously yet by the industry.
Finally, the Surfing Aircraft Vortices for Energy (SAVE) project is possibly the largest to date that has investigated formation flight. This collaboration between several research institutions and companies in the US is looking in considerable depth into aerodynamic aspects as well as practical and operational considerations(Reference Bieniawski, Clark, Rosenzweig and Blake17). Work has been carried out in the last three years using heavily instrumented USAF C-17 aircraft flying from 18 to 70 wingspans distance, and the results published so far indicate trailing aircraft drag reductions of up to 25% and fuel burn savings of up to 11% for real mission conditions(Reference Haalas, Bieniawski, Whitehead, Flanzer and Blake18,Reference Flanzer, Bieniawski and Blake19) . Alongside the extensive flight testing programme, computational and analytical exercises have been completed, and the agreement between them has been extremely good. Besides being able to predict overall drag savings, other areas have also yielded promising results, such as the estimation of the structure and development of the wakes and the moments induced in the trailing aircraft, or the improvements in the control of the formations.
2.3. Immediate challenges
Despite the clear benefits, there are concerns that need addressing for a successful implementation of formation flying. Possibly first and foremost from a technological standpoint is the challenging design of sensors capable of finding the optimum location in the wake of the leading vehicle, as well as avionics that allow aircraft-to-aircraft communications and situation prediction. Technologies are nevertheless rapidly advancing thanks to the push from the Unmanned Aerial System (UAS) sector, achieving feats such as autonomous in-flight refuelling and swarm flight of numerous Unmanned Aerial Vehicles (UAVs) together. However, whilst this industry is moving fast, it is less conceivable passenger aircraft flying very close to one another will be accepted by the public in the foreseeable future. The psychological factor would likely be excessive to allow such practice in such a safety-cautious industry. This is not to say application of close formation flight should be ruled out in the whole of commercial aviation. The air cargo sector is a good example, since it could readily reap the benefits as shown in studies such as Ref. Reference Bower, Flanzer and Kroo14 without the safety risks of flying aircraft full of passengers at short distances. The fact formation flight with freighter aircraft is a more accessible reality has also been recognised in airspace development plans by NASA(Reference Pahle, Berger, Venti, Faber, Duggan and Cardinal20).
In line with tackling the opposition to formation flying of passenger craft, airworthiness regulations will need to be changed. As found during the review of the standards, it is clearly stated in FAR §91.111 that passenger aircraft are not allowed to fly in formation(21). Nevertheless, both the European Aviation Safety Agency (EASA) and the Federal Aviation Administration (FAA) are considering the issue, the latter having made a proposal to the International Civil Aviation Organization (ICAO) for the implementation of military and civil formation flying(22).
The next challenge is ride quality, covering vibration, noise, turbulence and motion sickness of all occupants caused by the less smooth conditions of flying along a vortex, as well as fatigue, workload and other human factors of the active crew. The SAVE project has considered this, and qualitative ratings and quantitative metrics (in particular the NASA Discomfort Metric) were used, also accounting for the effect of prolonged exposure time(Reference Bieniawski, Clark, Rosenzweig and Blake17). It was found fuel-burn reductions and satisfactory ride quality could be achieved simultaneously. Although encouraging, more work on this area is needed, because the qualitative assessment only included trained employees and military personnel and thus was not representative of civil transport occupants. On the other hand, the great advances in avionics for autonomous formation flying in UAVs could be transferred to other vehicles. This could substantially or completely remove fatigue, additional workload or even competence required by the crew, and potentially address other ride quality issues.
Another concern includes roll stability and control deflection due to the need to balance out the moments created by flying on the wake of a leader and receiving the rising air on one wing only. This leads to trim drag and potentially to aileron buffet. These issues were mostly unaccounted for in the older studies, but the more recent ones have considered it fully, and the drag reductions quoted already include additional trim drag. Aileron buffet has been found not to be a problem at the usual transport Mach numbers(Reference Kless, Aftosmis, Ning and Nemec13). In any case, three-aircraft inverted-V formations would alleviate the problem as the trailing aircraft flies in approximately symmetrical conditions.
Consideration must also be given to ensuring stresses and vibrations imposed on the airframe will not exceed design limits and have an impact on the fatigue life. Also important are guaranteeing no additional engine wear or operability issues, no increased deterioration and maintenance penalty, or no significant effect on the performance and risk of surge of the powerplants. Again the SAVE project has studied this and so far obtained positive results(Reference Bieniawski, Clark, Rosenzweig and Blake17).
Finally, with over 26,000 daily flights in Europe alone(23), it is clear that the implementation in the network would be a challenging task. However, once the first obstacles were solved, it would bring added benefits. For instance, it would help reduce the capacity issues, with Air Traffic Control (ATC) grouping aircraft in formations. The large number of existing flights would also increase the opportunities for grouping up flights, and it could be argued the challenge would in fact be the daily optimisation of the system, because as discussed in Ref. Reference Flanzer, Bieniawski and Blake19 one seemingly advantageous pairing could leave another aircraft with fewer options and lead to a non-optimal situation. Politics will likely play an important part as well. Airline alliances will open up the possibilities, but not sufficiently to cover all flights. It has been estimated that rearranging the aircraft in mid-flight will not be beneficial(Reference Xu, Ning, Bower and Kroo24); hence, a cost-sharing scheme will have to be implemented between airlines to account for the difference in fuel burn between aircraft.
3.0 CASE STUDY OF HIGHLY EFFICIENT AIRCRAFT FLYING IN FORMATION
The Advanced Technology Ultra-Green Airliner (ATUGA), a strut-braced wing aircraft developed as part of the Aerospace Vehicle Design MSc at Cranfield University, was a good candidate to examine the applicability of formation flying for highly efficient craft. A reduction of over 40% in fuel burn per passenger-kilometre compared to current aircraft of similar role(Reference Durango25) had been estimated for the ATUGA in solo flight with the methods that will be described below. Figure 2 shows the features of this medium capacity and medium range passenger transport.
3D visualisation and three-view of the ATUGA aircraft, including its main specifications.
As it can be implied from its name, the aircraft included various advanced technologies aimed at improving its environmental responsibility. Two main characteristics were the wings of large span for low lift-dependent drag and the Natural Laminar Flow (NLF) wing sections for decreased friction drag – for which the aircraft flies at a lower than usual Mach number of 0.7. These improved aerodynamics accounted for a large proportion of the above-mentioned fuel reduction.
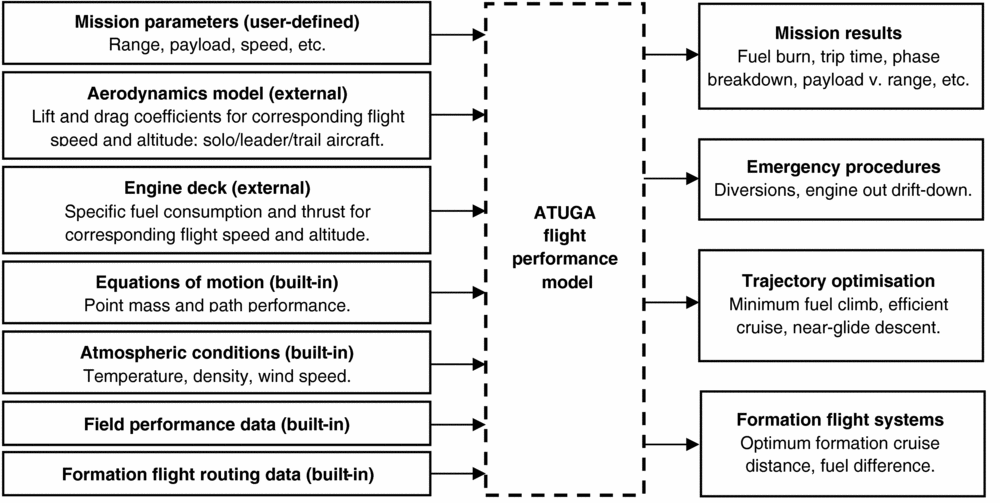
The flight performance of the ATUGA was evaluated with a numerical model created in MATLAB programming, able to compute any mission the aircraft may fly, including regular solo and formation flights. The input/output working process of the performance model is summarised in Fig. 3.
Summary input/output chart for the ATUGA performance model.
The model created was based on classic ‘point mass’ performance theory, see for instance Ref. Reference Eshelby26, with the flight path performance calculated from integration of the estimates throughout the mission, itself defined by the range, payload, speed and altitude inputs. The main simplifying assumptions made were:
• trajectory not affected by the moments acting about the centre of gravity (aircraft in trim)
• only motion in the vertical plane considered
• flight over a ‘flat Earth’ and constant acceleration due to gravity (altitude measured in geopotential terms)
• negligible rate of change of flight-path angle (valid for a commercial transports)
• small values of angle-of-attack
• net thrust equal to gross thrust component minus the intake momentum drag.
The atmosphere was represented by the International Standard Atmosphere (ISA) model(27), as well as off-standard and design atmospheres representing extreme cases(28). The possibility for winds was included. The power plants in the ATUGA were two turbofan engines of bypass ratio 13. The engine parameters were sourced from Cranfield University software and imported into the performance program in altitude-speed tables that would be read and interpolated linearly to obtain the values at the relevant flight conditions.
The drag characteristics of the aircraft were evaluated with a component build-up approach following the techniques of established sources such as Ref. Reference Hoerner29 and Ref. Reference Fink30, and with a vortex lattice method, in particular the program AVL 3.32(Reference Drela and Youngren31). The separate tools were selected to provide a means of cross-checking, but also to make the most of the area for which each was considered more suitable. The methods were used to generate the drag polar at the various altitudes and speeds encountered in flight. They were the most appropriate tools given the time and resource constraints; however, these two techniques are of lower accuracy than those which nowadays are commonplace in industry. Unfortunately the higher-fidelity approaches are not easily applicable during initial phases of design and short time-frame of the Cranfield project. Moreover, as Ref. Reference Torenbeek32 notes, Computational Fluid Dynamics (CFD) methods also have their limitations and may not necessarily result in better predictions than simpler techniques. This is not to say, however, that the ATUGA project could not have benefited considerably from more thorough evaluations of aerodynamics provided by CFD, wind-tunnel testing, etc.
The inputs to the performance program were taken by an overarching script which called several function files that would compute the different parts of the mission, the main ones being climb, cruise, and descent, but also including acceleration, drift-down, and diversion phases and phase optimisation models. Use of MATLAB's own functions was made throughout the code, especially of ordinary differential equation solvers based on an improved version of the explicit Runge-Kutta method with a variable step-size(Reference Moler33).
The performance model was validated against published data and found to be in an agreement with errors of less than 9%(Reference Durango25). Although refinement is clearly advisable for further work, the accuracy was acceptable for the stage of the design covered by the University project. Additional aspects, such as the investigation of the formation flight, were not considered to be unduly affected as their results would be studied on a relative basis, i.e. as delta changes or percentage improvements compared to the solo flight. In any case, the formation flight results would be contrasted with those of the literature and confirmed to be of the expected order of magnitude.
3.1 Analysis of formation flight cases
As just presented, the subject of this work would be civil passenger transports. Taking into account the issues described in Section 2.3 for acceptance of close formation flight with airliners, it was believed that extended formations represented a more realistic scenario for application to the ATUGA. Hence, it will be seen in this section that close formations would only be included in part of the analyses whilst extended formation flight would be investigated to a greater extent.
External studies such as Refs Reference Ray, Cobleigh, Vachon and John12 and Reference Kless, Aftosmis, Ning and Nemec13 show that detailed aerodynamic assessment of formations of aircraft can be a very challenging task requiring sophisticated CFD models alongside extensive computational power, or the ability to conduct flight tests. These methods were beyond the resources of the project, where as previously explained the aerodynamics of the aircraft were assessed with low-fidelity methods. On the other hand, there are sources in the literature that do not use extremely involved methods for part of their work(Reference Hummel16,Reference Slotnick, Clark, Friedman, Yadlin, Yeh, Carr, Czech and Bieniawski34) , and still obtain good agreement between the drag savings estimated with these techniques and with the much higher-fidelity ones used at a later stage in the research. Advanced techniques are in fact mostly needed for the prediction of complex aspects of formation flight such as the development of wakes, the effect on control surfaces, or the vibrations induced in the structure. Thus, vortex lattice modelling was deemed to be a practical compromise of reasonable accuracy as long its use was limited to predicting the change in drag.
One key issue that was found in using the Vortex Lattice Method (VLM) was that vortices would continue downstream indefinitely, and a trailing aircraft would experience the same effect regardless of the stream-wise distance with the leader. This was because no account was given by the model to wake development processes, such as roll-up, decay, and propagation. This was not a problem for close formations, where trailing aircraft encounter wakes soon enough after being shed and so these processes are not significant, but it did pose a difficulty when extended formations were of interest. A means to scale the effect predicted by the VLM to represent an extended formation was sought, but the literature sources focus on either close or extended formation, and so quantified comparisons between the two are not common. The most rigorous analysis found was that of Ref. Reference Ning8, where values were presented for the drag of a close and an extended formation, as well as for the variation seen as the stream-wise distance increases from 10 to 100 wingspans. That analysis considered the effect of wake development. The level of drag reduction obtained from the current vortex lattice model, which was effectively for a close formation, was factored based on the trends given in that reference to estimate the equivalent level of drag reduction at extended distances (10+ wingspans, as defined in the literature review). Moderate atmospheric turbulence and stratification was assumed, an added conservatism as low turbulence states may prevail at high cruising altitudes. Nevertheless, the final impact of this assumption on the results was found to be minor.
Assessment of the aerodynamics of formation flight for the ATUGA design presented a separate issue to those of determining the effect on the lift-induced drag. Flying in the wake of another aircraft could lead to increased turbulence, which could affect the boundary layer on the wing, potentially causing earlier transition to turbulent conditions and diminishing the drag reductions achieved with the natural laminar flow aerofoil. Although air turbulence due to formation flying has been examined in the literature, this has been with the objective of determining its effect on aspects such as structural fatigue and passenger ride quality(Reference Bieniawski, Clark, Rosenzweig and Blake17). No information was found in any source for the effects on laminar flow. It could be argued that the turbulence experienced by the trailing aircraft from the breakdown of vortices would likely be low for stream-wise separations of up to 20 spans at the most common atmospheric conditions, as presented in studies including Ref. Reference Ning8. Thus, turbulence from formation flight at these distances would not cause excessive disturbance to the NLF, but there is also the issue of higher lift coefficients being generated locally on the outboard wing sections of the trail aircraft. This could disrupt the pressure distribution enough from the design aim to impede laminar flow on the aerofoil.
Both issues together would exacerbate the impact, but the actual effect could not be quantified precisely due to the lack of data in the literature and the constraints of the current project. Consequently, it was decided to account for potential penalties by varying the percentage of the zero-lift drag reduction caused by the NLF from 0% (no NLF benefit) to 100% (full NLF benefit). Note this does not refer to the percentage of wing chord to which the NLF extends, but to the proportion of the full delta in zero-lift drag coefficient (ΔCD0) benefit that was not lost in the trailing aircraft. This approach is acknowledged to be rather crude, but served to give an indication in the evaluation of formation flight of the sensitivity of total drag to this effect. The results of a parametric analysis of the aerodynamics, considering both the effect of streamwise distance and loss of NLF, will be presented in the next section. The tip-to-tip separations in the lateral and vertical directions were always kept at a value of zero. Although positioning of the trailing aircraft in the latter two directions has an effect in the drag reduction, the margin for movement of the trail due to real-world uncertainties without causing important penalties is somewhat large, e.g. Refs Reference Ning8 and Reference Kless, Aftosmis, Ning and Nemec13. A tip-to-tip spacing of zero guaranteed being at a position sufficiently close to the optimum for the scope of this study. Including these variables in the above-mentioned parametric analysis would nonetheless be a valuable piece of further work.
Concerning the shape of the formation, a three-aircraft inverted-V formation was selected for the advantage of near-symmetrical loading for the follower. If performed with all aircraft at the same altitude, this shape could lead to a difference in the vertical position of the vortices from each of the leaders as they would not have developed equally when encountered by the trail vehicle. This could impact the drag savings compared to other formation shapes, but based on the margin for movement discussed above, it was considered to be acceptable. In any case, if future results were to disprove this assumption, the issue could be tackled by adapting the position of the two lead aircraft to fly at altitudes that would make their vortices coincide vertically at the point of being met by the trail.
The extended formation at 10 and 20 wingspans shown in Fig. 4 was chosen for a subsequent evaluation of a system of three aircraft with the MATLAB performance program, based on passing a safety assessment of an in-flight malfunction. As was stated when presenting the motivation for this work, assessment of the advantages and disadvantages of a technology requires taking into account the effects of the wider system and its implementation in practical conditions. For the performance of aircraft replacing their normal solo missions for flights in formation, it becomes essential to consider the impacts that aspects such as flight route deviation, mismatch of original departure/arrival times, and additional flight planning constraints may have on the flights themselves, the whole aircraft fleet, or even the global air transport system. Optimisation of a network to include flights in formation is indeed a very complex undertaking, as proven by sources of the literature review such as Refs Reference Flanzer, Bieniawski and Blake19 and Reference Xu, Ning, Bower and Kroo24. Although it was not possible to cover all aspects with this investigation, the assessment was still relevant for the aim of the work, that is the evaluation of formation flight with highly efficient transports.
Vortex lattice model of three ATUGA in an extended inverted-V formation.
The system studied is depicted in Fig. 5. Three aircraft flew missions of the same range from three different origins to three different destinations, ordered such that the ground tracks of the aircraft were parallel. The aircraft were then made to fly part of their mission together, in a way that the mission in the centre was kept unchanged in terms of distance. Moreover, the aircraft flying this central route was assumed to always take the trailing position in an inverted-V formation, and any drag benefits were only experienced by this aircraft – i.e., the second leader did not see any reductions in drag, which was a conservative simplification since in reality it was likely its drag would decrease to some degree, as shown by the literature sources that investigate this type of formation. The drag reduction for the trailing aircraft was kept the same for all the cases and assumed to be the level of reduction obtained with the above-mentioned positioning of the two leader aircraft flying 10 and 20 wingspans ahead. Additionally, it was assumed that a laminar flow benefit of 50% was retained by the trailing aircraft, chosen as a reasonable value given the uncertainty of the effect of formation flying on the NLF.
Geometry and variable definition for three-aircraft formation system study.
In their solo missions, the aircraft flew with a cruise-climb. Although current ATC restrictions permit only stepped cruises, initiatives are in place to improve this and it was assumed cruise-climbs would be possible in the timeframe an aircraft such as the ATUGA would be in service. Nevertheless, a constant Mach and altitude technique was used when in formation. This was because the leader and trailing aircraft would most often have different weight at the rendezvous and would also change mass differently as the follower burned fuel slower, hence they would need to cruise-climb at different rates. This approach was more conservative than what might be done in reality, where cruise-climbing at an intermediate rate between the leader and the trailing aircraft's optimum could be used as a compromise solution.
The variables of the analysis were therefore the mission range, the airport spacing and the rendezvous and split-up distance (which determined the length of the leg flown in formation). The airport spacing was assumed to be the same between the central and both outside airports and also the same for the departure and the arrival airports. All aircraft joined and split up at the same points, which introduced an additional restriction on the system. The minimum distance for the rendezvous was determined by the climb of the central flight (and similarly, for the split-up distance, by the descent) because only the cruise was allowed to be flown in formation. This was because it was assumed that a civil airliner would only fly in formation during the cruise segment, in line with the findings of the literature review. Hence, only this phase of flight was affected in the performance model calculations when analysing the formations. If the rendezvous or split-up distances were longer than the climb or the descent ranges, respectively, then only part of the cruise was performed in formation. The extra distance flown by the deviated aircraft was calculated by trigonometry, and any curvature of the Earth was neglected (this assumption should be revised in future work and spherical geometry introduced because for the longer missions the approximation might start becoming excessive).
In terms of the performance program, the study was carried out by creating a modified version of the main script which would allow calculation of parts of the cruise in formation and parts of the cruise out of formation. An additional script instructed the running of the program for a series of airport spacings and rendezvous/split-up distances for several mission ranges varying from 1,000 nm to 3,000 nm (1,852 km to 5,556 km). The total fuel of the original solo flights would be then compared to the fuel of the leader and trailing aircraft flights for each combination of airport spacing, rendezvous distance and mission range, and the results are given in the next section.
4.0 RESULTS AND DISCUSSION
The results of the evaluation of the aerodynamics are presented in Fig. 6. This carpet plot shows the effect in total drag coefficient, CD, for the trailing aircraft of the inverted-V formation, depending on the distance between the aircraft and the degree to which the NLF benefits are retained, i.e. which proportion of the laminar flow is not disrupted – all of which is given at three different values of the aircraft lift coefficient, CL. The insert bars on the side of the plot for each CL value indicate the percentage change in the trail aircraft CD between solo and formation flight.
Dependence of the drag coefficient of the trailing aircraft in an inverted-V formation on distance, impact on NLF (percentage of remaining benefit) and cruise CL.
The results of the three-aircraft system analysis are shown in Fig. 7. As stated earlier, the values were obtained assuming 10 wingspans formation distance and 50% penalty on the NLF benefit, a condition which is highlighted in Fig. 6 for the relevant lift coefficient. Figure 7(a) shows the optimum distance to cruise in formation, depending on the mission range and the airport spacing. Figure 7(b) gives the fuel difference, for different mission ranges and airport spacings, between the three aircraft flying solo and flying formation missions always with the corresponding optimum formation cruise distance shown in (a). All cases are for flights at cruise Mach number of 0.7 and initial cruise altitude of 35,000 ft (10,668 m), ISA conditions, and no winds. Note that as explained in section 3.1, the aircraft in formation would maintain a constant altitude throughout their cruise, whilst the solo aircraft started their cruise at the same altitude and were then allowed to perform cruise-climb flights.
Formation flight system results vs airport spacing for different mission lengths. (a) Optimum distance to cruise in formation. (b) Difference between solo missions and formation missions (percent of total fuel).
It can be observed in Fig. 6 that in the majority of cases there was a reduction in drag, even when 0% of the NLF savings were attained. The highest drag savings in the plot, achieved with a close formation, correspond to a formation drag fraction reduction of –23.6%. They were modest decreases in drag which would have an impact on the potential fuel savings of the three-aircraft system, as discussed below. Aircraft with long span wings do not lend themselves so easily to drag savings by further decreasing the lift-induced component. Besides the fact previously mentioned that any reductions of an already small amount of lift-induced drag will be proportionally small, another reason is that the vortices shed by the equally drag-efficient leader aircraft are weaker and have less energy that can be extracted by the follower.
The large variation caused by the potential disruption to the laminar flow is apparent in Fig. 6. This demonstrates the importance of conducting further studies to ascertain the true extent by which the NLF wing sections are affected by the turbulence of the vortices. Evaluating formation flying of NLF-equipped aircraft will not be an easy undertaking, this is clear from the large effort and resources put into the BLADE (Breakthrough Laminar Aircraft Demonstrator in Europe) project of the Clean Sky programme to fly just one demonstrator with a working natural laminar flow wing(Reference Gubisch35,Reference Dautriat36) . Nonetheless, if both technologies are to work well together and not simply in isolation, it will be vital to do it – just as it will be vital to keep formation flight in mind when designing and developing other aerospace technologies and systems.
With regards to the level of disruption of the NLF chosen for the subsequent study of the three-aircraft system, since the decision could not be based on literature or other results, a 50% penalty was used as a compromise. If the methods were to be refined, a trade-off investigation on the effect of this decision on the results of the systems assessment could also be a valuable exercise.
Part (a) of Fig. 7 illustrates an important aspect of the three-aircraft formation flying system. As the rendezvous and split-up distances increased, the leg of the journey flown in formation was reduced, with the corresponding lower savings for the trailing aircraft. At the same time, however, the extra distance to cover was smaller for the diverted aircraft, which consequently burned less additional fuel. There was a point where the balance between their fuel consumption reached an optimum, and it led to a decrease in the length of the formation cruise (i.e. an increase in the rendezvous and split-up distances) as the airports became further apart – note that optimum did not necessarily imply a fuel saving, but may refer to the lowest fuel penalty. For airports that were separated by greater distances, the optimum cruise distance was in fact zero, but any fuel savings would have turned into losses long before then.
Part (b) shows that there were benefits for the three aircraft of flying in formation, but they were not so substantial. With an airport spacing of only 50 nm (93 km) the best that could be achieved was less than a 3.5% saving (3,000 nm mission, about 1,300 kg of fuel saved by the formation), much lower than the 16.5% savings claimed by Ref. Reference Bower, Flanzer and Kroo14 for a similar mission scenario and in general less than the fuel burn reductions of the rest of the literature. The savings became losses for airport spacings of just over 10% of the mission range, compared to a value of ~50% in Ref. Reference Bower, Flanzer and Kroo14. This could indicate the conservatism of the assumptions made in the current work, but it is also again a result of the fact that the ATUGA already has low drag and low fuel burn on its own, and further improvements become smaller and smaller.
More promising values might be obtained with fewer restrictions on the variables of the system, for instance allowing different rendezvous points along the route for the aircraft, unequal lengths of mission, the possibility for some of the aircraft to share the departure or arrival airport, relaxed reserves policies, etc. The next stage should also include real routes and, as much as possible, consider real flights, which would pose constraints in departure and arrival times, or in the level of acceptable prolongation of flight times. In seeking realistic conditions, heterogeneous aircraft formations should be considered, as there is a high chance that the vehicles available to group for a formation would not be of the same type. This has been recognised in the literature; for instance, Ref. Reference Bower, Flanzer and Kroo14 uses three freighters of different size and weight for a case study, noting the importance of the arrangement of the aircraft within the formation based on these aspects to attain the highest possible drag savings. Heterogeneous formations are also explored in Ref. Reference Ning8, where the relative fuel efficiency is highlighted as a parameter influencing the position an aircraft should take in the formation. This is in relation to the discussion made above regarding the expected impact on the benefits of formation flight as a function of the span (and indeed the span loading) of the aircraft.
The 0.7 Mach number of the ATUGA, lower than current airliners, could also preclude its use in the longer missions considered. The slower speed adds around 50 minutes of flight time to a 3,000 nm mission, arguably too much to be accepted by airlines and passengers. Highly efficient but slower aircraft such as the ATUGA could be limited to ~2,000 nm flights, while transatlantic and other longer routes could be favoured for aircraft more akin to present ones, with higher drag but also higher savings for flying in formation. This casts further doubt in the potential use for the ATUGA, since it is in the longer missions where its formations attain acceptable gains.
Even if improved with a refined and less restrictive analysis, the results will still raise the questions, is it worth it? Is it worth the reschedules and the increased complexity in air transport network optimisation, avionics, and systems, with all the associated costs, needed to make this work? Is it worth the concerns on airframe structural life, on passenger comfort, and on safety? The small savings estimated would indicate that, in the case of the ATUGA, the answer is likely to be ‘no’. However, it would be unwise to jump to definitive conclusions based on rather preliminary results. It also depends on how much weight is given to environmental concerns (or to the cost and availability of fuel. . .), and given the global trends, this is only going to become increasingly important. Notwithstanding the pessimistic predictions and the multiple concerns and challenges, the option for formation flight capability should be considered early in the design of new aircraft and not as an afterthought. This will help extract a greater benefit and reduce risks, only then could this flying technique become a common sight in the skies.
At this point, it is worth mentioning that there could also be synergies between formation flight and future technologies. For instance, avionics and sensor development would apply to both formation flight and air-to-air refuelling(Reference Morscheck37), a technique being put forward to reduce fuel consumption of long civil missions, admittedly outside the capabilities of an aircraft such as the ATUGA, yet still relevant for long-range airliners. Another example could be distributed propulsion located on the upper surface of the aircraft, which is being proposed for some designs such as blended wing bodies(Reference Felder, Kim and Brown38), and which would eliminate the risk associated with turbulent air ingestion by large individual turbofans. This was not the focus of the present study but would certainly be an interesting area of further work.
5.0 CONCLUSIONS
Formation flight has great potential to help the air transport industry reduce fuel consumption, environmental impact and ATC workload, mostly through an update of the operations of the flight network. Its capabilities are being increasingly demonstrated by research developing numerical models and conducting comprehensive flight test programmes. This work is already addressing many of the concerns associated with flying in formation, most importantly the safety aspect by resorting to formations of extended distances, but additionally, issues such as sensor design, structural fatigue and passenger comfort. Consequently, the concept of formation flight is progressing fast towards becoming a reality, although it is expected its introduction will likely be in phases, starting with military transports, moving on to civil freighters and then finally passenger transports.
For all the progress made, however, there is still a lot to be achieved. This work has highlighted areas that have not been taken into consideration in the research world, but that should be included, because formation flight is not a silver bullet, and it will have to be used in conjunction with other technological developments featured by the next generations of aircraft. Cranfield's ATUGA was used as a case study for the applicability of formation flying to low-drag aircraft designs, and indicated less clear benefits than for current conventional configurations. The fuel benefits for a three-aircraft system were lower than those quoted in the literature for all lengths of flight, and to a certain extent minor in proportion to the fuel savings achieved by one of these highly efficient aircraft on its own versus a conventional craft. Furthermore, penalties would be incurred if the departure and destination airports were separated by more than 10% of the mission range. More accurate and less restrictive analysis could reduce the penalty of a conservative assessment, but this would not radically change the results, leading to the conclusion that, in the case of the ATUGA, formation flying might not be worth all the added complications. However, with the rise of fuel prices and the need to address environmental concerns, the operators and the industry will likely become increasingly motivated to achieve efficiency gains. It is recommended that work is conducted to understand what happens when formation flying is performed with aircraft that have laminar flow surfaces – and indeed any other technology developed to achieve more efficient vehicles. Formation flight should be included in the decisions made during the design of aircraft and wider aerospace systems in order to maximise the benefits of this important lesson from Nature.
ACKNOWLEDGEMENTS
The authors would like to express gratitude to the Royal Aeronautical Society and the Royal Academy of Engineering for the Aerospace MSc Bursary awarded to fund the course tuition fees that enabled this research.