

1. INTRODUCTION
If a firm produces a negative externality, it is blamed for it and it often causes a storm of protest. For instance, when Shell planned to sink its oil storage platform Brent Spar, public and political opposition resulted. There exist many examples for positive externalities as a side effect of payoff maximization too. A poetic example is the case of the honey producer, but knowledge spillovers are also abundant. In contrast to negative externalities it is, however, difficult to find examples that show reward in response to these positive externalities. This asymmetry has been confirmed by the experimental philosopher Joshua Knobe (Reference Knobe2003) who conducted a questionnaire study in which subjects could attribute intentions to the producer of positive and negative side effects. He finds that ‘people are considerably more willing to blame [. . .] for bad side effects than to praise the agent for good side effect’. In his questionnaire study he uses the following two vignettes.
Knobe HARM story
The vice-president of a company went to the chairman of the board and said, ‘We are thinking of starting a new programme. It will help us increase profits, but it will also harm the environment.’ The chairman of the board answered, ‘I don't care at all about harming the environment. I just want to make as much profit as I can. Let's start the new programme.’ They started the new programme, the company increased its profits and the environment was harmed. Question: Did the chairman of the board intentionally harm the environment?
Knobe HELP story
The vice-president of a company went to the chairman of the board and said, ‘We are thinking of starting a new programme. It will help us increase profits, and it will also help the environment.’ The chairman of the board answered, ‘I don't care at all about helping the environment. I just want to make as much profit as I can. Let's start the new programme.’ They started the new programme, the company increased its profits and the environment was helped. Question: Did the chairman of the board intentionally help the environment?
These two stories are almost identical; only the word but was replaced by the word and, and the word harm was replaced by the word help. Seventy-eight people in a Manhattan public park were randomly given one of the two questions. Eighty-two per cent of subjects who had to answer the HARM question said the chairman harmed the environment intentionally but only 23% of subjects who had to answer the HELP question claimed that the chairman helped the environment intentionally. Thus, a small change of words leads to a complete change in peoples’ intuitions. In experimental philosophy this result is known as the Knobe effect or side-effect effect. The Knobe effect turns out to be very robust. It is stable with respect to framing (Adams and Steadman Reference Adams, Steadman, Lumer and Nannini2007; Cushman Reference Cushman2007; Wright and Bengson Reference Wright and Bengson2009), age (Leslie et al. Reference Leslie, Knobe and Cohen2006), cultural background (Knobe and Burra Reference Knobe and Burra2006) and order of presentation (Nichols and Ulatowski Reference Nichols and Ulatowski2008; Wright and Bengson Reference Wright and Bengson2009). Different attempts have been taken to understand the underlying reasons for the asymmetry of the Knobe effect and the structure of the attribution of intention. Knobe (Reference Knobe2006) discusses concepts of intentional action. He finds that the moral dimension of an action is crucial for the perception of intention. Also, he finds that helping can be perceived as intentional if it is considered as morally good. A crucial conclusion ‘is that people's judgment that the behaviour itself is bad can influence their intuitions as to whether the behaviour was performed intentionally and that these intuitions can, in turn, play an important role in the process by which people determine whether or not to assign blame’ (Knobe Reference Knobe2006: 219). Machery (Reference Machery2008) investigates side effects that do not affect others. He confirms the Knobe effect and suggests that trade-offs are decisive for whether people attribute intention to a side effect. Mallon (Reference Mallon2008) criticizes the trade-off hypothesis of Machery and confirms the Knobe effect in situations in which the main goal is to affect others.
Despite the ostensible robustness of the Knobe effect, the use of the word ‘intentional’ is critical in all these studies. It is unclear what people exactly mean when they use the word intentional. However, several studies have shown that the Knobe effect also arises with the words being the intention of (Knobe Reference Knobe2004; McCann Reference McCann2005), desiring (Tannenbaum et al. Reference Tannenbaum, Ditto and Pizarro2007), deciding, in favour of, opposed to and advocating (Pettit and Knobe Reference Pettit and Knobe2009). In order to study the Knobe effect in a language independent way, we translate the two situations of the Knobe questions into a game and conduct a laboratory experiment using monetary incentives. Subjects are the role of the chairman, the environment and the third party who assesses the behaviour of the chairman. The economic incentives are constructed in a way that the chairman can choose whether or not to produce a side effect, which affects the person in the role of the environment. In order to measure the assessment of the third party, we give this person the possibility to reward and punish the originator of the side effect. We use these decisions as a measure for praise and blame for the action. Our use of praise and blame in order to study people's attribution of intention is based on three arguments.
First, the experimental evidence shows that people care about intentions by rewarding and punishing. In the experimental economics literature there is much evidence that people punish negative intentions (Blount Reference Blount1995; Brandts and Sola Reference Brandts and Sola2001; Charness and Rabin Reference Charness and Rabin2002; Nelson Jr. Reference Nelson2002; Offerman Reference Offerman2002; Falk et al. Reference Falk, Fehr and Fischbacher2003; Charness Reference Charness2004; Charness and Rabin Reference Charness and Rabin2005; Charness and Levine Reference Charness and Levine2007; Falk et al. Reference Falk, Fehr and Fischbacher2008) and that people reward good intentions (Charness and Levine Reference Charness and Levine2007; Falk et al. Reference Falk, Fehr and Fischbacher2008).Footnote 1 Our design uses this evidence. We employ peoples’ punishment and reward decisions to infer their praise and blame judgements.
Second, we relate blame and praise to game-theoretical concepts of intention (e.g. Rabin Reference Rabin1993; Dufwenberg and Kirchsteiger Reference Dufwenberg and Kirchsteiger2004; Falk and Fischbacher Reference Falk and Fischbacher2006). We suggest a concept of intention that is based on the underlying motive that drives the action. We investigate this concept in situations in which the side effect affects the well-being of others. In these situations we assume a selfish motive and a – positive or negative – concern for others as in the model of Levine (Reference Levine1998). In this model an action is considered as intentionally bad if it is caused with a bad intention, i.e. if it is caused based on a bad motive. Analogously, an action is considered as intentionally good if it is caused with a good intention, i.e. if it is caused based on a good motive. Thus, in this model, the assessment of intention is not based on the action itself but on the underlying motive. This can capture how people interpret the intention question in Knobe's questionnaire because the question is not whether it was intentional to perform the action but whether it was intentional to create the side effect. Therefore we have to address the question whether people wanted to cause this side effect, i.e. whether the side effect is relevant for the decision. Although many people may care about the side effect, they might differ in how much they care about it, i.e. there are different types. In the harm condition there are some people who do not care about the side effect but there are some who care about the side effect and would not start the programme. This means that we can conclude that those who started the project had the intention to refrain from protecting the environment. More generally, if people differ in how much they care about the environment, we can infer their type from their action.
Third, we can use the experimental findings to identify potential situations where the Knobe effect is present, disappears or reverses and test them in a questionnaire.
Thus, in this paper, we take four steps. First, we translate the Knobe questionnaire into language-independent incentivized games. Second, we measure blame and praise using punishment and reward. We confirm the Knobe effect in one situation and present situations in which the effect vanishes or even reverses. Third, we relate reward and punishment patterns to the theoretical intention concept based on Levine (Reference Levine1998) outlined above. Fourth, we retranslate one experimental game into a questionnaire and generate a vignette in which the Knobe effect vanishes. The paper is organized as follows. In the next Part, we present the experimental design and procedure. In Part 3 we describe our hypotheses. Experimental results are given in Part 4. Part 5 presents design and procedure of our questionnaire study. Part 6 presents the questionnaire results. Part 7 discusses and concludes.
2. EXPERIMENTAL DESIGN AND PROCEDURE
In order to challenge Knobe's claim that people are willing to blame others for negative foreseen side effects, but are not willing to praise them for positive ones, we use the following basic three player game. Player 1 (who corresponds to the chairman of the board) has to choose between two allocations X and Y. We frame allocation X as default and give player 1 the option to change to allocation Y. The default X represents the firm's and environment's situation at the time when vice-president and chairman of the board are talking in their office. Y represents the situation after the start of the programme. As we are interested in whether people are influenced by the caused side effects, we control for other possible influences and use the same allocation Y for both kinds of side effects. The games differ only in the default allocation X.
A third player, player 3, takes the role of the reader of the story. He is not involved in player 1's decision. After learning player 1's choice, player 3 is free to transfer points from player 1 to player 2 or the other way around. This transfer is costless for player 3, since we are interested in all participants’ assessments of intentionality and not only in the non-selfish participants’ transfer. Player 3 receives an endowment of 100 points independent of player 1's decision. Therefore, player 3's decision is not affected by envy or fear of retribution. By this means we ensure that player 3's decisions accurately reflect his praise and blame judgements.
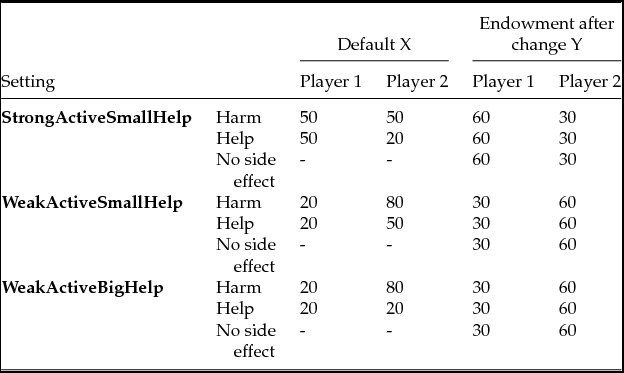
Since the Knobe questions neither provide information on specific losses and gains for the firm and the environment, nor on their relative endowments, the stories leave it to the participant to form a view of the situation. With our design we introduce three concrete and precisely defined settings how readers might perceive and understand the story. We vary the relative endowments of the active player 1 and the passive player 2 as well as the strength of the positive externality. We keep the strength of the negative externality constant across all three settings. The setting StrongActiveSmallHelp corresponds to how we think most people understand the story. A strong active agent affects a weak passive one. Harming really harms and helping helps only weakly. We use StrongActiveSmallHelp in order to confirm the Knobe effect in the laboratory. In WeakActiveSmallHelp we switch the economic status of the two agents. In this setting, a weak active agent affects a strong passive one. The size of the side effects is as in StrongActiveSmallHelp. In WeakActiveBigHelp we increase the size of the positive side effect. Harming still harms, but helping now also really helps. Each setting consists of three games: In the first game (harm) the allocation Y can be reached through negative side effects. The second game (help) involves positive side effects in order to reach Y. The third game (no side effect) does not include any side effects. It is simply the allocation Y without any alternative as control for player 3's general inequality aversion. We now explain the parameters of the three settings in detail, which are listed in Table 1. In StrongActiveSmallHelp player 1 is in an economically stronger position than player 2. The endowment after the change is 60 points for player 1, compared with 30 points for player 2. In the help as well as in the harm condition, player 1 gains 10 points from causing the side effect. In the harm condition, he causes a rather large damage of 20 points; in the helping condition, he increases player 2's income by only 10 points.
Allocations in the three settings.

In all questionnaire studies conducted so far, such as Knobe (Reference Knobe2003), Leslie et al. (Reference Leslie, Knobe and Cohen2006), Mallon (Reference Mallon2008), Machery (Reference Machery2008) or Wright and Bengson (Reference Wright and Bengson2009), the producer of the externality holds the higher economic status. In order to test whether this is the underlying reason for the Knobe effect, we switch the economic status of the agents in the settings WeakActiveSmallHelp and WeakActiveBigHelp. In these settings player 1 is in an economically weaker position than player 2. The endowment after the change is 30 points for player 1, compared with 60 points for player 2. As in StrongActiveSmallHelp, player 1 gains 10 points from causing the positive side effect, and in the harm condition, the damage equals 20 points. The two settings differ in the extent of the positive externality. In WeakActiveSmallHelp, helping increases player 2's income by 10 points – as in the setting StrongActiveSmallHelp. In the setting WeakActiveBigHelp, helping increases player 2's income by 40 points.
There are three main advantages of our design. First, as pointed out above, using monetarily incentivized decisions allows us to model many different settings without the use of language. Second, we use a technology similar to Croson and Konow (Reference Croson and Konow2009) that allows a direct comparison between reward and punishment. Many studies analyse only one kind of targeted interaction – either reward or punishment. In these studies both reward and punishment are costly (e.g. Bolton et al. Reference Bolton, Brandts and Ockenfels1998; Offerman Reference Offerman2002; Charness and Levine Reference Charness and Levine2007; Falk et al. Reference Falk, Fehr and Fischbacher2008; Rand et al. Reference Rand, Dreber, Ellingsen, Fudenberg and Nowak2009). Therefore, punishment is efficiency reducing, while reward is not. This means that effects cannot be directly compared and punishment and reward must be treated separately. Our approach enables us to perfectly compare reward and punishment. Since reward and punishment are costless for the punisher, punishment is equivalent to withholding reward and vice versa. Thus, we get a clean direct comparison of positive and negative reciprocity. In this way, we are able to bring experimental philosophy into the laboratory and test subjects’ behaviour in a controlled environment with real monetary consequences. Third, with the treatment ‘no side effect’ we control for inequality aversion.
2.1 Procedure
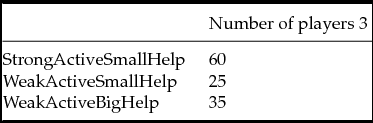
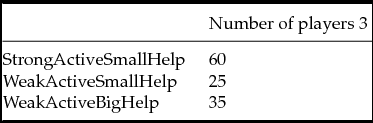
We conducted 8 sessions in the time between January and June 2009. All sessions were conducted at the LakeLab (TWI/University of Konstanz) with a total number of 180 participants (60 subjects each of type 1, 2 and 3). None of the subjects participated in more than one session. Three sessions consisted of StrongActiveSmallHelp and WeakActiveSmallHelp and five sessions included StrongActiveSmallHelp and WeakActiveBigHelp. This means all participants were in the setting StrongActiveSmallHelp, 75 of them were additionally in setting WeakActiveSmallHelp and the remaining 105 subjects were additionally in setting WeakActiveBigHelp. Every setting consists of three games. Therefore, every player 1 made four decisions (since he did not have to take a decision in the no side effect games) and every player 3 made six decisions.Footnote 2 Before the experiment started, subjects were randomly assigned to their role as player 1, 2 or 3. Each subject sat at a randomly assigned PC terminal and was given a copy of instructions.Footnote 3 A set of control questions was provided to ensure the understanding of the game. The experiment did not start until all subjects had answered all questions correctly. We use a within-subject design in order to be able to distinguish inequality aversion from punishment and reward. In every game, players were rematched, and they played the games in randomized order. The ‘no side effect’ games were played after the other games at the end of the experiment. Subjects did not receive feedback until the end of their sixth game in order to avoid learning. For each game player 1 and 2 received the payoff from the allocation and the points assigned by player 3. Player 3 received 100 points for every game. For player 3 we use the strategy method. That means, without knowing player 1's decision, player 3 redistributes points for both possible decisions.Footnote 4 One point was converted into 0.01 euros. The experiment took about 30 minutes, average income of a participant was 3.77 euros ($4.87). This experiment was conducted after another unrelated experiment.Footnote 5
Number of players 3 across settings.
3. HYPOTHESES
In this section, we analyse the theoretical predictions for player 3's decisions when allocation Y has been chosen (in the Knobe questions: when the programme has been started). In each setting, this allocation is the same for the three games. Thus, we can compare player 3's redistribution in the case when the outcome resulted from player 1 helping or harming or when player 1 had no impact at all. The Knobe effect describes that participants are more willing to blame other people for negative foreseen side effects than to praise them for positive ones. In our experiment we measure praise and blame via reward and punishment. If player 3 assigns fewer points to player 1 in the harming game than in the game with no side effects we define it as punishment. If player 3 assigns more points to player 1 in the helping game than in the game with no side effects we define it as reward. If the Knobe effect persists in our experimental economic framework we should expect that player 3 punishes player 1 for negative side effects but does not reward him for positive ones. Therefore, the absolute difference between the amount of transferred points to player 1 after a decision including negative side effects and the game with no side effects included should be higher than the absolute difference between the amount of transferred points to player 1 after a decision including positive side effects and the game with no side effects. Reward and punishment should not differ across settings. This is captured in Hypothesis 1.
Hypothesis 1 (Knobe Hypothesis)
Punishment after harming is higher than reward after helping in all three settings.
Based on the behavioural evidence, various economic theories have been developed in which intentions are modelled. In the models of Rabin (Reference Rabin1993), Dufwenberg and Kirchsteiger (Reference Dufwenberg and Kirchsteiger2004) and Falk and Fischbacher (Reference Falk and Fischbacher2006) intentional kindness or unkindness is inferred from which choice has been made – taking into account the available alternatives. In the model of Rabin and, similarly in the model of Dufwenberg and Kirchsteiger, the kindness of an action depends on the payoff that results for the other player. In the case of a dichotomous decision, the action associated with the lower payoff is always considered as unkind. This corresponds to the harm vignette. If the action yields a higher payoff for the other player, its kindness depends also on the own payoff. The models define the action as kind only if it decreases the own payoff. Otherwise, the action is neither defined as kind nor unkind. This is the situation of the help vignette. In these models causing the negative side effect is unkind but causing the positive side effect is not kind. Thus, these models also predict the Knobe effect.
A different approach has been taken by Levine (Reference Levine1998) who measures the intention with the type of a player. In this model, people differ in how they value the other players’ types and are rewarded and punished based on their type. This weight can be positive, in which case the player is altruistic, or negative, in which case he is spiteful. Since their type is not known to the other players it has to be inferred from the action. The game theoretical solution concept is the Bayesian equilibrium. Since there is often not a unique equilibrium, we empirically check whether reward and punishment behaviour is consistent with the behaviour of the players 1. According to the model of Levine, a kind action is the kinder the fewer people choose this action, just because the kindest 10% are kinder than the kindest 50%. This model predicts punishment for harming but also reward for helping. The extent of reward and punishment depends on the average kindness or unkindness of the players who have chosen a particular action. This means that the more people make a particular unkind decision, the less unkind is this decision on average. The more people make a particular kind decision, the less friendly is this decision on average. Thus, we can derive a specific hypothesis how the aggregate behaviour of players 1 is related to reward and punishment.
Hypothesis 2 (Levine Hypotheses)
(a) The more players 1 choose to harm player 2, the less player 3 punishes.
(b) The more players 1 choose to help player 2, the less player 3 rewards.
Note, that this hypothesis does not necessarily predict the Knobe effect. For example if few people create the positive externality, they would be recognized as kind and rewarded.
4. EXPERIMENTAL RESULTS
We structure the results in the following way: First, we present the experimental results focusing on player 3's transfer decisions. Second, we test the Knobe and Levine Hypotheses. Finally, we present the results of the questionnaire studies. Details on statistical test results are given in the Appendix.
We are interested in player 3's decisions when allocation Y has been chosen. For each setting there are three games with different side effects: positive, negative and no side effects. Allocation Y stays the same for the three games. Thus, we can easily compare player 3's transfer depending on positive side effects, negative side effects or no side effects.
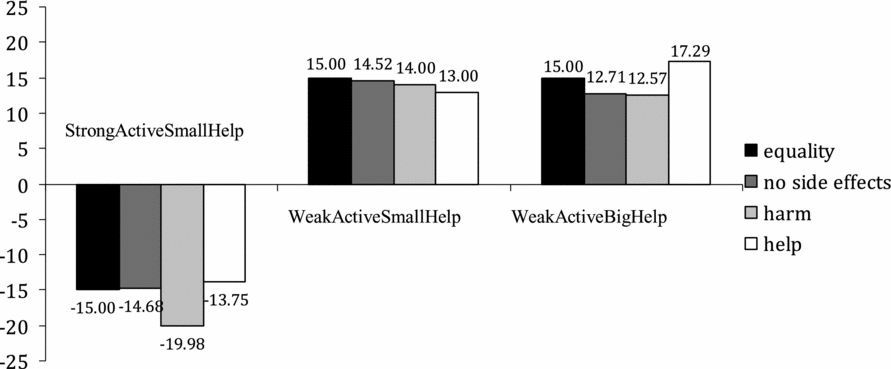
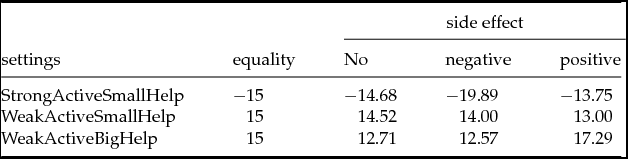
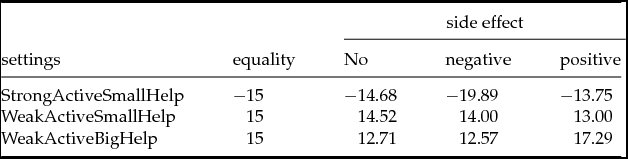
Figure 1 shows the transfer of player 3 from player 1 to player 2 for all settings. If player 3 cares for equality of allocations, we should expect that he redistributes points from the richer to the poorer. In order to equalize payoffs, player 3 would have to transfer 15 points. These 15 points hold for a benchmark and are given by the variable equality. No side effect shows the transferred points for the control game without side effect. Transferred points from player 2 to player 1 in the harm and help condition are given in negative and positive side effect, respectively. In all games with no side effect, participants use the redistribution to reduce inequality. Payoffs after redistribution do not significantly differ from equality. This is consistent with behaviour induced by inequality aversion. Also in the games with side effect, player 3 reduces inequality. However, his transfer differs between the different situations. We discuss in the next section how exactly side effects affect the participants’ transfer decision.
Transfer to player 1 from player 2 by player 3
4.1 Knobe Hypothesis
The Knobe effect describes the effect that people blame others for negative side effects but do not praise them for positive ones. In our experiment we measure blame and praise by reward and punishment. We compare player 3's monetary transfers for agents having caused a side effect with transfers for agents having caused no side effect. If player 3 assigns fewer points to player 1 in the harming game than in the game with no side effects we define that as punishment. If player 3 assigns more points to player 1 in the helping game than in the game with no side effects we define this as reward.
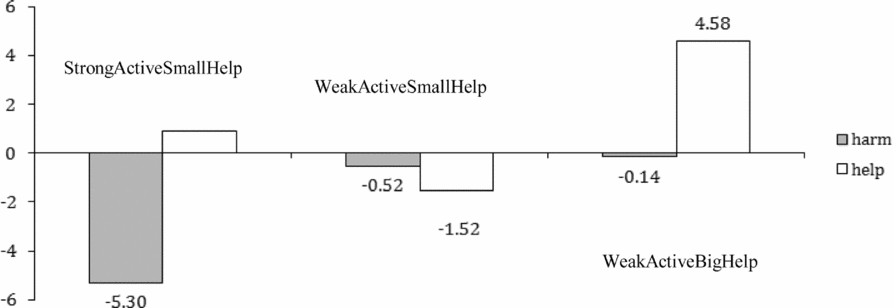
Punishment and reward are therefore independent from inequality aversion. To simplify the analysis we define the variable net transfer as transferred points from player 2 to player 1 minus transferred points in the control game no side effect. Figure 2 shows the net transfer of player 3 from player 1 to player 2 for all settings. We now discuss the three settings.
Net transfer to player 1 by player 3. Net transfer = transferred points from player 2 to player 1 after an externality minus transferred points in the control game no side effect.
Setting StrongActiveSmallHelp
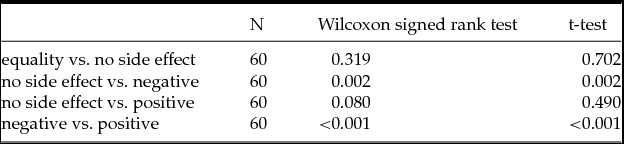
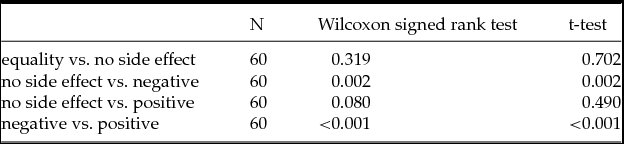
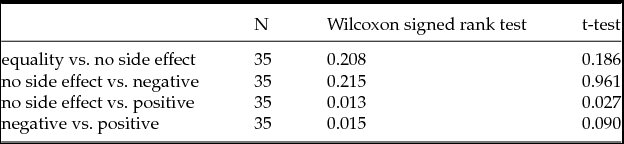
Players 3 punish player 1 for a harming side effect. However, they only slightly reward them for a helping side effect. We find significant differences for net transfer between the games with negative and positive side effect. That shows that subjects react more strongly to negative than to positive side effect. To summarize: If the active agent holds the higher economic status and the positive side effect is relatively small, participants do not reward others for positive side effect but punish them for a negative one. This confirms the Knobe effect for this setting.
Setting WeakActiveSmallHelp
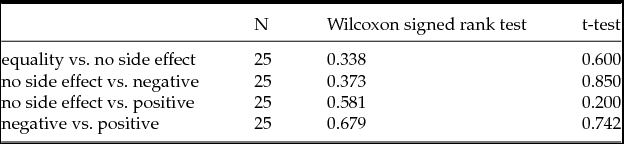
We do not find that side effects matter in WeakActiveSmallHelp. Subjects do not punish the producer of negative side effects nor do they reward the producer of positive ones. An active agent with lower economic status leads the third parties to ignore all side effects. The agents’ economic status essentially affects the appearance of the Knobe effect. When the producer of the externality holds the lower economic status, participants neither punish him for negative side effects nor do they reward him for positive ones. The results of WeakActiveSmallHelp also give evidence that the efficiency loss in the harm game is not the driving force behind the Knobe effect. The efficiency loss is still present. However, the Knobe effect has vanished.
Setting WeakActiveBigHelp
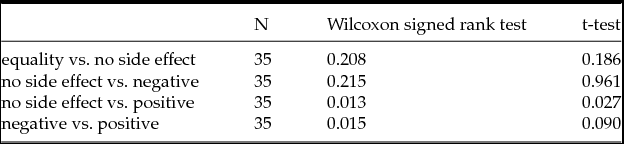
We used the additional setting WeakActiveBigHelp in order to test how people's willingness to reward and punish foreseen side effects depends on the size of the positive side effects. We find that subjects do not punish player 1 for negative side effects in WeakActiveBigHelp. However, subjects do reward others for caused positive side effects. We also find significant differences in net transfer between the games with positive and negative side effects. These findings reverse the Knobe effect. When the positive side effect is sufficiently large and the producer of the externality holds the lower economic status, participants reward others for positive side effects but do not punish them for negative ones.
To summarize, we can replicate the Knobe effect in the laboratory, but we also found situations where the Knobe effect does not exist. The Knobe effect seems only to arise in situations where the producer of the side effect holds the higher economic status and the positive side effect is small. Switching economic status makes the Knobe effect vanish. The Knobe effect is even reversed in a setting with large positive side effects. So we cannot confirm the Knobe Hypotheses. In the following section we are going to test the Levine Hypotheses.
4.2 Levine Hypotheses
The model of Levine (Reference Levine1998) predicts punishment after harming but also reward after helping. Concretely, the more people take a particular unkind decision the lower the punishment is for this decision. The more people take a particular kind decision the lower the reward is for this decision. In this section we compare our results with these theoretical predictions by Levine. Following Levine we should expect that punishment for a negative externality and reward for a positive externality is negatively correlated with the share of players 1 producing this externality.
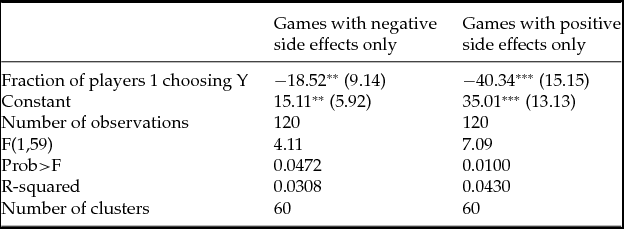
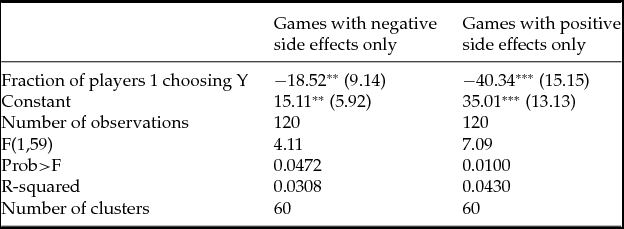
This is exactly what we find. The more players 1 choose to harm or to help, the less they are punished or rewarded, respectively. We find that it is not the harming or helping side effect per se that makes people judge whether a person was acting intentionally and is therefore to blame or to praise. It is rather the relative (un)friendliness of an action. Our findings are in line with Levine's predictions and confirm Hypotheses 2a and 2b. Punishment and reward significantly depend on the fraction of players 1 who choose to harm or reward. See the Appendix for statistical details.
5. DESIGN OF THE QUESTIONNAIRE-STUDY AND PROCEDURE
In order to close the circle and return to experimental philosophy, all 180 participants were asked to answer both Knobe questions at the end of the experiment.Footnote 6 Participants received the questions in randomized order. The answers to the questionnaire studies had no consequences on the participants’ payoff. Additionally, we conducted a second and a third questionnaire study. Each of these two questionnaires studies contained two stories similar to the Knobe stories.
In the original Knobe questions participants are informed about the chairman's interest in the environment. This information is not available in the experiment. If participants do not explicitly receive this information, they might nevertheless have an intuition about the interest of the other player and this could affect results. Thus, in order to make the experiment and the questionnaire comparable, we had two options, an additional experiment or an additional questionnaire. We decided for the second and much easier option: An additional questionnaire study where people were not informed that the agent ‘doesn't care at all’. In order to prove that the Knobe effect and our results do not depend on this statement, we adapt the stories in the following way.
Knobe (no statement) HARM story
The vice-president of a company went to the chairman of the board and said, ‘We are thinking of starting a new programme. It will help us increase profits, but it will also harm the environment.’ The chairman of the board answered, ‘Let's start the new programme.’ They started the new programme, the company increased its profits and the environment was harmed. Question: Did the chairman of the board intentionally harm the environment?
Knobe (no statement) HELP story
The vice-president of a company went to the chairman of the board and said, ‘We are thinking of starting a new programme. It will help us increase profits, but it will also help the environment.’ The chairman of the board answered, ‘Let's start the new programme.’ They started the new programme, the company increased its profits and the environment was helped. Question: Did the chairman of the board intentionally help the environment?
In WeakActiveSmallHelp and WeakActiveBigHelp we analyse whether the economic status of the agents is crucial for the Knobe effect. That is why we also conduct an additional questionnaire study with a weak active agent affecting a strong passive agent.
McDonald HARM story
The vice-president of a small fast-food restaurant went to the chairman of the board and said, ‘We are thinking of launching a new burger. It will help us increase profits, but it will also harm McDonald's next door.’ The chairman of the board answered, ‘I don't care at all about harming McDonald’s. I just want to make as much profit as I can. Let's launch the new burger.’ So the company launched the new burger, increased profits and McDonald's next door was harmed. Question: Did the chairman of the board intentionally harm McDonald’s?
McDonald HELP story
The vice-president of a small fast-food restaurant went to the chairman of the board and said, ‘We are thinking of launching a new burger. It will help us increase profits, but it will also help McDonald's next door (for example due to higher pedestrian flow).’ The chairman of the board answered, ‘I don't care at all about helping McDonald’s. I just want to make as much profit as I can. Let's launch the new burger.’ So the company launched the new burger, increased profits and McDonald's next door was helped. Question: Did the chairman of the board intentionally help McDonald’s?
We presented the Knobe (no statement) HARM/HELP stories to 82 subjects at the LakeLab (TWI/University of Konstanz). The McDonald HARM/HELP stories were presented to 63 subjects at the LakeLab and to 34 students at the University of Zurich. Participants received the questions in randomized order with no apparent order effects. The experiment and the questionnaires were programmed with z-Tree (Fischbacher Reference Fischbacher2007). We recruited participants using the online recruiting system ORSEE (Greiner Reference Greiner2004).
6. RESULTS OF THE QUESTIONNAIRES
The results of the last sections show that the economic status of the agent causing an externality is a crucial determinant of the Knobe effect. For the sake of completeness we verify this result by conducting three additional questionnaire-studies. The first study contains the two original Knobe questions. In the second study we modify the original stories by eliminating the part: ‘I don't care at all about harming the environment. I just want to make as much profit as I can.’ We control whether our experimental results depend on the missing statement on the chairman's attitude to the environment since our experiment did not include this statement of the chairman on not caring about the environment. In the third questionnaire study we modify the original stories by switching the economic status of the agents.
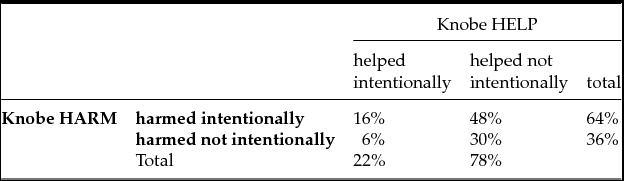
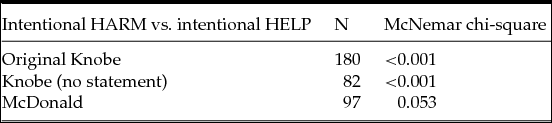
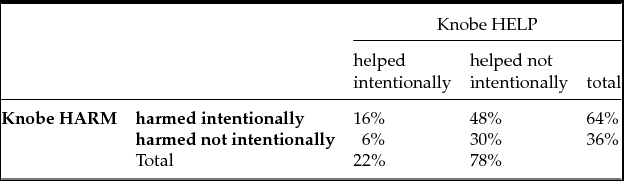
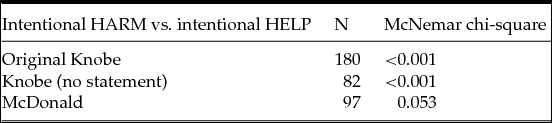
We present the results of the Knobe HARM/HELP questions in Table 3. They reflect Knobe's original results. Sixty-four per cent of the 180 participants state that the firm intentionally harmed the environment, but only 22% think that the firm intentionally helped the environment. This difference is significant. On the basis of a within-subject comparison, we find that 48% of the participants think that the firm intentionally harmed but did not intentionally help the environment. Six per cent of the subjects state that the firm intentionally helped but did not intentionally harm the environment. Thirty per cent and 16% say that the firm harmed and helped intentionally or did not harm and help intentionally, respectively.Footnote 7 As in StongActiveSmallPositive we confirm the Knobe effect.
Percentage of participants who state intentionality in the Knobe questions.
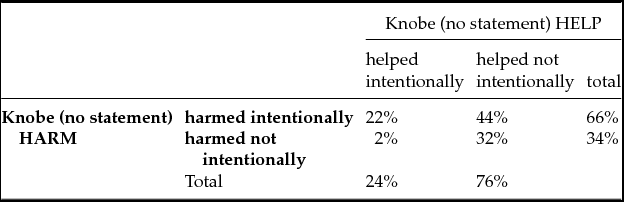
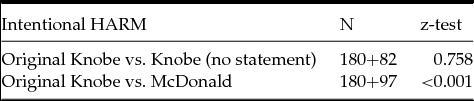
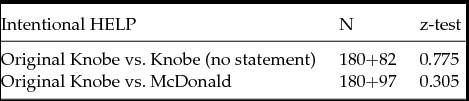
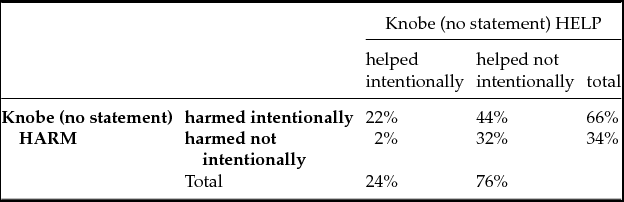
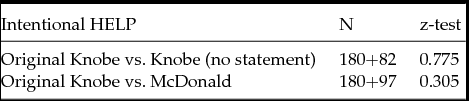
We also confirm the Knobe effect in the Knobe (no statement) HARM/HELP questions. Table 4 shows that 66% of the 82 participants think that the firm intentionally harmed the environment. Only 24% think that the chairman intentionally helped the environment. This difference is significant. These results are not statistically different from the results of the original Knobe questions. We therefore conclude that behaviour does not depend on the missing statement on the chairman's attitude to the environment.
Percentage of participants who state intentionality in the Knobe (no statement) questions.
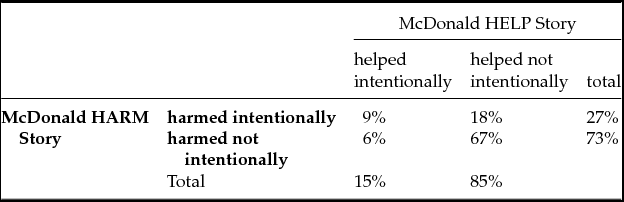
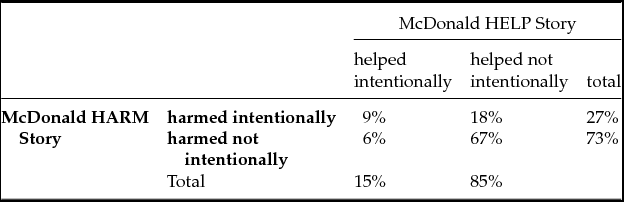
The results of the McDonald HARM/HELP questions are presented in Table 5.Footnote 8 The share of the 97 participants saying that the firm intentionally helped McDonald's (15%) does not differ from the share of participants (22%) that stated intentionality in the original Knobe helping vignette. However, there is a significant decrease in the share of people thinking that the firm intentionally harmed McDonald's (27%) compared with the share in the original Knobe harming vignette (64%). As in the experiment, the perception of negative intentionality depends on the active agent's economic status.
Percentage of participants who state intentionality in the McDonald questions.
7. CONCLUSION
This paper uses experimental economic tools to approach a problem intensively discussed in the philosophical literature. We analyse the economic determinants of situations in which the Knobe effect arises. Knobe (Reference Knobe2003) states that ‘people are considerably more willing to blame (. . .) for bad side effects than to praise (. . .) for good side effects’. This paper analyses this asymmetric behaviour and tests the stability of the Knobe effect. We use an experiment with monetary incentives to test for its robustness. Our design abstains from the use of any specific language terms and formalizes the two original Knobe vignettes in a neutral way according to game theoretical structure. This means our design does not imply a particular frame with respect to language terms. Instead, it provides a specific frame with respect to the economic parameters of the situations. While the original vignettes leave it to the readers to form a specific view of the situation, our design gives the participants direct specifications of the situation. We use monetary incentives in different settings varying the economic status of the agents and the size of the side effects.
Using monetary incentives instead of setting up hypothetical situations in a questionnaire has four main advantages. First, the games can be formulated in a neutral frame. Words like intentional, chairman, company, harm or help do not appear. Second, since the incentives form a game, game theoretic methods and concepts can be used to analyse the effect. In particular, different theoretical models can be applied to the situations. So, the Knobe effect can also contribute to our understanding of social preferences. Third, we can control the economic parameters of the situation. The original vignettes do not indicate any details on the agents’ economic status nor the extent of the side effects and, therefore, leave it to the participant to form a view of the situation. Since we translate the Knobe vignettes into a concrete economic situation we control for this view. In particular, we control the economic status of the involved parties and the extent of the externality. Fourth, we can vary the economic parameters to test the robustness of the effect. Since all questionnaires conducted so far neglected the relative economic status of the agents and the specification of the size of side effects, we use three different settings in which we focus on these variables. By analysing the impact of crucial economic determinants we investigate the stability and robustness of the Knobe effect.
Our study also makes a methodological contribution. So far studies dealing with the Knobe effect used questionnaires to elicit people's intuitions on intentionality. In this study, we use a laboratory experiment with monetary incentives. This means that people's decisions are not hypothetical but have a direct consequence on others. We use reward and punishment as proxies for people's judgement of praise and blame for producers of positive and negative side effects. Although we cannot prove that the perception of intention is identical to the assignment of blame and praise, our results on blame and praise can help (and helped us) to find situations in which the Knobe effect disappears or reverses. Our approach provides a clean direct comparison of praise and blame, since we use redistribution instead of costly reward and punishment. We find the Knobe effect does not depend on language but on the economic determinants of the situation such as economic status and the size of the positive externality. The technology is of great use to future studies dealing with praise and blame.
Our theoretical approach is based on Levine (Reference Levine1998). It assumes that the more people show a particular bad behaviour, the more normal and accepted this behaviour is in society. Thus, if people think that a specific harming action is not morally wrong, most agents will commit this action. According to this reasoning the more players choose to harm or help, the less they are punished or rewarded, respectively. This concept is related to Knobe (Reference Knobe2006) who points out that for the perception of intention it matters whether an action is perceived as morally wrong, and that a harming action does not necessarily have to be morally wrong. The concept of Levine (Reference Levine1998) gives us an empirical gradual measure about the morality of a harming or helping action.
We find that it is not the harming or helping side effect per se that makes people judge whether a person was acting intentionally and is therefore to blame or to praise. It is rather the relative (un)friendliness of an action. Or as Knobe (Reference Knobe2006) suggests: ‘When people are wondering whether or not a given behaviour was performed intentionally, they are sometimes influenced by their beliefs about whether the behaviour itself was good or bad.’
8. APPENDIX
8.1 Statistical results
Knobe Hypotheses
Mean transfer to player 1 by player 3 when Y is chosen.
p-values for StrongActiveSmallHelp.
p-values for WeakActiveSmallHelp.
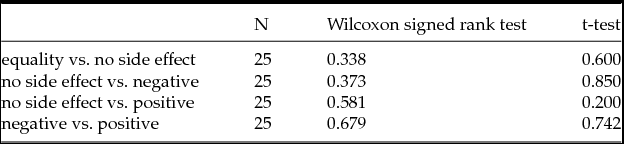
p-values for WeakActiveBigHelp.
Levine Hypotheses
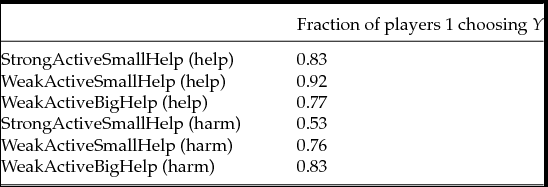
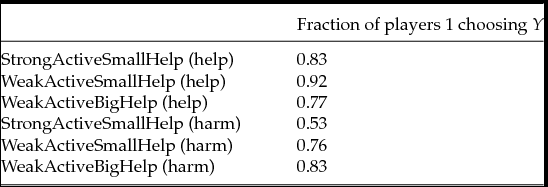
Table 10 shows the decisions of players 1. In Table 11 we report the results of two regressions. We use the fraction of players 1 choosing Y as a predictor of punishment and reward. The first regression shows that punishment is indeed negatively correlated with the share of people who choose the unkind allocation Y. The second regression shows that reward is negatively correlated with the share of people who choose the kind allocation Y.
Decisions of player 1.
Regression with robust standard errors, clustered on subject. Dependent variable: net transfer, i.e. punishment in first column and reward in second column, standard errors in parentheses
8.2 Statistics – Questionnaires
p-values.
p-values.
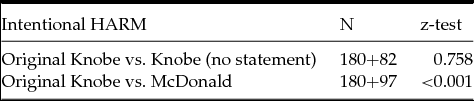
1 p-values.
8.3 Instructions – Player 1
There will now take place an additional experiment. In this experiment there are players 1, players 2 and players 3. This experiment is not related to the first experiment. The participants are rematched. A player A in the experiment can now be a player 1, 2 or 3. Also the players B and C are now players 1, 2 or 3. You are a player 1.
Also during this experiment we do not use euros but points. All points you receive during the experiment will be changed into euros at the end of the experiment: 100 points = 1 euro. The following pages give you instructions on the course of the experiment. First, we are going to explain the basic situation. After having read the instructions you are going to find some control questions on the screen. The experiment will start as soon as all participants are familiar with the experiment. THE EXPERIMENT: There are 6 decision situations. One group contains one player 1, one player 2 and one player 3. For every decision round the groups are going to be rematched. Before the decision starts, all participants learn the initial situation. In the next step you can change this initial situation. After your decision, player 3 can transfer points from you to player 2 or from player 2 to you. Player 2 does not have to make a decision. We are going to explain the decision situation in the following example. EXAMPLE: You receive 30 points and player 2 receives 50 points. You can keep this initial allocation or change it. If you change it, you receive 10 points more, which is a total of 40 points. In this case player 2 receives 20 points more, which is a total of 70 points. Player 2 does not make a decision.
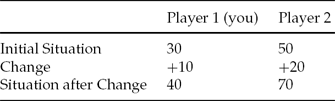
At the beginning of every round, player 3 receives 100 points. After your decision player 3 can transfer points from you to player 2 or from player 2 to you. For example he can take away points from you in order to give them to player 2. Or you can take away points from player 2 in order to give them to you. Assume you keep the initial situation and player 3 transfers 5 points from player 2 to you. Then the allocation looks like this:
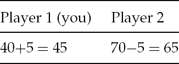
Assume you change the initial situation and player 3 transfers 20 points from you to player 2. Then the allocation looks like this:
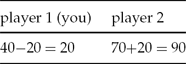
By now clicking on the OK button you will receive some control questions that you can answer directly on screen.
8.4 Instructions – Player 2
There will now take place an additional experiment. In this experiment there are players 1, players 2 and players 3. This experiment is not related to the first experiment. The participants are rematched. A player A in the experiment can now be a player 1, 2 or 3. Also the players B and C are now players 1, 2 or 3. You are a player 2. Also during this experiment we do not use euros but points. All points you receive during the experiment will be changed into euros at the end of the experiment: 100 points = 1 euro. The following pages give you instructions on the course of the experiment. First, we are going to explain the basic situation. After having read the instructions you are going to find some control questions on the screen. The experiment will start as soon as all participants are familiar with the experiment. THE EXPERIMENT: There are 6 decision situations. One group contains one player 1, one player 2 and one player 3. For every decision round the groups are going to be rematched. Before the decision starts, all participants learn the initial situation. In the next step player 1 can change this initial situation. After player 1's decision, player 3 can transfer points from you to player 1 or from player 1 to you. You do not have to make a decision. We are going to explain the decision situation in the following example:
EXAMPLE: player 1 receives 30 points and you receive 50 points. Player 1 can keep this initial allocation or change it. If he changes it, player 1 receives 10 points more, which is a total of 40 points. In this case you receive 20 points more, which is a total of 70 points. You do not make a decision.
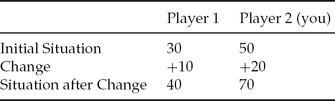
At the beginning of every round player 3 receives 100 points. After player 1's decision player 3 can transfer points from you to player 1 or from player 1 to you. For example he can take away points from you in order to give them to player 1. Or you can take away points from player 1 in order to give them to you.
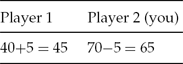
Assume player 1 keeps the initial situation and player 3 transfers 5 points from you to player 1. Then the allocation looks like this:
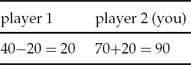
Assume player 1 changes the initial situation and player 3 transfers 20 points from player 1 to you. Then the allocation looks like this:
By now clicking on the OK button you will receive some control questions that you can answer directly on screen.
8.5 Instructions – Player 3
There will now take place an additional experiment. In this experiment there are players 1, player 2 and players 3. This experiment is not related to the first experiment. The participants are rematched. A player A in the experiment can now be a player 1, 2 or 3. Also the players B and C are now players 1, 2 or 3. You are a player 3. Also during this experiment we do not use euros but points. All points you receive during the experiment will be changed into euros at the end of the experiment: 100 points = 1euro. The following pages give you instructions on the course of the experiment. First, we are going to explain the basic situation. After having read the instructions you are going to find some control questions on the screen. The experiment will start as soon as all participants are familiar with the experiment. THE EXPERIMENT: There are 6 decision situations. One group contains one player 1, one player 2 and one player 3. For every decision round the groups are going to be rematched. Before the decision starts, all participants learn the initial situation. In the next step player 1 can change this initial situation. After player 1's decision, you can transfer points from player 1 to player 2 or from player 2 to player 1. Player 2 does not have to make a decision. We are going to explain the decision situation in the following example. EXAMPLE: player 1 receives 30 points and player 2 receives 50 points, player 1 can keep this initial allocation or change it. If he changes it, he receives 10 points more, which is a total of 40 points. In this case player 2 receives 20 points more, which is a total of 70 points. Player 2 does not make a decision.
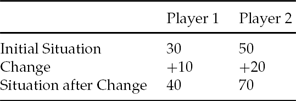
At the beginning of every round, you being player 3, receive 100 points. After player 1's decision you can transfer points from player 1 to player 2 or from player 2 to player 1. For example you can take away points from player 1 in order to give them to player 2. Or you can take away points from player 2 in order to give them to player 1. You are going to make your decision before you know how player 1 decides. That means you have to indicate your decision for both decision possibilities of player 1. You therefore have to answer the following two questions:
Assume player 1 keeps the initial situation:
How many points do you want to transfer from player 1 to player 2?
How many points do you want to transfer from player 2 to player 1?
Assume player 1 changes the initial situation:
How many points do you want to transfer from player 1 to player 2?
How many points do you want to transfer from player 2 to player 1?
Please note: You can only transfer in one direction. That means you cannot transfer points from player 1 to player 2 and transfer points from player 2 to player 1. Assume player 1 keeps the initial situation and you transfer 5 points from player 2 to player 1. Then the allocation looks like this:
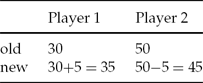
Assume player 1 changes the initial situation and you transfer 20 points from player 1 to player 2. Then the allocation looks like this:
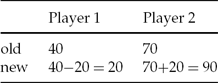
After your decision, you will see the new allocation for player 1 and 2 on your screen. You then have the possibility to confirm or change your decision. In every case you receive 100 points. By now clicking on the OK button you receive some control questions that you can answer directly on screen.