Metabolic dysfunction-associated steatotic liver disease (MASLD) is a condition characterised by fat accumulation in the liver that is not associated with alcohol consumption. MASLD includes a range of liver dysfunctions, from simple steatosis (fat accumulation without inflammation) to metabolic dysfunction-associated steatohepatitis, fibrosis and cirrhosis(Reference Pouwels, Sakran and Graham1). Based on latest studies, the average prevalence of MASLD in the paediatric population is approximately 7–14 %(Reference Younossi, Kalligeros and Henry2). Genetic factors, sedentary lifestyles and unhealthy diets with increased calorie intake may increase the risk of MASLD(Reference Vos, Abrams and Barlow3). Based on previous studies, the main treatment strategy for MASLD is an lifestyle modifications, such as more physical activity and following healthy dietary habits, which cause weight loss and better liver function(Reference Lee4,Reference Utz-Melere, Targa-Ferreira and Lessa-Horta5) . Drug interventions and supplement consumption may also have positive effects on MASLD. For instance, glucose-lowering medications such as metformin and pioglitazone(Reference Lee4,Reference Soliman, De Sanctis and Alaaraj6) , dietary supplements such as n-3 that could reduce liver fat due to DHA(Reference Sobhani Shahmirzadi and Barati7) and vitamin E, due to its antioxidant properties, can decrease liver inflammation and improve liver tissue function, which may have beneficial effects on MASLD(Reference Sobhani Shahmirzadi and Barati7,Reference Shah, Okubote and Alkhouri8) .
Vitamin E is a fat-soluble antioxidant that not only improves cell communication but also modifies gene expression. Furthermore, it protects usual cellular activities and prevents cells oxidative tissues damage made by free radicals(Reference Rizvi, Raza and Ahmed9,Reference Song, Ni and Zheng10) . Plant-based oils, such as olive oil, sunflower oil and nuts and seed oil, such as hazelnut and almond, are known to be the main sources of vitamin E(Reference Shim, Kim and Lee11). However, dietary intake may not always be sufficient to meet the recommended dietary allowance for children, which ranges from 7 mg/d for children aged 4–8 years to 11 mg/d for those aged 9–13 years. Accordingly, vitamin E supplementation may be a proper therapeutic option in children with increased oxidative stress or conditions like MASLD to support the daily vitamin E requirements. Some studies have reported that vitamin E supplementation may have positive effects on MASLD. For example, reductions in ballooning, portal inflammation and alkaline phosphatase have been observed in previous studies. However, fibrosis and alanine aminotransferase (ALT) levels have a lower response rate(Reference Yodoshi, Orkin and Arce-Clachar12,Reference Pacana and Sanyal13) . Moreover, vitamin E supplementation may play a role in regulating the glycaemic indices in these patients. However, the outcomes are sparse and inconsistent(Reference Basu, Shah and Aloysius14,Reference Abdel-Maboud, Menshawy and Menshawy15) . Similar to glycaemic indices, lipid profile markers may also be influenced by vitamin E consumption. However, the results of studies inconsistent(Reference Lin, Zeng and Deng16,Reference Al-Baiaty, Ismail and Abdul Latiff17) . Because of these inconsistencies, the aim of this systematic review and meta-analysis of published randomised controlled trials was to assess the effects of vitamin E supplementation on liver function, glycaemic control and lipid profile markers in children with MASLD.
Method
This study was conducted based on the Preferred Reporting Items for Systematic Reviews and Meta-Analyses protocol for reporting systematic reviews and meta-analyses(Reference Moher, Liberati and Tetzlaff18). The study was registered with PROSPERO on March 2025 (CRD420251016595).
Search strategy
PubMed, Scopus, Web of Science databases and Google Scholar were searched until March 2025. The search strategy that was performed following the MeSH terms, and keywords are available in online Supplementary File 1.
Study selection, inclusion and exclusion criteria
The PICO criteria for this meta-analysis were as follows: population (P: Children with MASLD or obesity-related liver dysfunction), intervention (I: Vitamin E supplementation, either alone or combined with co-supplements), comparison (C: Placebo, lifestyle modification, or standard care), outcome (O: anthropometric measures (weight and BMI), liver function indices (ALT, aspartate aminotransferase (AST), alkaline phosphatase and γ-glutamyl transferase (GGT)), glycaemic-related parameters (fasting blood sugar (FBS), homeostatic model assessment for insulin resistance (HOMA-IR), and insulin) and lipid profile indicators (total cholesterol (TC), TAG, LDL-cholesterol and HDL-cholesterol). The criteria for inclusion were (1) randomised controlled trials; (2) assessment of the effects of vitamin E supplementation on anthropometric measures, liver function, glycaemic-related parameters or lipid profile in children with MASLD; (3) English language study; (4) children < 18 years old and (5) providing sufficient information of variables on the baseline and end trial in both intervention and control groups. The exclusion criteria were as follows: (1) observational studies, reviews, letters, conference abstracts, case reports and in vitro and ex vivo studies and (2) insufficient information on outcomes.
Data extraction
Data from the included studies were extracted by two reviewers (PP and MM) separately and then abstracted as follows: (1) author’s name; (2) date of publication; (3) origin country; (4) study design; (5) number of participants in both intervention and control groups; (6) dosage and type of vitamin E; (7) duration of intervention; (8) age and sex of study participants and (9) mean changes and sd of outcome measures at baseline, post-intervention and/or changes in outcome measures from baseline to the end of trial. If data were reported in different units, we changed them to the most frequent according to the standard formula.
Quality assessment and certainty assessment
The quality of studies was evaluated by two independent reviewers (PP and MM) using Version 2 of the Cochrane risk-of-bias tool (RoB2), which contains five criteria to evaluate the risk of bias: randomisation process, deviation from inclined interventions, missing outcome data, measurement of the outcome and selection of the reported result(Reference Sterne, Savović and Page19). Consequently, terms such as ‘Low’, ‘High’ or ‘Some concern’ were used to indicate the level of each criterion. Finally, all disagreements were resolved by a third author (RZ). Confidence in collective evidence was evaluated in accordance with Grading of Recommendations Assessment, Development, and Evaluation system guidelines(Reference Guyatt, Oxman and Vist20). The body of evidence was systematically rated across four quality tiers: high, moderate, low or very low certainty based on predefined assessment criteria.
Statistical analysis
Effect sizes for all variables are reported as weighted mean differences with 95 % CI. A random-effects model was employed to estimate the overall effect size using the restricted maximum likelihood method. To convert the standard error of the mean (sem) into sd, the following formula was used: sd = sem × √n (where n represents the number of participants in each group). To discover the potential origins of heterogeneity, a between-study heterogeneity test using Cochran’s Q test was performed and measured using the (I 2) statistic. I 2 > 50 % or P value < 0·05 was intended as high between-study heterogeneity(Reference Higgins21). Subgroup analyses were conducted based on pre-specified criteria, including participants’ health condition (e.g., MASLD, metabolic dysfunction-associated steatohepatitis and obesity-related hepatic steatosis), vitamin E dosage (< 600 v. ≥ 600 IU/d), intervention duration (< 24 v. ≥ 24 weeks), type of intervention (vitamin E alone v. co-supplementation) and risk of bias rating (low, some concerns and high), in order to explore potential sources of heterogeneity. Sensitivity analysis was applied to predict the effect of each study on the overall estimation(Reference Tobias22). Publication bias was assessed using visual inspection of funnel plots and statistically with Egger’s test(Reference Begg and Mazumdar23). Statistical analyses were performed using STATA version 14. Statistical significance was set at P < 0·05.
Results
Study selection
A total of 1929 records were retrieved through electronic database searches, including PubMed (n 276), Scopus (n 1090) and Web of Science (n 563). After removal of 532 duplicate records, 1397 records remained. During the preliminary review process, 387 articles were excluded for reasons (e.g. irrelevant publication types or titles), leaving 1010 records for title and abstract screening. Of these, 834 records were excluded, and 176 full-text reports were sought for retrieval. Following a thorough full-text review, we excluded 113 articles and proceeded to evaluate the remaining sixty-three studies for eligibility. Based on our inclusion and exclusion criteria, fifty-two articles were excluded for reasons such as being conducted on adults (n 12), animal models (n 6), insufficient outcome data (n 30) or lacking an appropriate control group (n 4). Finally, eleven randomised controlled trials were included in the meta-analysis. A Preferred Reporting Items for Systematic Reviews and Meta-Analyses flowchart is shown in Figure 1.
The PRISMA flowchart of study selection process. PRISMA, Preferred Reporting Items for Systematic Reviews and Meta-Analyses.

Study characteristics
The present systematic review and meta-analysis included eleven studies (twelve arms) encompassing 665 children. The included studies were published between 2004 and 2024 time frame. Most of the included studies were conducted in Italy(Reference D’Adamo, Marcovecchio and Giannini24–Reference Zöhrer, Alisi and Jahnel29), one in Malaysia(Reference Al-Baiaty, Ishak and Mohd Zaki30), Iran(Reference Homaei, Alhadad and Arad31), Switzerland(Reference Murer, Aeberli and Braegger32), Turkey(Reference Akcam, Boyaci and Pirgon33) and the USA(Reference Lavine, Schwimmer and Van Natta34). All studies were conducted on both girls and boys. The administered vitamin E dose varied from 14·9 to 895 (IU/d). In addition, the treatment duration was between 8 and 96 weeks in the included studies. The baseline BMI values of participants, ranged from approximately 24·5–34 kg/m2 across studies. The baseline characteristics of the study participants are presented in Table 1.
Baseline characteristics of study participants

R, randomised; PC, placebo-controlled; SB, single blind; DB, double-blind; TB, triple-blind; NR, not reported; MASLD, metabolic dysfunction-associated steatotic liver disease; MASH, metabolic dysfunction-associated steatohepatitis; Int, intervention group; Con, control group; IU, international units; M, male; F, female.
Risk of bias and quality of evidence
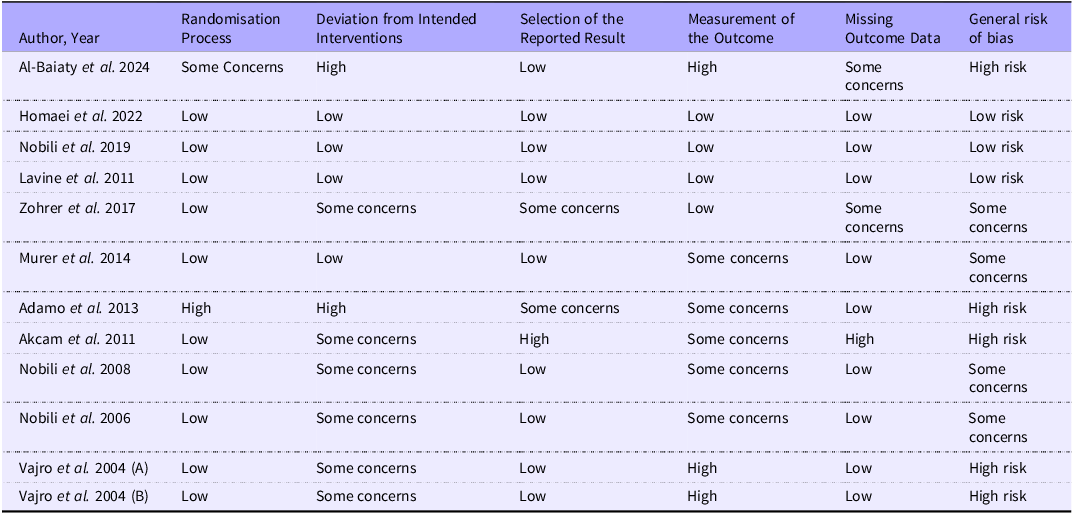
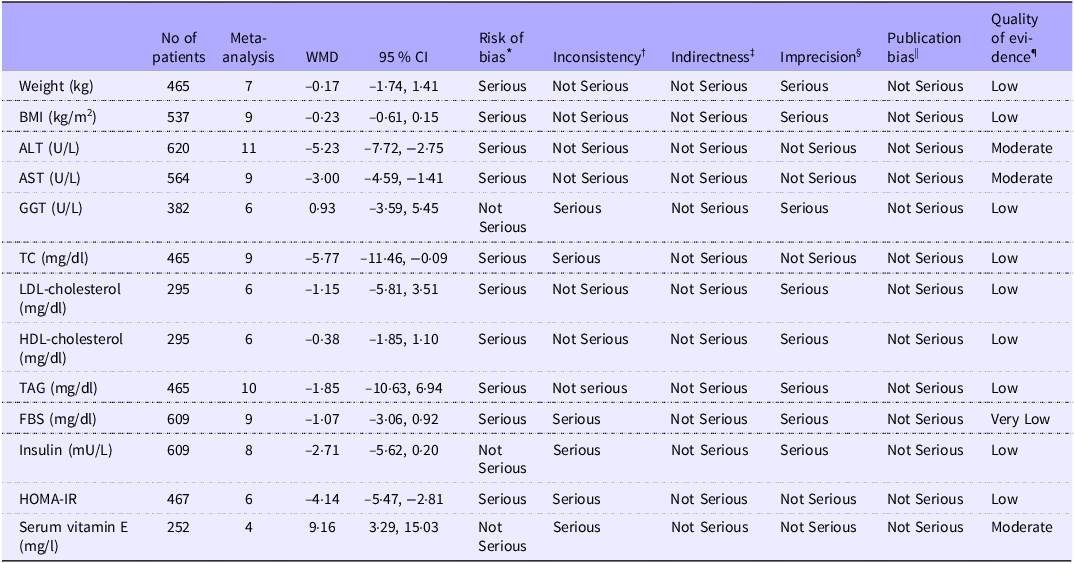
The results of the quality assessment for all included studies, based on RoB2, are summarised in Table 2. Of the studies assessed, three were determined to have a low risk of bias(Reference Nobili, Alisi and Mosca25,Reference Homaei, Alhadad and Arad31,Reference Lavine, Schwimmer and Van Natta34) , while four studies were found to have some concerns regarding bias(Reference Nobili, Manco and Devito26,Reference Nobili, Manco and Devito27,Reference Zöhrer, Alisi and Jahnel29,Reference Murer, Aeberli and Braegger32) for the quality assessment of the included studies. All of the included studies were done based on randomisation process except Adamo et al.’s(Reference D’Adamo, Marcovecchio and Giannini24) and Al-Baiaty et al.’s study(Reference Al-Baiaty, Ishak and Mohd Zaki30). Zohrer et al.,(Reference Zöhrer, Alisi and Jahnel29), Akcam et al.,(Reference Akcam, Boyaci and Pirgon33), Nobili et al.,(Reference Nobili, Manco and Devito27), Nobili et al.,(Reference Nobili, Manco and Devito26), and Vajro et al.(Reference Vajro, Mandato and Franzese28) got some concern based on possible deviations without clear evidence of impact. Also, the studies by Adamo et al.(Reference D’Adamo, Marcovecchio and Giannini24) and Zohrer et al.(Reference Zöhrer, Alisi and Jahnel29) were flagged for potential selective reporting bias due to inconsistencies between their reported outcomes and pre-specified analysis plans. Al-Baiaty et al.(Reference Al-Baiaty, Ishak and Mohd Zaki30) and Zohrer et al.’s study(Reference Zöhrer, Alisi and Jahnel29) had missing outcome data and scored as some concern. In addition, a Grading of Recommendations Assessment, Development, and Evaluation assessment was performed to evaluate the certainty of the evidence, with the results presented for each outcome in Table 3. Accordingly, the quality of evidence for ALT, AST and serum vitamin E was rated as moderate, supported by acceptable reliability. While, the quality of evidence for weight, BMI, GGT, TC, LDL-cholesterol, HDL-cholesterol, TAG, insulin and HOMA-IR were rated as low, due to concerns regarding risk of bias, imprecision and inconsistency. Also, the quality of evidence was very low for FBS.
Results of risk of bias assessment for randomised clinical trials included in the present study

Each study was assessed for risk of bias using the ROB2 tool. Domains of assessment included were Randomisation Process, Deviation from Intended Interventions, Selection of the Reported Result, Measurement of the Outcome, Missing Outcome Data and General Risk of Bias. Each domain was scored as ‘high risk’ if it contained methodological flaws that may have affected the results, ‘low risk’ if the flaw was deemed inconsequential and ‘some concern’ if information was insufficient to determine.
Summary of findings and quality of evidence assessment using the GRADE approach

ALT, alanine transaminase; AST, aspartate transaminase; GGT, gamma-glutamyltransferase; TC, total cholesterol; FBS, fasting blood sugar; HOMA-IR, homeostatic model assessment for insulin resistance.
* Risk of bias based on the Cochrane risk of bias tool.
† Downgraded if there was a substantial unexplained heterogeneity (I2 > 50 %, P < 0·10) that was not explained by subgroup analyses.
‡ Downgraded if there were factors present relating to the participants, interventions or outcomes which restrict the overall generalisability of the results.
§ Downgraded if the 95 % CI crossed the minimally important difference (MID).
|| Downgraded if there was an evidence of publication bias using funnel plot.
¶ Since all included studies were randomised controlled trials, the certainty of the evidence was graded as high for all outcomes by default and then downgraded based on prespecified criteria.
Vitamin E supplementation and anthropometric measurements
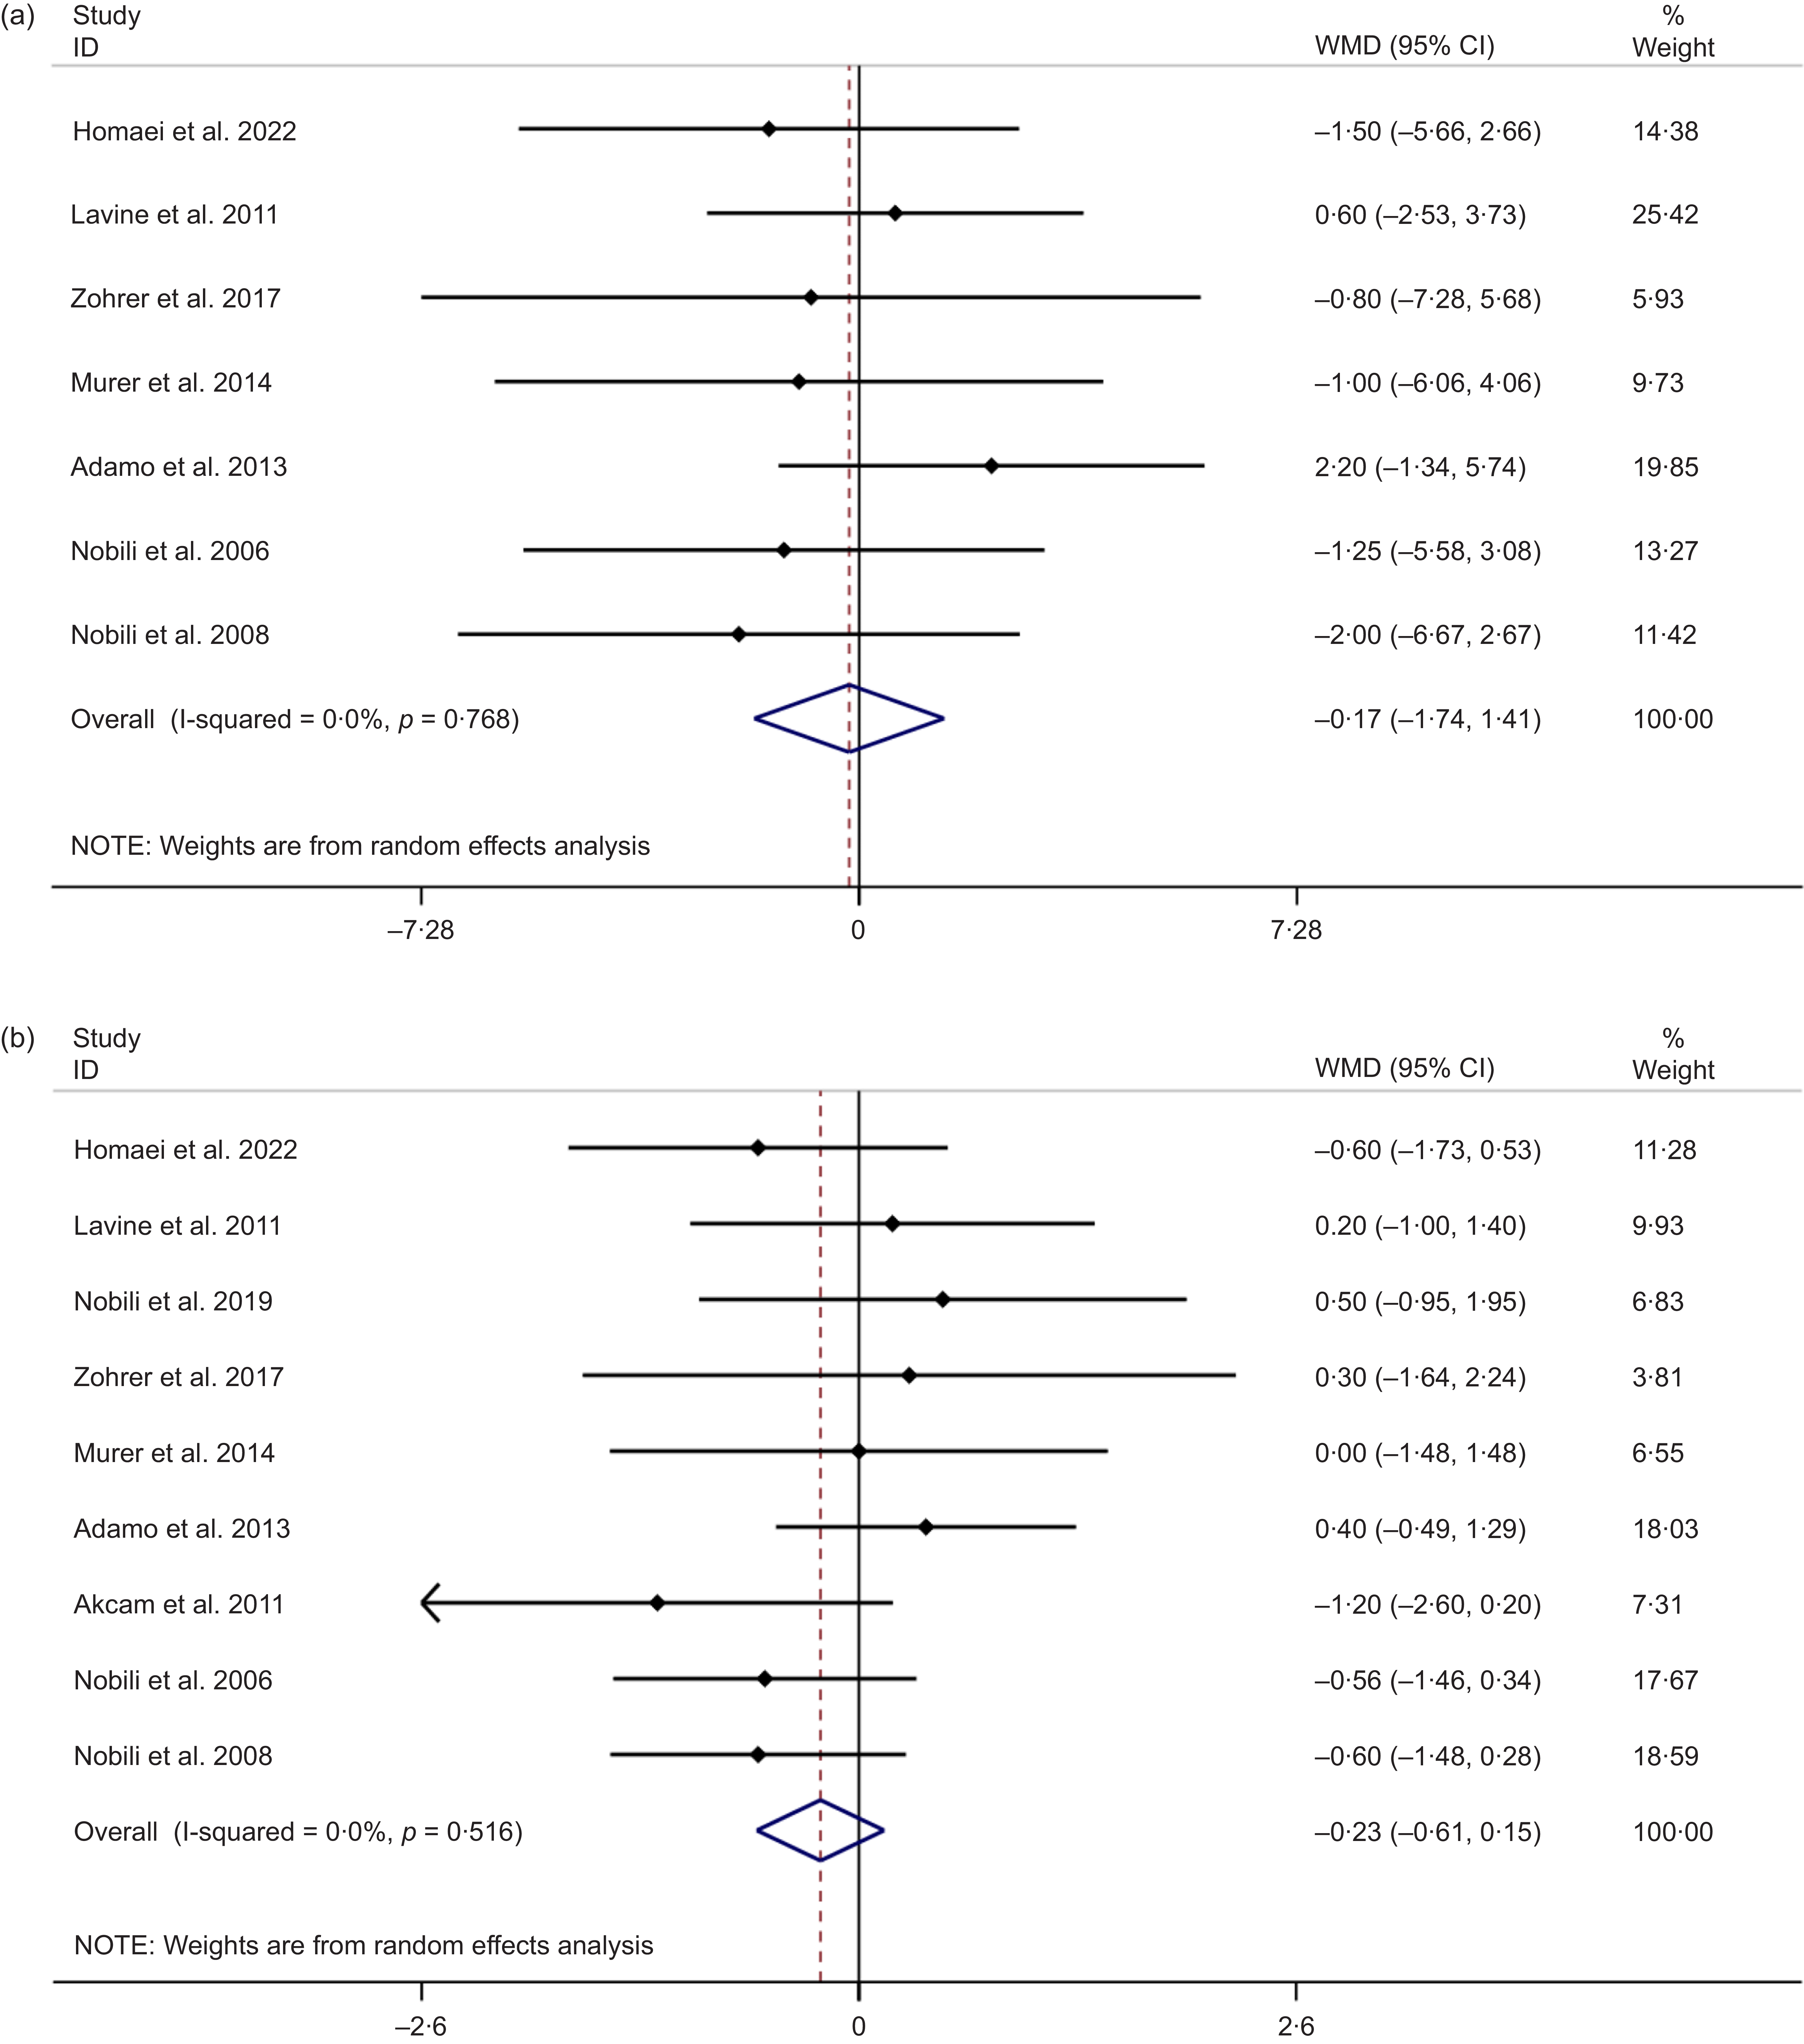
Combining effect sizes from seven eligible studies with containing 465 participants showed no significant changes for weight based on vitamin E supplementation (weighted mean difference (WMD) = −0·17 kg; 95 % CI: −1·74, 1·41, P = 0·837), with no significant heterogeneity across the studies (I 2 = 0·0 %, P-heterogeneity = 0·768) (Figure 2(a)). Subgroup analyses revealed no significant changes in weight following vitamin E supplementation by health condition, type of supplementation, dosage, period and quality of studies (P > 0·05) (Table 4) and the forest plots are available in the online Supplementary File 1. Furthermore, sensitivity analysis showed that omitting any single study did not significantly alter the overall effect size. No small-study effects were observed performing Egger’s test (P = 0·147).
(a) The forest plot of vitamin E treatment on weight value. (b) The forest plot of vitamin E treatment on BMI value.

Pooled estimate effects of vitamin E treatment on anthropometric measurements, liver function tests, lipid profile, glycAemic markers and serum vitamin E in different subgroups

WMD, weighted mean difference; MASLD, metabolic dysfunction-associated steatotic liver disease; MASH, metabolic dysfunction-associated steatohepatitis; ALT, alanine aminotransferase; AST, aspartate aminotransferase; GGT, gamma-glutamyl transferase; HOMA-IR, homeostatic model assessment for insulin resistance.
Combining effect sizes from nine studies encompassing 537 participants demonstrated no significant effect of vitamin E on BMI level (WMD = −0·23 kg/m2; 95 % CI: −0·61, 0·15, P = 0·238; I 2 = 0·0 %, P-heterogeneity = 0·516) (Figure 2(b)). Subgroup analysis showed no significant changes based on the health condition, type of supplementation, dosage, duration and quality of the study subgroups (P > 0·05) (Table 4). The sensitivity analysis showed no changes in the overall effect size, excluding individual studies. No small-study effects were observed performing Egger’s test (P = 0·651).
Vitamin E supplementation and liver function tests
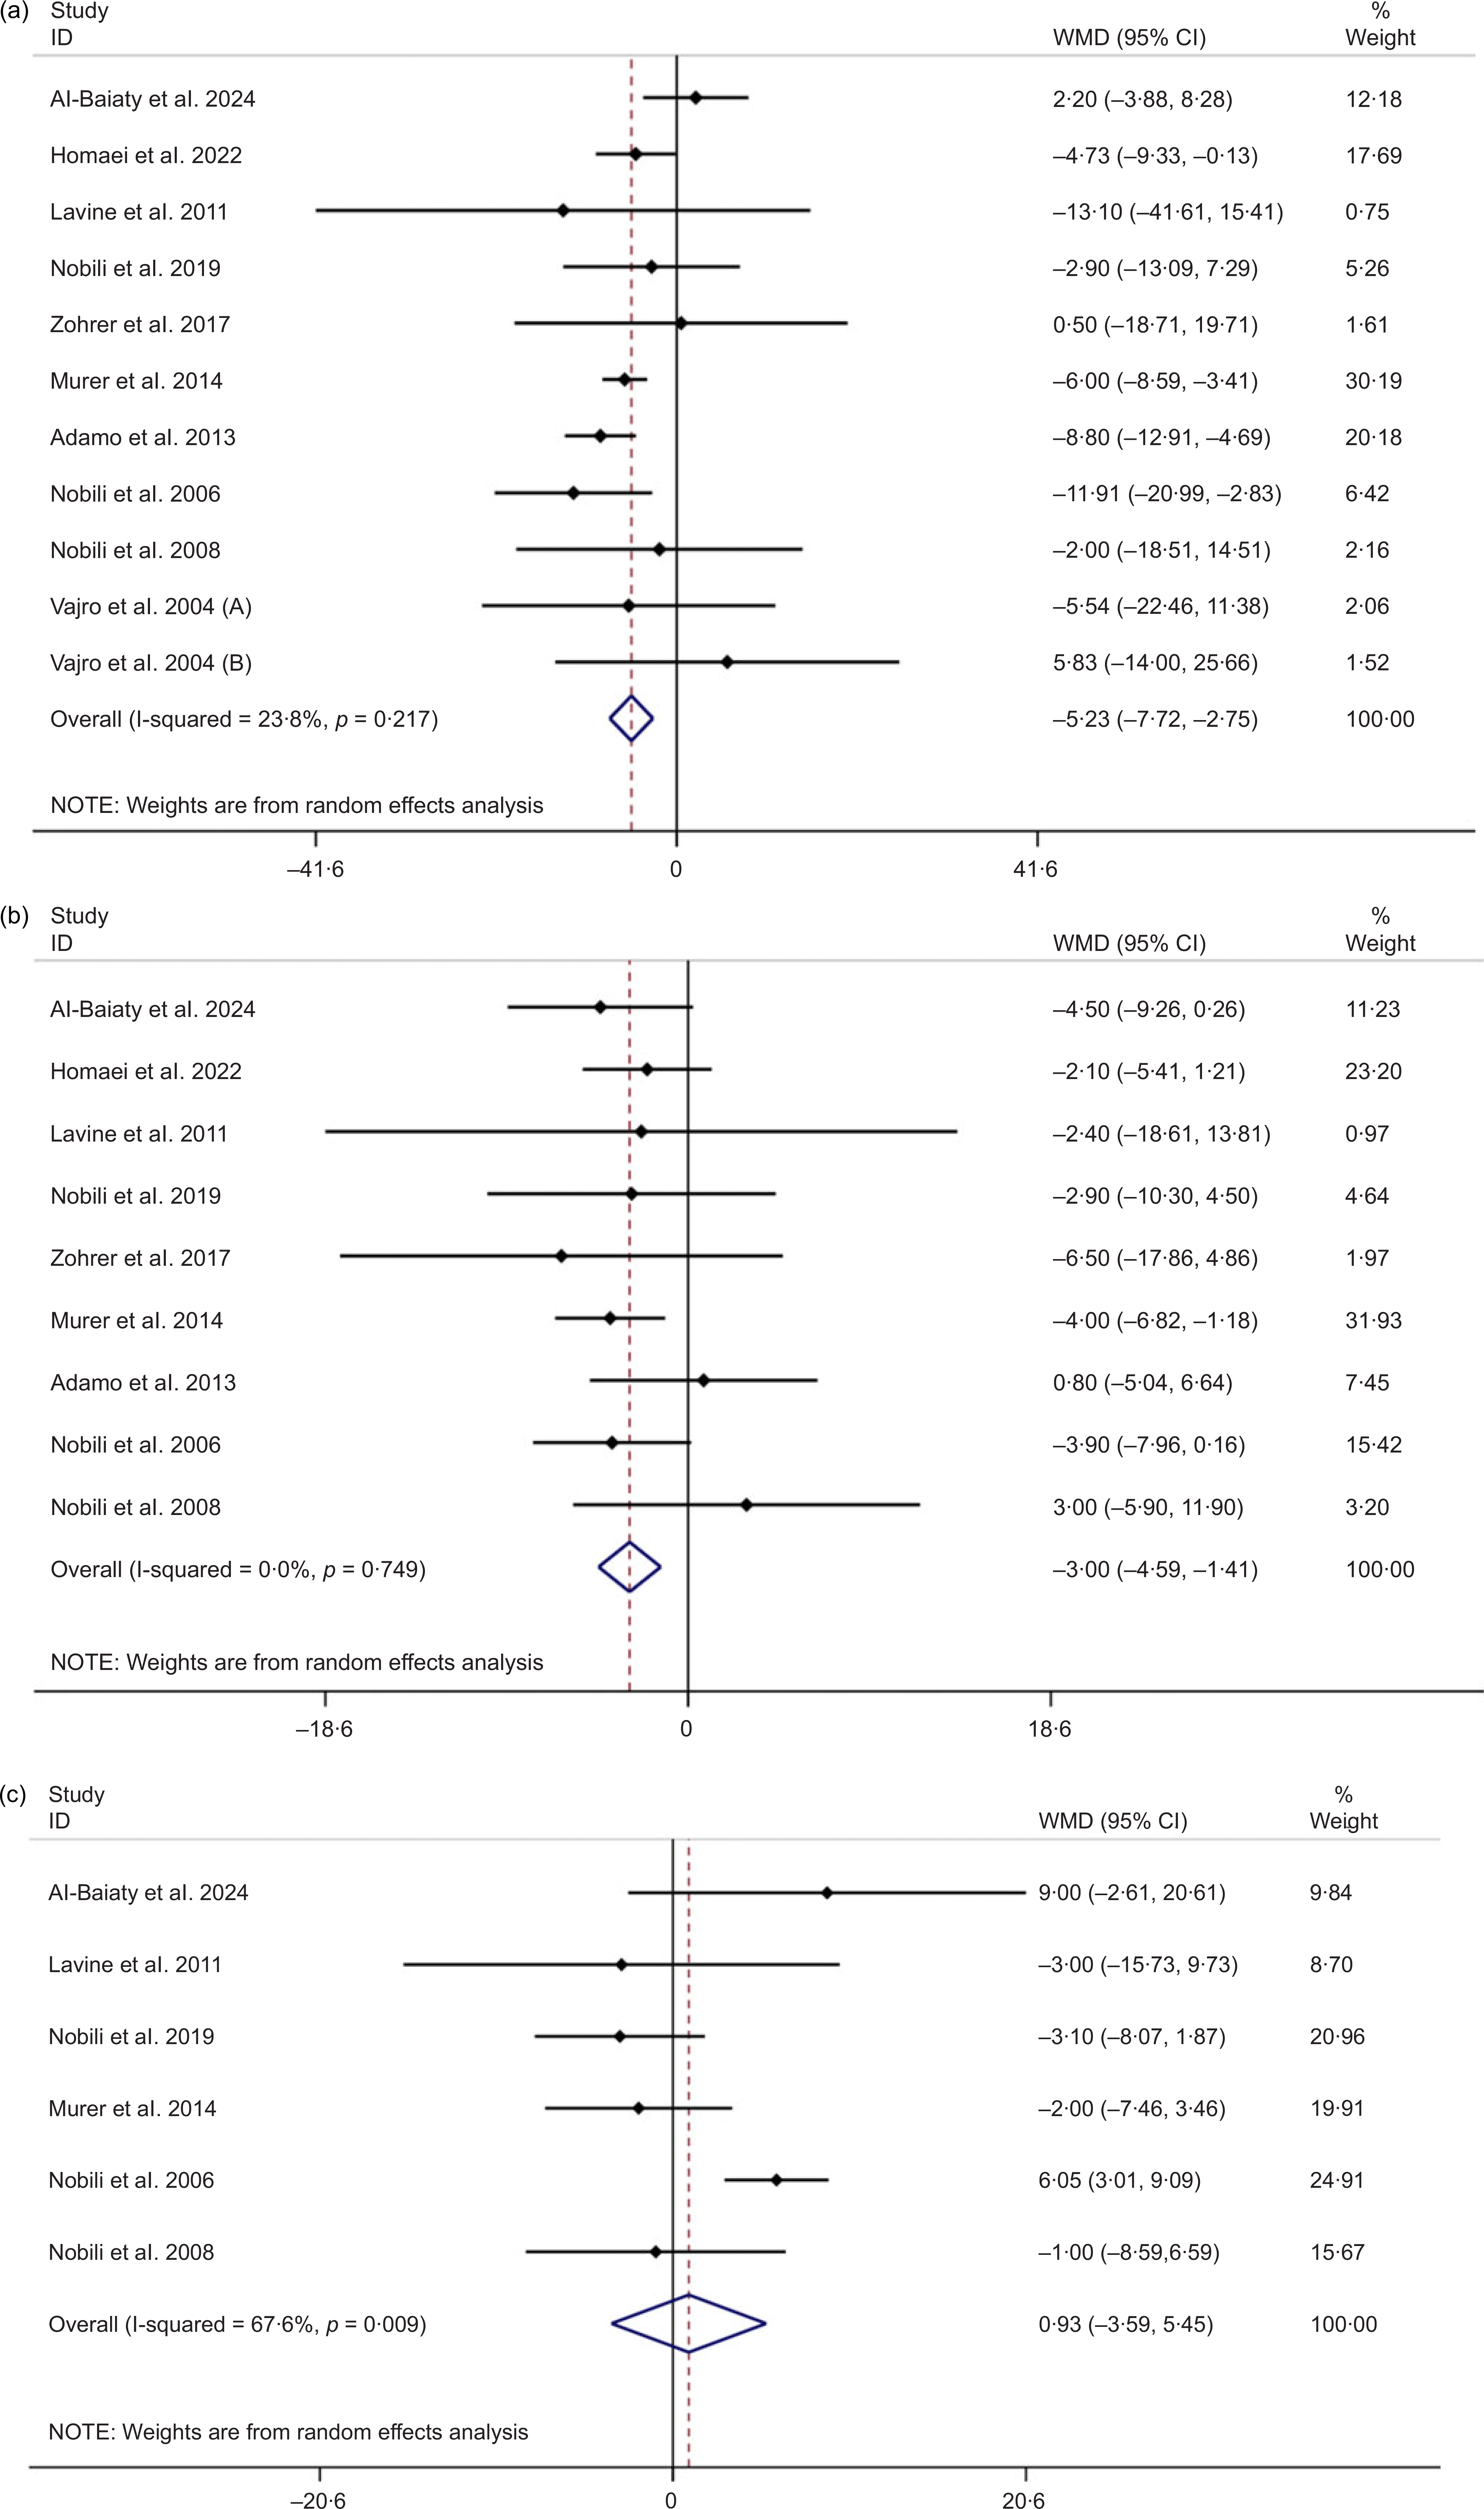
The pooled random-effects model of eleven studies (620 participants) revealed that consumption of vitamin E reduced ALT levels significantly (WMD = −5·23 U/L; 95 % CI: −7·72, −2·75, P < 0·001) with a low between-study heterogeneity (I2 = 23·8 %, P-heterogeneity = 0·217) (Figure 3(a)). Moreover, subgroup analyses revealed that co-supplementation with vitamin E had a more pronounced effect on ALT levels (P < 0·001). The analyses showed that both obese and MASLD patients benefited from vitamin E supplementation. In addition, higher doses (≥ 600 IU/d) with short-term (< 24 weeks) vitamin E treatment significantly affected ALT levels (P < 0·001). In the subgroup analysis based on the quality of the studies, we observed a significant difference in ALT outcomes, with different levels of risk of bias. Specifically, in the lower risk of bias (P = 0·030) and some concern (P < 0·001) subgroups, vitamin E led to a significant reduction in ALT levels (Table 4). Accordingly, ‘leave-one-out’ approach demonstrated no significant changes based on sensitivity analyses for ALT value. No publication bias was reported based on Egger’s test (P = 0·453).
(a) The forest plot of vitamin E treatment on ALT level. (b) The forest plot of vitamin E treatment on AST level. (c) The forest plot of vitamin E treatment on GGT level. ALT, alanine aminotransferase; AST, aspartate aminotransferase; GGT, gamma-glutamyl transferase.

The pooled random-effects model of nine studies (564 participants) revealed significant reduction in AST levels following vitamin E treatment (WMD = −3·00 U/L; 95 % CI: −4·59, –1·41, P < 0·001) with a lower between-study heterogeneity (I2 = 0.0 %, P-heterogeneity = 0·749) (Figure 3(b)). Moreover, subgroup analyses revealed that co-supplementation with vitamin E had a more pronounced effect on AST levels (P = 0·001). In contrast to ALT levels, lower doses (< 600 IU/d) were effective in significantly reducing AST levels (P < 0·001). However, short- and long-term treatments were accompanied by a significant reduction in AST levels (P < 0·001) (Table 4). ‘Leave-one-out’ approach reported no significant changes based on sensitivity analyses for AST value. No publication bias was reported based on Egger’s test (P = 0·450).
Additionally, pooled analysis using a random-effects model was performed for GGT as a marker of liver function. In total, six studies involving 382 children assessed the impact of vitamin E supplementation on GGT levels, showing a non-significant effect (WMD = 0·93 U/L; 95 % CI: −3·59, 5·45; P = 0·688) (Figure 3(c)). Substantial heterogeneity was observed across studies (I² = 67·6 %, P for heterogeneity = 0·009). Nevertheless, subgroup analyses did not reveal any significant sources of heterogeneity based on treatment type, participants’ health status, supplementation dose or duration or study quality (Table 4). The sensitivity analysis indicated that excluding individual studies did not influence the overall effect estimate for GGT. Furthermore, Egger’s test did not reveal any evidence of publication bias (P = 0·409).
Vitamin E supplementation and lipid profile
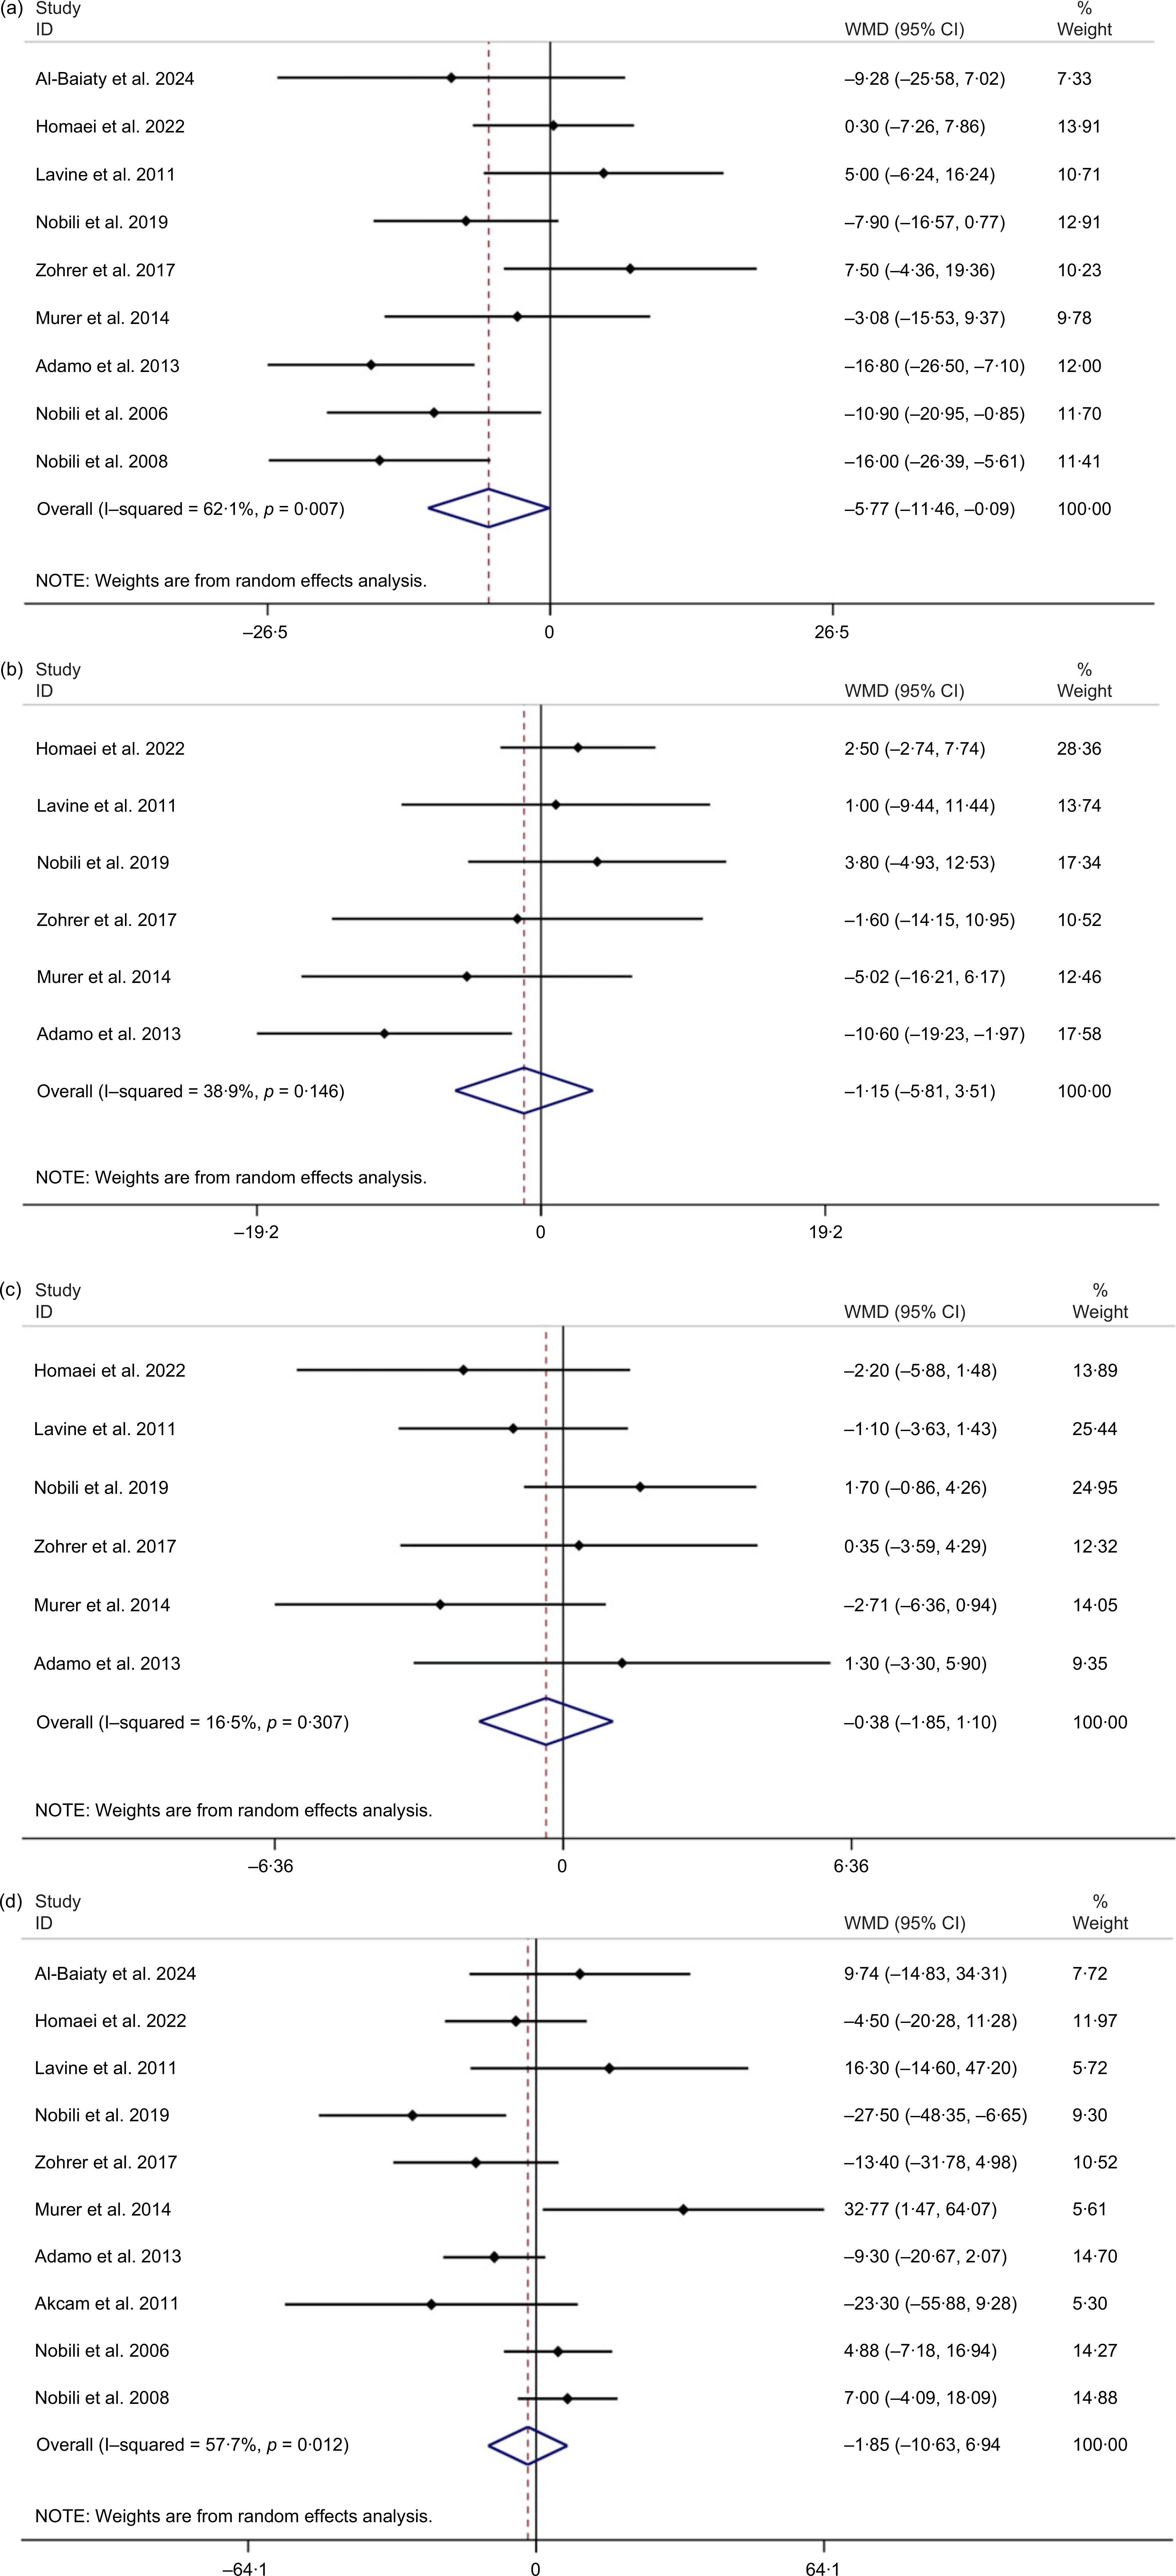
A pooled analysis of nine studies involving 465 participants revealed a significant reduction in TC levels following vitamin E supplementation (WMD = −5·77 mg/dl; 95 % CI: −11·46, −0·09; P = 0·046). However, substantial heterogeneity was observed among the studies (I² = 62·1 %, P for heterogeneity = 0·007) (Figure 4(a)). The subgroup analysis indicated that patients with MASLD experienced a more pronounced decrease in TC levels (P = 0·013) (Table 4). Although the pooled estimate for TC showed a significant decrease, the sensitivity analysis suggested that the overall effect size might be influenced by the studies conducted by Al-Baiaty et al. (Reference Al-Baiaty, Ishak and Mohd Zaki30), Nobili et al. (Reference Nobili, Alisi and Mosca25), Murer et al. (Reference Murer, Aeberli and Braegger32), Adamo et al. (Reference D’Adamo, Marcovecchio and Giannini24), Nobili et al. (Reference Nobili, Manco and Devito26) and Nobili et al. (Reference Nobili, Manco and Devito27), which altered the results to a non-significant level. Furthermore, Egger’s test showed no evidence of publication bias (P = 0·979).
(a) The forest plot of vitamin E treatment on TC level. (b) The forest plot of vitamin E treatment on LDL-cholesterol level. (c) The forest plot of vitamin E treatment on HDL-cholesterol level. (d) The forest plot of vitamin E treatment on TAG level.

Pooling effect sizes from six studies for LDL-cholesterol and HDL-cholesterol and ten studies for TAG showed a non-significant effect for vitamin E treatment, respectively (WMD = –1·15 mg/dl; 95 % CI: –5·81, 3·51, P = 0·628, I2 = 38·9 %, P-heterogeneity = 0·146) (Figure 4(b)), (WMD = –0·38 mg/dl; 95 % CI: –1·85, 1·10, P = 0·616, I2 = 16·5 %, P-heterogeneity = 0·307) (Figure 4(c)) and (WMD = –1·85 mg/dl; 95 % CI: –10·63, 6·94, P = 0·680, I2 = 57·7 %, P-heterogeneity = 0·012) (Figure 4(d)). Subgroup analyses failed to introduce health conditions, type of treatment, supplementation dosage and duration of treatment as sources of heterogeneity (P > 0·05). However, a significant reduction in LDL-cholesterol levels within the higher risk of bias subgroup was observed (P = 0·016) (Table 4). In addition, sensitivity analysis demonstrated that the overall WMD does not depend on any single study effect on LDL-cholesterol, HDL-cholesterol and TAG levels. No evidence of publication bias was found based on Egger’s tests for LDL-cholesterol (P = 0·406) and HDL-cholesterol (P = 0·729). The funnel plot for TAG outcomes appeared symmetric, and neither Begg’s test (P = 0·929) nor Egger’s test (P = 0·979) indicated a significant publication bias. These findings suggest a low risk of small study effects that influence the pooled estimate.
Vitamin E supplementation and glycaemic state
Nine studies involving 609 children investigated the effects of vitamin E treatment on FBS. The combined outcome from the random-effects model specified that vitamin E treatment (WMD = −1·07 mg/dl; 95 % CI: −3·06, 0·92, P = 0·294) with a significant between-study heterogeneity (I2 = 65·1 %, P-heterogeneity = 0·003) did not alter FBS level significantly (Figure 5(a)). Subgroup analysis indicated that higher doses of vitamin E (≥ 600 IU/d) (P = 0·037) and long-term treatment (P = 0·025) with vitamin D significantly decreased FBS levels (Table 4). The sensitivity analysis revealed that the exclusion of individual studies did not lead to any significant changes in the overall effect size. In addition, no evidence of publication bias was found according to Egger’s test for FBS value (P = 0·432).
(a) The forest plot of vitamin E treatment on FBS level. (b) The forest plot of vitamin E treatment on insulin level. (c) The forest plot of vitamin E treatment on HOMA-IR level. FBS, fasting blood sugar; HOMA-IR, homeostatic model assessment for insulin resistance.

Eight studies with 609 participants investigated the effects of vitamin E treatment on insulin levels. The combined effect of the random-effects model indicated that vitamin E treatment (WMD = −2·71 mU/l; 95 % CI: −5·62, 0·20, P = 0·068) with a significant between-study heterogeneity (I2 = 86·7 %, P-heterogeneity < 0·001) did not alter insulin levels significantly (Figure 5(b)). Subgroup analysis showed that vitamin E treatment alone (P < 0·001) had more significant effects on insulin levels in studies with a lower risk of bias (P = 0·002). The sensitivity analysis indicated that omitting individual studies did not significantly affect the overall effect size. In addition, no evidence of publication bias was found according to Egger’s test for FBS value (P = 0·290).
Eight studies (including 537 children) explored the effects of vitamin E on HOMA-IR. The combined effect of the random-effects model indicated that vitamin E significantly reduced the HOMA-IR value significantly (WMD = −0·82; 95 % CI: −1·28, −0·37, P < 0·001). Substantial heterogeneity was observed across the included studies (I2 = 77·4 %, P-heterogeneity < 0·001) (Figure 5(c)). Subgroup analysis demonstrated that all doses, both short- and long-term treatments, MASLD patients and vitamin E treatment alone could significantly affect HOMA-IR values. In addition, subgroup analysis based on the quality of studies indicated that lower and higher risk of bias subgroups were accompanied by a significant decrease in HOMA-IR level (P < 0·001) (Table 4). Sensitivity analysis showed no significant changes in the overall effect size after excluding a single study. In addition, no evidence of publication bias was found according to Egger’s test for FBS value (P = 0·559).
Vitamin E supplementation and serum level
Pooled effect size of four studies demonstrated that vitamin E treatment could increase serum level of vitamin E significantly (WMD = 9·16 mg/l; 95 % CI: 3·29, 15·03; P = 0·002; I2 = 96·1; P-heterogeneity < 0·001) (Figure 6). Subgroup analysis was performed, and all doses, long-term treatments and vitamin E treatment, whether used alone or in combination, could significantly affect serum vitamin E levels (Table 4). In addition, sensitivity analysis demonstrated that the overall effect size may be influenced by the study by Zohrer et al. (Reference Zöhrer, Alisi and Jahnel29), as its exclusion shifted the result from statistically significant to non-significant.
The forest plot of vitamin E treatment on serum vitamin E level.

Discussion
The current systematic review and meta-analysis summarised the results of 665 children who received vitamin E treatment and evaluated their efficacy in various outcomes. Accordingly, our findings indicated that vitamin E treatment could significantly improve some metabolic factors in children compared with the control group. In addition, vitamin E administration was associated with an increase in serum vitamin E levels.
According to our findings, vitamin E supplementation led to a significant reduction in ALT and AST levels, but did not significantly affect GGT levels. Several meta-analyses have reported a consistent decrease in ALT levels following vitamin E supplementation in both children and adults(Reference Vogli, Naska and Marinos35). In contrast, AST levels did not show significant changes following vitamin E administration in the paediatric population(Reference Vogli, Naska and Marinos35,Reference Amanullah, Khan and Anwar36) . This discrepancy may be explained by the fact that our meta-analysis included a more comprehensive set of studies, thus providing a broader and more updated perspective. Subgroup analyses indicated that higher doses of vitamin E (> 600 IU/d) significantly reduced ALT levels, whereas lower doses (< 600 IU/d) were effective in reducing AST levels. This differential response may be attributed to the different sensitivities of the liver enzymes to oxidative stress. ALT is primarily localised in hepatocytes, is a more specific marker for liver cell injury and tends to increase in response to liver injury(Reference McGill37,Reference Senior38) . It seems that higher doses of vitamin E are required to exert a sufficient antioxidant effect to decrease ALT levels(Reference Manning, Sutherland and Walker39). AST is found in the liver and other tissues, making it less responsive to liver-targeted therapies, and lower doses are required in the clinical setting. Moreover, our study demonstrated that short-term (< 24 weeks) vitamin E supplementation could have a more pronounced effect on ALT and AST levels in obese children. This highlights the antioxidant and anti-inflammatory properties of vitamin E in children(Reference Jiang40). Similarly, Abdel-Maboud et al. ’s meta-analysis showed that vitamin E could exert its favourable properties during long-term (> 12 weeks) follow-up in children(Reference Abdel-Maboud, Menshawy and Menshawy41). Thus, our findings align with this perspective. While a previous study(Reference Abdel-Maboud, Menshawy and Menshawy41) suggested that vitamin E may have beneficial effects in > 12 weeks follow-ups, our analysis indicated that these benefits may also be observed in periods shorter than 24 weeks. In addition, a significant reduction in ALT levels in the lower risk of bias subgroup following vitamin E supplementation supports the idea that high-quality studies yield more consistent and reliable findings regarding the therapeutic potential of vitamin E for liver health. However, vitamin E did not significantly affect the GGT levels. The antioxidative effect of vitamin E may not affect GGT levels, which are involved in biliary function(Reference Singh, Tiwary and Patil42). This finding may be explained by the fact that GGT is primarily a biliary dysfunction and oxidative stress marker, which suggests that the included participants had minimally biliary dysfunction and the GGT level remained unaffected subsequently. Previous evidence supports that vitamin E treatment may be more effective in liver diseases rather than biliary dysfunction.
In addition, our study demonstrated that vitamin E treatment significantly reduced TC levels in the paediatric population compared with the control group. However, the observed reduction in TC levels within the subgroup with a higher risk of bias following vitamin E supplementation suggests that these findings should be interpreted with caution. The methodological limitations of these studies may have influenced the reliability of this outcome, and further high-quality research is needed to confirm the true effects of vitamin E on TC. The antioxidant properties of vitamin E help alleviate oxidative stress, which in turn improves lipid metabolism and reduces lipid peroxidation(Reference Abdelqader, Obeidat and Al-Rawashdeh43–Reference Viitala and Newhouse45). Similarly, vitamin E mitigates lipid peroxidation to lower cholesterol levels in the liver(Reference Wang, Li and Zhang46). Subgroup analysis further indicated that children with MASLD experienced greater benefits from vitamin E supplementation in terms of TC reduction compared with the control group. As oxidative stress and chronic inflammation are key hallmarks of MASLD, vitamin E may exert greater therapeutic effects in this population. In contrast, Lin et al. ’s meta-analysis demonstrated that vitamin E did not have any significant effect on TC levels in paediatric patients with MASLD(Reference Lin, Zeng and Deng47). This discrepancy may be attributed to study heterogeneity, variations in sample sizes, differences in disease severity and baseline cholesterol levels, all of which can influence outcomes. Although vitamin E exerts favourable effects on Tc level, its impact on other lipid parameters is limited and LDL-cholesterol, HDL-cholesterol and TAG levels remained unaffected. This finding may be explained by variations in the treatment dosage and duration which is insufficient to influence these parameters.
Furthermore, vitamin E supplementation had beneficial effects on the HOMA-IR levels. However, it is important to note that both lower- and higher-quality studies reported reductions in HOMA-IR, warranting cautious interpretation of these findings. The presence of studies with a higher risk of bias highlights the need for further investigation using more rigorous methodology. Subgroup analysis revealed that improvements in HOMA-IR were observed across all dosage ranges and durations of supplementation. Moreover, vitamin E treatment alone exhibited favourable effects on HOMA-IR across different health conditions. The underlying mechanism for these effects may involve the reduction of oxidative stress and low-grade inflammation, both of which are known contributors to insulin resistance(Reference Fang, Kang and Wong48,Reference Lewis, Meydani and Wu49) . Vitamin E, a potent antioxidant, may mitigate oxidative stress and ameliorate inflammation, thereby improving insulin sensitivity and lowering HOMA-IR levels(Reference Fang, Kang and Wong48,Reference Gray, Swick and Ronnenberg50) . Since FBS is affected by multiple factors, vitamin E treatment may not efficiently affect FBS levels. It has been shown that FBS levels are regulated by hepatic glucose uptake involving glucagon, cortisol and glycogenolysis that are not influenced by vitamin E’s antioxidant and anti-inflammatory properties, directly. While HOMA-IR reflects insulin sensitivity in muscle and adipose tissue, that vitamin E’s antioxidant and anti-inflammatory effects may directly modulate insulin resistance.
Furthermore, vitamin E supplementation contributed to elevated level of serum vitamin E as it is expected that an increased adherence to vitamin E supplementation is accompanied with elevated serum vitamin E level. Given the small number of studies assessing serum vitamin E levels, subgroup analyses were underpowered and may not accurately represent the intervention’s effect. Furthermore, variation in the assay methods, baseline vitamin E status could contribute to inconsistent results.
A notable strength of our study is the incorporation of subgroup analyses, which allowed for the exploration of potential sources of heterogeneity. Moreover, this study presents a comprehensive evaluation focused exclusively on the effects of vitamin E supplementation in paediatric populations. However, this study had certain limitations. The use of different forms and formulations of vitamin E across the included trials may have influenced our findings. Additionally, the limited number of clinical trials investigating the efficacy of vitamin E in children restricts the generalisability of the results.
Conclusion
This updated systematic review and meta-analysis provides a comprehensive approach to vitamin E treatment and its effect on cardiometabolic factors and liver function tests. The current meta-analysis of randomised controlled trials provides evidence of the reducing effects of vitamin E on TC, HOMA-IR, ALT and AST levels in children with MASLD.
Supplementary material
For supplementary material/s referred to in this article, please visit https://doi.org/10.1017/S0007114525105400
Acknowledgements
None.
No financial support.
P. P. and V. M. designed the research; M. M. and Ma. M. conducted the research; A. H. F. performed the statistical analysis and P. P., M. M., and P. P. wrote the paper. R. Z. and A. H. F. are responsible for the final content. All the authors have read and approved the final manuscript.
No competing interest declared by the authors.
Ethical approval was not applicable for this systematic review and meta-analysis.
Consent for publication: Not applicable.
The data used to support the findings of this study are available from the corresponding author upon request.